*e-mail: [email protected]
Relationship between Density and Anatomical Structure of Different Species
of
Eucalyptus
and Identification of Preservatives
Rafael C. Abruzzia*, Berenice A. Dedavida, Marçal J. R. Piresb, Suzana F. Ferrarinia
aFaculty of Engineering, Pontifical Catholic University of Rio Grande do Sul – PUCRS, Av. Ipiranga, 6681, CEP 90619-600, Porto Alegre, RS, Brazil
bFaculty of Chemistry, Pontifical Catholic University of Rio Grande do Sul – PUCRS, Av. Ipiranga, 6681, CEP 90619-600, Porto Alegre, RS, Brazil
Received: January 6, 2013; Revised: July 19, 2013
The species and density of Eucalyptus wood poles installed in the electrical network are useful parameters which must be considered when it is necessary to establish the service life of these structures. In this work, eucalyptus poles samples were collected and analyzed by scanning electron microscopy and energy dispersive spectroscopy (SEM/EDS). SEM image analysis showed that the lumen diameter average of iber substantially is variable between the three species studied, in line with the wood density obtained in laboratory, for poles with several years in service in the electricity network, as well as for not used poles. In addition, EDS microanalysis was utilized for identify the presence of chemical preservatives employed in the conservation these poles. The analysis method proposed proved effective for characterization for this timber.
Keywords: CCA, density, lumen, scanning electron microscopy, treated wood
1. Introduction
In Brazil, particularly in the southern states, Eucalyptus poles account for 79% of the utility poles in service within the electricity distribution network1. These structures are manufactured from planted forests containing a wide variety of Eucalyptus species, also used for other purposes.
Eucalyptus poles generally exhibit outstanding tensile strength, low density and reduced manufacturing costs when compared with their steel and concrete counterparts.
However, wood in service or storage is subject to deterioration by fungi and insects, even when treated with chemical preservatives. Chemical compounds such as CCA (chromated copper arsenate), a water soluble preservative, are used to treat Eucalyptus poles. CCA is an excellent fungicide and insecticide due to the presence of copper and arsenic, respectively, while the chromium acts as a ixing agent binding the other two elements to the wood. After impregnation, the chemical components of the CCA solution react amongst themselves and with those of the wood, binding together to form water-insoluble compounds2,3.
The use of creosote, an important development in the history of wood preservation, with wood treated by large-scale pressure impregnation, has been widely employed as a preservative in wood structures for a variety of uses4. Prior to being banned in Brazil in 1998, it was the preferred treatment method, giving the wood a dark coloration and proving highly effective5.
Vidor et al. report an accelerated decline in the state of conservation of certain Eucalyptus species as a result of negligence in manufacturing processes and species selection6. Boron and luorine-based curative treatments
have proven effective when applied directly to the areas most exposed to microorganisms during routine inspections7.
In light of growing concern over the disposal of treated wood waste, a number of methods have been studied to screen toxic elements harmful to the environment. Companies are increasingly concerned about the disposal or decontamination of waste from treated poles, particularly in the case of CCA, due to the presence of chromium and arsenic8.
Several methods can be used to identify and quantify the elements present in treated waste wood. Williams reports that conventional analytical methods are generally lengthy and complex when compared to EDS microanalysis used by Helsen and Hacala9,10. Pedersen and Ottosen applied SEM/EDS to evaluate changes in the chemical composition of ash from burning CCA-treated wood, before and after the extraction process11. In addition to identification, morphological characterization of different species of
Eucalyptus can be performed by electron microscopy. Chinga-Carrasco, Johnsen and Oyaas applied field emission SEM and computerized image analysis to quantify the cell wall characteristics of mechanically, chemically and enzymatically altered cellulose ibers12.
In order to achieve greater eficiency when using wood in engineering applications, its characteristics or physical properties should be considered13. According to Lobão et al., one of the most important parameters when classifying wood is density, since it is directly related to the mechanical properties of each Eucalyptus species14.
with respect to strength and lexibility with morphologic properties determined by a binocular microscope. Fibers with thinner walls and wider lumens showed less strength and greater flexibility, while those with thicker walls and narrower lumens were harder and less flexible15. Shimoyama reports that the density of Eucalyptus wood is a highly complex property since, in addition to involving a combination of anatomical elements, it also depends on the chemical compounds present16. Thus, if the use of wood for a speciic application depends on its density and mechanical properties, which in turn can be inluenced by its anatomical structure, it follows that density is related to the latter.
Relating the physical properties of wood to its anatomy is simple in new wood, but far more complex in wood with several years of service, as in poles from the electricity network due to its greater deterioration and absence of information.
The objective of the present study was to determine the relationship between the basic and apparent density of
Eucalyptus wood and its anatomical structure in different species, using electron microscopy to estimate density. Moreover, we sought to validate the use of EDS to identify the presence of CCA components and luorine in wood structures.
2. Material and Methods
For purposes of analysis, wood samples were collected from six new poles and thirty-three utility poles within the electricity distribution network, with varying service times. Of the six new poles analyzed, three were CCA-treated and three had not undergone chemical treatment. Among the thirty-three poles removed from the electricity network, twenty-six had been treated with CCA preservative and seven with creosote. Of the twenty-six CCA-treated poles, two received boron and luorine-based curative treatment and one underwent CCA extraction. The species Eucalyptus grandis, Eucalyptus saligna and Eucalyptus citriodora (Corymbia), the most widely used in the manufacture of utility poles in South Brazil,were selected for new poles untreated in order to relate iber morphology with density. Decommissioned poles were randomly chosen from a batch of more than 10 000 structures, whose species were unknown, as are those of the three new and chemically treated poles.
Sections approximately 0.50 m long were cut just above where the pole most likely meets the ground, and used to prepare test specimens (TS) measuring 150 × 50 × 50 mm. These were submitted to density determination
using the stereometric method, in accordance with NBR 7190[17] guidelines.The density at 0% (ρ
0) moisture of the specimens was determined by dividing the weight of the specimen dried in stove by nine hours the volume obtained by the dimensions of the specimens. Using Equation 1 proposed by Rezende, Escobedo and Ferraz18, was obtained value of the basic density (ρb) for each specimen analyzed. The apparent density (ρap) was determined by dividing the weight of the specimen (wet) by volume obtained by the dimensions of the specimens.
2
0 0
( 0, 28 ) b
ρ = ρ − ρ (1)
Samples of around 5 mm were taken from the center of the pith, the sapwood and heartwood of new poles were packaged under vacuum, ixed on the metallic support and then submitted to metallization process with Au and Pd performed to increase the conduction electric sample were subsequently analyzed in a scanning electron microscope coupled to a Philips XL 30 energy dispersive spectrometer (EDS). Cuts were made in two directions: parallel to the stem axis, for treatment identiication, and perpendicular to the stem axis, for morphological assessment. The images were processed using ImageJ software to obtain average
lumen diameter. The degree of association between basic and apparent density and lumen diameter was determined by Pearson’s correlation coeficient, with a p-value of 0.05.
To determine the initial concentration of Cu, Cr and As, all wood samples with particle size ≤ 425 µm were decomposed in a microwave. For this purpose the samples was added a mixture of HNO3 and H2O2 after the mixture was submitted to a heating program. Thereafter, the resulting solutions were transferred to polypropylene vials and the volume adjusted with deionized water. ICP-MS Elan Model 6000 (Perkin-Elmer) was used to determine the concentrations of the samples.
In the CCA extraction procedure, described by Ferrarini19, samples with particle size ≤ 9,5 mm and extractor (H2SO4) were placed in contact in a glass-reactor attached a condenser which is used to avoid losses of elements by volatilization and minimized the reactor pressure. Then the reactor was put to a shaker operated at about 500 rpm and after was heated in a heating mantle. The extraction was performed in three cycles in two hours followed by three washing steps one hour each. After the extraction the wood samples were submitted to the decomposition process cited earlier, to determine the inal amount decontaminated. Fluorine analysis was performed using an ion-selective electrode20. Findings were compared with the EDS spectra obtained.
Table 1. Mean values for density and lumen diameter of wood ibers from different species of eucalyptus new untreated.
Species Average Lumen Diameter (µm)
Nº of Measurements
Mean ρb
(Laboratory) (kg/m3)
Mean ρap
(Laboratory) (kg/m3)
ρap NBR
7190/97[17] (kg/m3)
E. citriodora 2.34±1,38 95 697±15.3 979±29,1 999
E. saligna 4.87±1,68 175 589±15.3 781±23,3 731
E. grandis 7.95±2,33 150 440±26.4 563±41,1 640
3. Results and Discussion
3.1.
Correlation between timber density and
morphology
Microscopic analyses of cross-sections taken at random points of the pith, heartwood and sapwood were used as a parameters to relate iber density with morphology for the species Eucalyptus citriodora (Corymbia), Eucalyptus
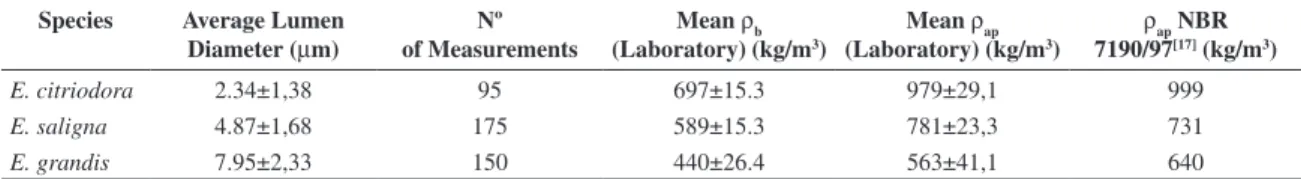
saligna and Eucalyptus grandis. Figure 1 (from a to c) shows images of Eucalyptus grandis wood, indicating substantial uniformity in lumen diameter for the three regions evaluated. Similar results were found for the other species studied in new poles and those removed from the network. Average lumen diameter considering all three regions (sapwood, heartwood and pith) was used to correlate timber morphology with density.
Oliveira, Hellmeister and Tomazello observed a tendency of various species of the genus eucalyptus wood basic density increased from pith to bark and each species shows a different proile of varying density in both longitudinal and cross-sections, with the species
E. citriodora (Corymbia) the most uniform21.
Table 1 shows the average lumen diameter of ibers for samples from untreated new poles, compared to the density value established in laboratory. Data obtained for each of the species studied was consistent with the relationship observed by Poubel et al.22, who found a strong relationship between the density of some Eucalyptus species and the average lumen diameter of ibers determined using a binocular microscope from a sample pretreated. Signiicant differences in lumen diameter between the Eucalyptus species shown in Figure 2 were also recorded by Shimoyama, where the largest diameter was found in less dense timber such as
E. grandis16.
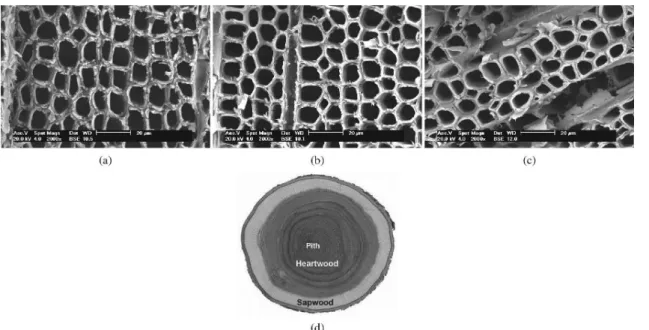
Given that the lumen diameter of ibers demonstrated a relationship with the density of the new poles evaluated, we extended the analysis to include those removed from service in order to conirm this correlation between the two variables. Images of samples removed from four such utility poles are shown in Figure 2 from a to d. The samples were collected from the healthy portion of the sapwood, which exhibited similar characteristics to the other regions.
Randomly selecting thirty poles withdrawn from the electricity network favored the occurrence of poles with varying service times and different treatments among the samples. Table 2 shows data obtained for pole number 6, 7 and 27, all CCA-treated and with different service times, and pole number 4, treated with creosote. Treatments using CCA, Creosote and CCA + Boron-Fluorine did not alter lumen diameter and variations in wood density were negligible. Service time within the electricity network also did not inluence the data analyzed, likely because samples were taken from healthy areas of wood. Therefore, the data presented conirm that denser species exhibit smaller lumen diameter, regardless of the existence or type of treatment.
Figure 3 demonstrates the behavior of basic and apparent density, measured in laboratory, with the lumen diameter of ibers for the thirty poles removed from service. A negative correlation was found between these two variables, evidenced by the strong Pearson correlations observed. Basic density displayed more significant correlations (0.84) and p-value (9.27×10⁻⁹) with lumen diameter when compared to apparent density (0.81 and 4.90×10⁻⁸), with a signiicance level less than 5% in both cases. It is important to underscore that moisture is a factor that may interfere in correlations with respect to apparent/bulk density, since the latter considers damp wood, and microscope analyses were performed on dry wood.
Figure 2. SEM images in cross-sections of sapwood. In (a) Pole 7, (b) Pole 6, (c) Pole 4 and (d) Pole 27.
Figure 3. Density variation with the lumen diameter of ibers. (a) Basic density and (b) Apparent density.
Table 2. Average lumen diameter of ibers and wood density for decommissioned poles.
Sample Preservative Manufactured wLumen (µm) ρap (kg/m
3) ρ
b (kg/m 3)
7 CCA 2003 8.03 516 445
6 CCA 2004 6.43 580 407
27 CCA 1995 2.92 867 625
4 Creosote - 2.38 959 678
As with the present study, Zbonak et al. analyzed variations in the morphological structure by luorescence microscopy and density of wood among different Eucalyptus species and found that fiber properties significantly
inluenced wood density, making timber from trees with wider lumens signiicantly lighter23.
correlating this with the lumen diameter of the ibers, even in Eucalyptus wood with long time use. The species and density of Eucalyptus wood poles installed in the electrical network can not be easily identified by conventional methods. On the other hand, the density and the species is useful parameters which must be considered when it is necessary to establish the service life of these poles in the electrical network, that is in the determination of the actual condition of those structures24.
3.2.
Identification of preservatives using
tangential sections
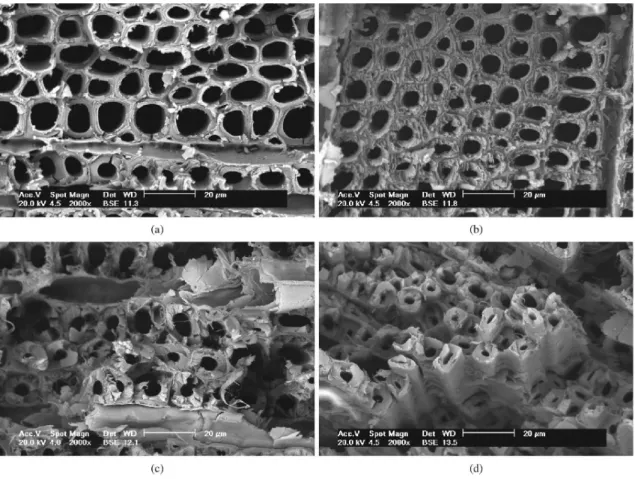
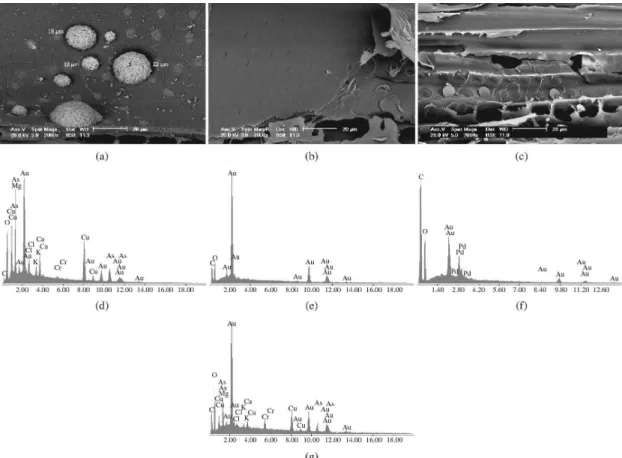
In order to locate elements of CCA in new and decommissioned poles, wood samples taken from three new poles treated with CCA and thirty poles removed from the electricity network were submitted to EDS analysis. Table 3 shows the concentrations of chromium, copper and arsenic present in the three new poles and three of those removed from service. EDS analyses conducted on three samples taken from the sapwood, heartwood and pith of a new pole (2) treated with CCA are shown in Figure 4.
EDS analyses revealed significant occurrence of chromium, copper and arsenic in only the sapwood samples for tests performed over the total area of the image, corresponding to 10 mm2, and on speciic regions of approximately 2 µm2 over precipitates, light-colored areas and clusters. In the heartwood and pith, this technique identiied none of the three CCA components. Similarly,
Santos reported that conventional analytical methods found no CCA metals in the pith, and concentrations of chromium, copper and arsenic recorded in sapwood were greater in samples taken near the trunk surface, decreasing toward the pith20.
Figure 4a shows rounded precipitates, indicating a cluster associated to components of the preservative. Pedersen and Ottosen observed that mineral particles of chemical elements in the wood matrix may be associated or not to preservative components. Aluminum silicates and phosphates are not correlated to constituents of the preservative. Moreover, arsenic in association with calcium may form Ca-arsenate. The authors also report that a
Figure 4. SEM images of a new pole (2) with CCA. In (a), (b) and (c) sapwood, heartwood and pith respectively. In (d), (e) and (f) EDS analysis of the total area in each of the images. In (g) EDS analysis of precipitate 1.
Table 3. Total retention values for Copper, Chromium and Arsenic for samples from new poles and those removed from service preserved with CCA.
Pole Retention (mg/kg)
Cu Cr As
New (1) 2457 3547 2834
New (2) 1778 2509 2193
New (3) 2484 3299 2762
25 847 1733 1458
27 588 781 707
28 2037 4152 1694
substantial portion of the chromium in the preservative can be found as Cr-arsenate (CrAsO4), either ixed onto the lignin or in the form of precipitates. Copper is present precipitated on the surface together with mineral inclusions
and as CuCrO4. In addition, arsenic may be associated with calcium, which is found in the porous regions of the timber11. Although EDS microanalysis only identiies the elements present in the area of the electron beam, the spectrum
in Figure 4g shows peaks corresponding to magnesium, potassium, chloride and calcium, suggesting that elements of the preservative are associated with wood components in the form of precipitates.
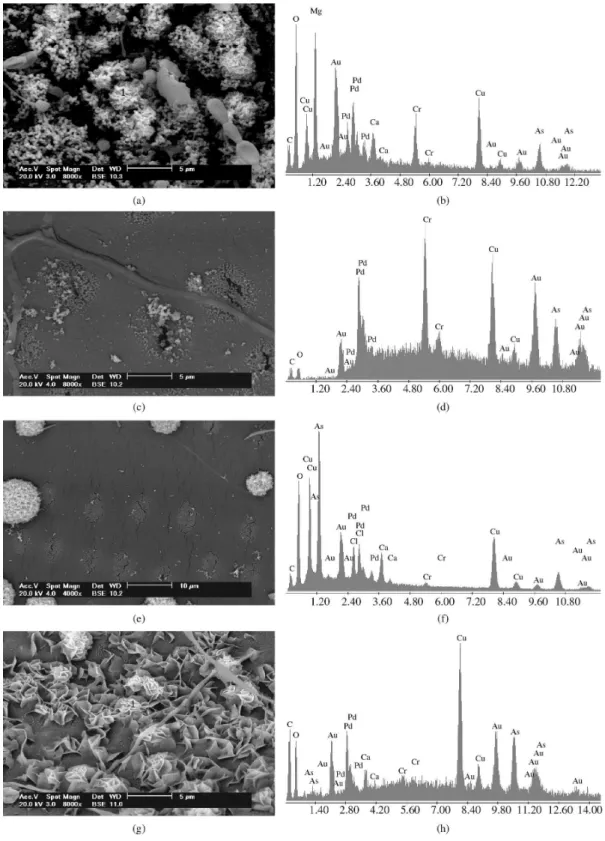
The methodology used in combining EDS analyses with scanning electron microscopy proved adequate in identifying CCA components in new poles and as such, was also applied to test poles removed from service. In both the new and decommissioned poles, chromium, copper and arsenic were detected only in sapwood samples, even for poles with several years of service. This conirms the effectiveness of chromium as a ixing agent for the fungicides copper and arsenic as reported by Van den Broeck8, partially preventing their diffusion and dispersion, since evidence of these elements was not found in the heartwood and pith, because in the heartwood according Costa5 formation occurs in the vessel tiles will providing a very low permeability. The sapwood exhibited several formations of preservative associated with wood components in the form of individual precipitates of varying sizes, clusters, in light-colored areas or impregnated in the timber, as shown in Figure 5.
The Figure 5 depicts a sample from the pole (12) subjected to EDS testing (Figure 5b) on a group of precipitates, in region 1. Peaks are evident corresponding to the three components of the preservative (copper, chromium and arsenic), though more intense for copper as well as magnesium and calcium peaks, predominant elements in wood.
Elements found in clusters of the pole sample (15), Figure 5c, in region 1, are also representative of the three
CCA components, as shown by the EDS spectrum in Figure 5d; however, in this case the chrome peak is more intense than the other elements in the sample. The rounded precipitates observed in the new poles treated with CCA were also present in samples of pole (16), as per Figure 5e. EDS analysis of the precipitate in Figure 5f demonstrates that, in addition to chromium, copper and arsenic, chloride and calcium are also present.
Figure 5g corresponds to the sample from pole (27), showing rosettes formed by small panels. EDS analyses of the rosettes in region 1 show greater intensity for copper peaks, followed by chromium and arsenic. A small amount of calcium, a characteristic element in wood, was also detected. Thus, there was a predominant presence of preservative in all the samples tested, irrespective of the service life of the pole. Of the twenty-three poles treated with CCA, only one did not exhibit the simultaneous occurrence of all three preservative components, with only arsenic and chromium identiied in both the matrix and precipitates.
Furthermore, we observed that copper aggregated more than the other components, given that more intense copper signals were always recorded in the clusters, and not the matrix, for most samples tested.
Helsen and Hacala studied precipitates of preservative components in timber samples analyzed after burning and found precipitates of minerals associated with preservative components, whose composition and size were highly varied and different from those observed in the present study10.
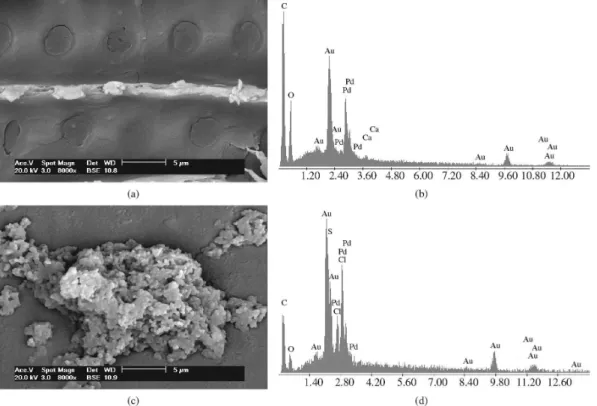
In the sapwood samples of the seven poles treated with creosote and submitted to EDS testing, only precipitates of
calcium, chloride and sulfur were observed, as per Figure 6. Although calcium is a characteristic element of wood, sulfur is not, and has been used in conjunction with chloride to fortify phenolic substances, increasing the toxicity of creosote, which could be an indication of the presence of this preservative in wood.
In samples of the two wood poles treated with CCA and retreated using Boron-Fluorine preservative, EDS only detected signiicant amounts of luorine. Samples from new poles containing 82.0 mg/kg of luorine showed no peaks related to luorine or boron; however, luorine peaks were observed in EDS spectra for samples with 362.4 mg/kgof luorine.
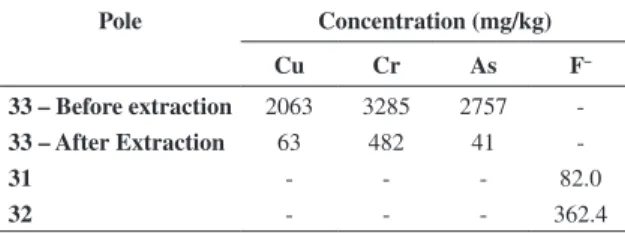
Wood samples from poles treated with CCA submitted to extraction were analyzed by EDS before and after this process. Testing conducted after extraction showed a signiicant reduction in chromium peaks and no arsenic or copper peaks, even in samples that exhibited high concentrations of these elements prior to extraction. This decline in concentration was also observed in chemical analysis, with the resulting concentrations presented in Table 4. EDS analysis identified very low chromium content (482 mg/kg), but did not detect the presence of As (41 mg/kg) or Cu (63 mg/kg) in decontaminated wood.
In microscopes containing conventional EDS spectrometers, the established detection limit is from boron (Z=5) to uranium (Z=92); however, for safety reasons some manufacturers recommend considering sodium (Z=11) as the lower limit of detection due to the physical limitations of the technique for elements with a low atomic number. On the other hand, the minimum detectable concentration for light elements is 1.2 wt% and 1.0 wt% for heavier elements. For any result lower than these weights the element should be considered as merely “present”25. This is the case for
boron, which has a low atomic number, and may be the case of luorine (Z=9), however this is not true for the copper (Z=29) and arsenic (Z=33) found in the samples analyzed. Therefore, it can be established that amounts of boron were below the detection limits of the EDS equipment for wood samples submitted to extraction.
This method of analysis is important in identifying the density which may ultimately contribute to the determination of the species of wood in new poles and those in service, as well as rapidly detecting the presence of chemical treatments in timber. The identiication of CCA and Creosote in decommissioned poles is signiicant due to the high toxicity of these preservatives, since once they are discarded and subject to weathering it is often impossible to determine whether the timber has been treated or not. It is important to note that Scanning Electron Microscopy and Energy Dispersive Spectrometry are non-destructive techniques used for compositional analysis or to deine probable density among known wood species, given that samples required for analysis are very small in relation to the size of utility poles.
4. Conclusions
The lumen diameter of Eucalyptus wood observed by scanning electron microscopy showed no signiicant differences between the three regions studied within a same species (heartwood, sapwood and pith).
The average lumen diameter of ibers varied between the Eucalyptus species studied, resulting in substantial differences in density. The analysis method proposed proved effective for rapid and approximate determination of density for this timber.
SEM/EDS analysis was eficient in detecting the presence of CCA components, regardless of their concentration in the treated wood, enabling quick identiication and helping to better distribute residues of this material, even after the extraction process. The technique was also effective in detecting high concentrations of luorine in the wood.
Acknowledgements
The authors would like to thank AES Sul Distribuidora Gaúcha de Energia for funding the project. R. Abruzzi and S. Ferrarini are grateful to the Council for Scientiic and Technological Development (CNPq) and the Brazilian Federal Agency for the Support and Evaluation of Graduate Education (CAPES) for scholarships granted.
Table 4. Concentrations of copper, chromium and arsenic in a decommissioned pole (33) before and after decontamination by acid extraction, and Fluorine content of poles submitted to preventive (CCA and Creosote) and curative treatment (Boron/Fluorine).
Pole Concentration (mg/kg)
Cu Cr As F–
33 – Before extraction 2063 3285 2757
-33 – After Extraction 63 482 41
-31 - - - 82.0
32 - - - 362.4
References
1. Cruz MAO. Avaliação de Método Instrumental de Inspeção
de Postes de Madeira em Serviço na Rede de Distribuição de Energia Elétrica. [Tese]. Porto Alegre: Pontiical Catholic
University of Rio Grande do Sul; 2011.
2. Dawson BSW, Parker GF, Cowan FJ and Hong SO. Interlaboratory Determination of Copper, Chromium and Arsenic in Timber Treated With Preservative.
Analyst. 1991; 116:339-46. http://dx.doi.org/10.1039/ an9911600339
3. Williams AI. The Extraction and Determination of Copper, Chromium and Arsenic in Preserved Softwoods.
Analyst. 1970; 95:670-74. http://dx.doi.org/10.1039/ an9709500670
4. Shupe TF, Hse CY and Roliadi H. Removal of Creosote From Wood Particles at Different Horizontal and Vertical Locations of Decommissioned Poles Using Steam Treatment. Wood and Fiber Science. 2006; 38:345-50.
arlindo/materiais/APOSTILANATOMIA1.pdf>. Access in: 30/10/2010.
6. Vidor FLR, Pires M, Dedavid BA, Montani PDB and Gabiatti A. Inspection of wooden poles in electrical power distribution networks in southern Brazil. IEEE Transactions on Power Delivery. 2009; 25:479-84. http://dx.doi.org/10.1109/ TPWRD.2009.2034913
7. Morrell JJ and Freitag C. Development of Threshold Values for Boron and Fluoride in Non-Soil Contact Applications. Forest Products Journal. 2005; 55:97-101.
8. Van den Broeck K, Helsen L, Vandecasteele C and Van den Bulck E. Determination and Characterization of Copper, Chromium and Arsenic in Chromated Copper Arsenate (CCA) Treated Wood and its Pyrolysis Residues by Inductively Coupled Plasma Mass Spectrometry. Analyst. 1997; 122:695-700. http://dx.doi.org/10.1039/a701702b
9. Williams AI. The Use of Atomic-absorption Spectrophotometry for the Determination of Copper, Chromium and Arsenic in Preserved Wood. Analyst. 1972; 97:104-10. http://dx.doi. org/10.1039/an9729700104
10. Helsen L and Hacala A. Formation of metal agglomerates during carbonization of chromated copper arsenate (CCA) treated wood waste: Comparison between a lab scale and an industrial plant. Journal of Hazardous Materials. 2006; 137:1438-1452. PMid:16737775. http://dx.doi.org/10.1016/j. jhazmat.2006.04.041
11. Pedersen AJ and Ottosen LM. Elemental analysis of ash residue from combustion of CCA treated wood waste before and after electrodialytic extraction. Chemosphere. 2006; 65:110-6. P M i d : 1 6 5 8 4 7 5 5 . h t t p : / / d x . d o i . o r g / 1 0 . 1 0 1 6 / j . chemosphere.2006.02.021
12. Chinga-Carrasco G, Johnsen PO and Oyaas K. Structural
quantiication of wood ibre surfaces-Morphological effects
of pulping and enzymatic treatment. Micron. 2010; 41:648-59. P M i d : 2 0 3 6 3 6 3 9 . h t t p : / / d x . d o i . o r g / 1 0 . 1 0 1 6 / j . micron.2010.03.002
13. United States Department of Agriculture - USDA. Wood Handbook - Wood as an Engineering Material. Centennial Edition; 2010.
14. Lobão MS, Lucia RMD, Moreira MSS and Gomes A. Caracterização das Propriedades Físico-Mecânicas da Madeira de Eucalipto com Diferentes Densidades. SIF – Sociedade de Investigações Florestais. Revista Madeira. 2004; 28:889-94.
15. Dutt D and Tyagi CH. Comparison of various eucalyptus species for their morphological, chemical, pulp and
paper making characteristics. Indian Journal of Chemical Technology. 2011; 18:145-51.
16. Shimoyama VRS. Variações da densidade básica e
características anatômicas e químicas da madeira em Eucalyptus spp. [Tese]. Piracicaba: University of São Paulo; 1990.
17. Associação Brasileira de Normas Técnicas – ABNT.
NBR 7190/1997: Projeto de Estruturas de Madeira. ABNT; 1997. 18. Rezende MA, Escobedo JF and Ferraz ESB. Retratibilidade
Volumétrica e Densidade Aparente da Madeira em Função da Umidade. IPEF. 1988; 39:33-40.
19. Ferrarini SF. Estabelecimento de Metodologia Para Remoção de Cobre, Cromo e Arsênio de Resíduos de Madeira Tratada com Arseniato de Cobre Cromatado – CCA. [Tese]. Porto Alegre: Pontifical Catholic University of Rio Grande do Sul; 2012.
20. Santos HS. Padronização de Ensaios Para Identificação de Preservantes em Postes de Madeira e Solos de Áreas Controladas. [Tese]. Porto Alegre: Pontifical Catholic University of Rio Grande do Sul; 2010.
21. Oliveira JTS, Hellmeister JC and Tomazello MF. Variação do Teor de Umidade e da Densidade Básica na Madeira de Sete Espécies de Eucalipto. Revista Árvore. 2005; 29:115-27. http:// dx.doi.org/10.1590/S0100-67622005000100013
22. Poubel DS, Garcia RA, Latorraca JVF and Carvalho AM. Estrutura anatômica e propriedades físicas da madeira de
Eucalyptus pellita F. Muell. Floresta e Ambiente. 2011; 18:117-26. http://dx.doi.org/10.4322/loram.2011.029
23. Zbonak A, Bush T and Grzeskowiak V. Comparison of tree growth, wood density and anatomical properties between coppiced trees and parent crop of six Eucalyptus genotypes.
IUFRO - Improvement and Culture of Eucalyptus. 2007; 1-10. 24. Abruzzi RC, Pires MR, Dedavid BA and Kalil SB. Relação
das propriedades mecânicas e densidade de postes de madeira de eucalipto com seu estado de deterioração. Revista Árvore. 2012; 36:1173-81. http://dx.doi.org/10.1590/S0100-67622012000600018
25. Goldstein JI, Newbury DE, Echlin P, Joy DC, Fiori C and Lifshin E. Scanning Electron Microscopy and X-ray Microanalysis. New York: Plenum Press; 1992. http://dx.doi. org/10.1007/978-1-4613-0491-3
26. Associação Brasileira de Normas Técnicas – ABNT.
Relationship between Density and Anatomical Structure of Different Species
of
Eucalyptus
and Identiication of Preservatives
Characteristics Density Lumen
Sample Year Length (m)
Class
Inspection Preservative
ρap ρb ρ0 Class
AW (µm)
SD SD
(%)
Nº Measurements (kg/m3) SD SD
(%)
(kg/m3) SD SD (%)
(kg/m3) SD SD (%)
NBR 8456
1 1991 11 2 CCA 968 30.8 3 678 18.3 3 910 37.1 4 6D 2.58 1.36 53 20
2 1994 9 3 CCA 994 15.2 2 682 8.4 1 918 17.5 2 6D 3.6 1.2 33 29
3 9 3 CCA 1028 28.2 3 704 7.8 1 965 17 2 7D 2.42 0.99 41 48
4 9 4 CRE 959 23.4 2 678 4.2 1 910 8.6 1 6D 2.38 0.6 25 21
5 2005 9 1 CCA 548 15.3 3 393 35.6 9 450 18.1 4 - 7.1 2.43 34 47
6 2004 11 1 CCA 580 33.5 6 445 32 7 522 45.3 9 1D 6.43 2.39 37 60
7 2003 9 2 CCA 516 19.9 4 407 11.5 3 468 15.6 3 1D 8.03 2.48 31 60
8 1999 9 2 CCA 630 15 2 472 12.1 3 560 17.6 3 2D 7.08 2.91 41 50
9 1998 9 2 CCA 570 10.9 2 437 2.2 0 510 3 1 1D 7.73 2.4 31 35
10 1992 9 2 CCA 482 4.1 1 376 6 2 427 7.9 2 - 9.56 3.28 34 36
11 2002 11 3 CCA 597 11.4 2 467 77.7 2 553 11.1 2 2D 9.14 3.42 37 49
12 1994 9 3 CCA 532 40.6 8 420 28.7 7 487 40 8 1D 9.6 4.51 47 33
13 9 3 CCA 563 44.1 8 433 33.7 8 504 47 9 1D 6.89 2.12 31 55
14 2000 9 4 CCA 518 8.2 2 394 8.4 2 450 11.3 3 - 10.41 2.23 21 39
15 1991 11 1 CCA 697 20.9 3 530 12.1 2 648 18.9 3 3D 4.69 1.82 39 41
16 1997 9 1 CCA 689 15.6 2 484 26.3 5 577 39 7 2D 4.79 1.68 35 38
17 1991 10 2 CCA 738 20.5 3 556 12 2 689 19.6 3 4D 6.55 2.73 42 60
18 9 3 CRE 773 35.9 5 554 29.3 5 685 47.5 7 4D 4.47 2.21 49 41
19 1985 11 4 CCA 707 57.9 8 537 37.3 7 659 58.7 9 3D 6.41 2.54 40 34
20 11 4 CCA 742 44.6 6 564 26.2 5 702 42.8 6 4D 4.84 1.82 38 46
21 1986 9 1 CRE 944 19.5 2 621 10.1 2 821 18.6 2 5D 7.01 2.69 38 33
Class Inspection: Class of deterioration of the pole, determined in the ield, with 1 being the most sound pole and 4 post more deteriorated; Class NBR 8456: There are 9 classes of basic density ranging from 400 to 800 kg.m–3 according to the classiication of the proposed revision of NBR 8456[26]; A
W: Average lumen width of ibers;SD: Standard Deviation.
Abruzzi et al.
Characteristics Density Lumen
Sample Year Length (m)
Class
Inspection Preservative
ρap ρb ρ0 Class
AW (µm)
SD SD
(%)
Nº Measurements (kg/m3) SD SD
(%)
(kg/m3) SD SD (%)
(kg/m3) SD SD (%)
NBR 8456
22 9 1 CRE 928 47 5 617 23.2 4 794 41 5 5D 6.09 2.91 48 40
23 9 1 CCA 904 12.1 1 644 11.5 2 844 21.9 3 5D 4.88 2.23 46 67
24 9 1 CRE 892 23.7 3 625 10.6 2 808 19.4 2 5D 4.63 3.98 86 36
25 2004 9 2 CCA 831 14.9 2 602 7.3 1 766 12.8 2 5D 4.98 2.61 52 34
26 1995 10 2 CCA 948 19.4 2 699 10.6 2 892 21.2 2 6D 3.3 0.84 26 26
27 1995 9 2 CCA 867 18.1 2 625 7.6 1 808 13.8 2 5D 2.92 1.2 41 39
28 1992 9 3 CCA 869 85.8 10 625 46.3 7 810 83.7 10 5D 5.97 1.71 29 29
29 9 4 CCA 928 50.8 5 632 7.2 1 821 13.3 2 5D 5.1 2.52 49 44
30 9 2 CRE 1044 13 1 717 15.5 2 994 35 4 7D 4.19 1.67 40 31
31 2005 11 2 CCA
32 - 9 2 CRE
33 1994 9 3 CCA
C.
citriodora 2009 9 New SEM 979 29.1 3 697 15.3 2 951 32.5 3 6D 2.51 1.38 59 95
E. saligna 2009 9 New SEM 781 23.3 3 589 15.5 3 744 26.4 4 4D 5 1.68 34 175
E. grandis 2009 9 New SEM 563 41.1 7 440 26.4 6 515 37.4 7 1D 7.94 2.33 29 150
New (1) 2009 9 New CCA 649 51.8 8 440 18.5 4 514 26 5 1D
New (2) 2009 10 New CCA 536 10.4 2 398 5.4 15 456 7.2 2
-New (3) 2009 11 New CCA 658 91.6 14 425 30.4 7 493 41.6 8 1D
Class Inspection: Class of deterioration of the pole, determined in the ield, with 1 being the most sound pole and 4 post more deteriorated; Class NBR 8456: There are 9 classes of basic density ranging from 400 to 800 kg.m–3 according to the classiication of the proposed revision of NBR 8456[26]; A
W: Average lumen width of ibers;SD: Standard Deviation.
Materials Resear