Synthesis and Characterization of CuNb
2O
6from an Oxalic Precursor Via Solid State
Reaction
Maria Veronilda Macedo Soutoa*, Maria José Santos Limaa, Cleonilson Mafra Barbosaa, Uilame
Umbelino Gomesb, Carlson Pereira de Souzac, Camila Pacelly Brandão de Araújoc
aUniversidade Federal do Rio Grande do Norte – UFRN, Tecnologia, Departamento de Ciência e
Engenharia de Materiais, Natal, RN, Brazil
bUniversidade Federal do Rio Grande do Norte – UFRN, Centro de Ciências Exatas, Departamento de
Física Teorica e Experimental, Natal, RN, Brazil
cUniversidade Federal do Rio Grande do Norte – UFRN, Tecnologia, Departamento de Engenharia
Química, Natal, RN, Brazil
Received: January 17, 2016; Accepted: June 13, 2016
The present paper’s objective was to synthesize and characterize both the oxalic niobium precursor (NH4)3NbO(C2O4)3.H2O, and the product of its doping with Cu and calcining, CuNb2O6. In order to obtain the niobium precursor, commercially available niobium oxide (Nb2O5) was subject to fusion with potassium bisulfate (KHSO4). Once leached with water, the powder was complexed with oxalic acid and ammonium oxalate. The as produced material was manually mixed with copper nitrate Cu(NO3)2.2H2O (25% Cu molar) and calcined at 1000°C in a mule furnace. CuNb2O6 was then obtained. The precursor was characterized by XRD, SEM, FT-IR, XRF, TG/DTG. The calcination product was characterized by XRD, XRF and SEM. Results show that single phase CuNb2O6 could be obtained by this method without Nb2O5 contamination.
Keywords: Precursor, solid-solid reaction, niobium oxide, copper, doping
1. Introduction
The use of niobium containing materials’ has gained much attention, on the later decades, due its various industrial applications. Among these, particular emphasis has been given to its use by aerospace industry, on the production of special alloys, as well as by electro-electronic industry,
where those materials ind application as capacitors Lima,
20101; Critical raw materials, 20132.
According to Lopes et.al 20143, the use of those materials
on several diferent industrial sectors has been making
niobium a decisive element on for the worldwide industrial development. For Brazil, the large scale use of niobium materials is of utmost importance as it possesses over 90%
of the world’s niobium reserves Leite, 19884.
Another use for niobium based materials that has grown in importance is in heterogeneous catalysis, where those materials have presented higher catalytic activity, selectivity and chemical stability than traditional noble metal based catalysts (Tanabe, 19905, specially niobium oxides. Investigation on niobium
oxides has focused on new active phases, promoters Ziolek,
20036 or supports Oliveira et. al, 20077; Cardoso et. al, 20128.
Main niobium oxides are: niobium pentoxide (Nb2O5), niobium dioxide (NbO2) and niobium oxide (NbO). Among
these, the irst is the most stable Lee, 19999.
On this paper, commercially available niobium pentoxide (Nb2O5) was used as a starting material for the synthesis of the precursor (NH4)3NbO(C2O4)3.H2O (trioxalate monohydrated ammonium oxiniobate), which was used for the production of niobium- copper mixed oxide.
According to Mathern and Rohmer 196910 this precursor
presents three oxalic groups in coordination with the metal-oxygen Nb=O core and forms a coordination compound with 5 bonds in the form of a coordination polyhedron with a pentagonal bi-pyramid structure with the given chemical formula.
This precursor’s use for the synthesis of niobium oxides has been proved feasible and interesting as it presents higher reactivity than the commercial niobium pentoxide, which allows the production of mixed oxides in single phases, without the presence of a second niobium oxide phase (Nb2O5 usually). This is due to its shape and small particle sizes (<2µm). Medeiros, 200211 was able to decrease both
time and temperature require for the synthesis of niobium carbide via gas solid reaction by using this material as niobium source. Traditional processes required temperatures over 1400°C with long reaction times (>6h) whilst this method was able to produce NbC at temperatures in the range from
820 – 980°C with 60-120min soaking time. Oliveira 201412
used this precursor for the synthesis of Nb2O5 and compared its catalytic activity to commercially available niobium
pentoxide for the oleic acid esteriication reaction, and owed
to the precursor the higher yield achieved.
Such characteristics justify the use of this precursor for the synthesis of niobium and copper mixed oxide in this paper. Copper was chosen as the second metal of the oxide
phase as it is known to enhance catalytic activity in hydrogen
oxidation processes’. Furthermore, Cu2+ ions can modify
magnetic behavior and electric transportation mechanism of the oxide Vasconcelos, 201013 which can be interesting
for use in capacitors or electrochemical reactions’ catalysts.
On this paper, refractory metals’ oxides were produced
by solid state reaction in a mule furnace using ine
(NH4)3NbO(C2O4)3.H2O precursor as starting material. For the precursor’s synthesis, commercially available niobium oxide (Nb2O5, Sigma Aldrich, 94.55%) was fused in platinum crucible with potassium bisulfate (KHSO4, Sigma Aldrich, 96.55%) at 1:7 wt. ratio. Afterwards it was crushed and decanted in water for 12h. Then, the solid was leached with hot water and later stirred with oxalic acid (H2C2O4, Sigma Aldrich, 99,95%) and ammonium oxalate (C2H8N2O4, Sigma Aldrich, 99,99%) at a 1:3 wt. ratio. The as produced material was then slowly evaporated with continuous stirring at 60°C to
promote particles agglomeration, and dried in mule furnace
for 24h. This process is in accordance to the methodology proposed by Medeiros. This powder was characterized by TG/DTG (SDT-600 TA instruments, N2 atmosphere),
FT-IR (Spectrophotometer Perkin Elmer – 16PC) and SEM
(SHIMADZU MEV SSX550) in order to better understand it weight loss behavior, morphology and chemical bonds, which
could afect the mixed oxide derived from it.
For the production of the mixed Nb/Cu oxide Vasconcelos’ 201013 methodology was used, this method consists on
manually mixing the as produced precursor with copper nitrate (Cu(NO3)2, Sigma Aldrich, 99,99%) in stoichiometric amounts according to the ratio Cu/Nb desired with the help of mortar and pestle. In this issue Cu/Nb= 25% molar.
The mixed powder was placed on a ceramic crucible and
loaded to a mule furnace (EDG Inox Line 3000, Brazil).
The furnace was heated with a 5°C.min-1 heating rate from
room temperature (25°C) to 980°C and held for 180min. The soaking time was established so that single phase CuNb2O6
could be obtained.
The as produced powder was characterized by XRF (SHIMADZU EDX-720, air atmosphere), SEM (SHIMADZU
MEV SSX550), XRD (SHIMADZU XRD- 6000, Cu-Kα, at 30 kV and 30 mA, with 2°.min-1step).
3. Results and Discussion
3.1 Precursor’s characterization
The precursor was characterized by thermogravimetric analysis (TG), as well as infra-red spectroscopy (IR) and scanning electron microscopy (SEM).
3.1.1 Infra-Red Spectroscopy
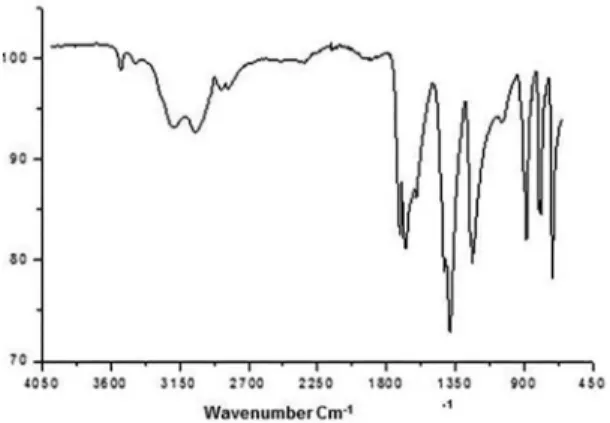
Figure 1 presents the IR spectra of the oxalic precursor. The binding bands close to 3539 cm-1 occur due to presence of
ammonia molecules in the precursor. The bans on the region
Figure 1: IR spectra of the niobium precursor (NH4)3NbO(C2O4)3.H2O.
of 3442 cm-1 and 3212 cm-1 are related to the crystallization
water. Those between 1714 cm-1 and 1241 cm-1 refer to
oxalic and oxalate groups in coordination with Nb, as well as the band at 793 cm-1 which can also be attributed to those
groups. It can be noted bands occurring at 889 cm-1, which
refer to the Nb=O bond, according to Marta et. Al, 198314.
3.1.2 TG/DTG analysis
Thermal stability of the precursor was evaluated by exploratory TG/DTG analysis carried out in nitrogen atmosphere with 5°C.min-1 heating rate from room
temperature to 1000°C
Figure 2 and Table 1 present the mass loss proile and the temperature ranges for each of the six steps identiied. The irst two steps occur in the range from 25ºC to 128°C
and correspond to a dehydration /crystallization process
accounting for 6.02 % mass loss (0.43157mg). From 128°C to 593°C four other weight loss events take place, and
account for 73.73 % (4.3493mg). Third and fourth events,
occurring in the range from 128°C and 306°C, correspond
to the decomposition of the ammonium oxalate part of the structure, with the liberation of CO, CO2 and NH3.From
306°C to 593°C two other mass loss’ events take place, accounting for 10.54% weight loss (1.8733mg). These could
be attributed to the CO2 evolution or to the crystallization of the decomposed material. However this event is not attributed to a decomposition step of the niobium complex,
according to Marta et. al 198314, and was, therefore, signed
to the desorption of the gas, which was produced at low temperature and was adsorbed on the complex’ surface. Further on, no other weight loss event can be noted and one can say that all volatile matter was eliminated. Therefore, the decomposition study from TG-DTG analysis accounted for a total 73.73% weight loss.
3.1.3 XRD analysis
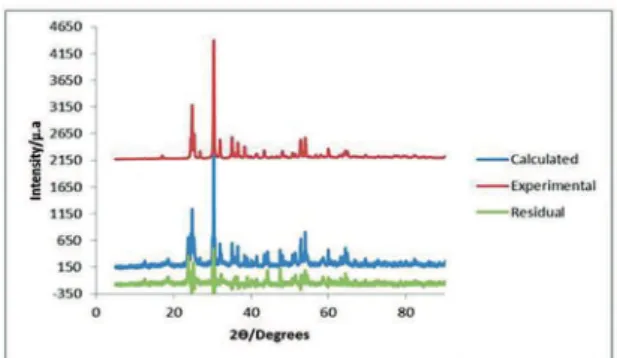
Figure 3 presents the XRD proile for the oxalic niobium
precursor ((NH4)3NbO(C2O4)3.H2O). The XRD pattern
presents high intensity peaks (the most intense at 29.70°),
characteristic of crystalline materials, while presenting also an amorphous part, responsible for the interference on the
Figure 2: TG/ DTG proile for the niobium precursor.
Table 1: Thermogravimetric evaluation of the (NH4)3[NbO(C2O4)3]. H2O from room temperature to 1000°C.
Material Steps Ti (ºC) Tf (ºC) Weight (%)
(NH4)3[NbO(C2O4)3].
H2O
1 25 94 3.97
2 94 128 2.05
3 128 205 43.68
4 205 307 22.51
5 306 320 8.79
6 320 593 1.74
Figure 3: XDR pattern of the niobium complex[(NH4)3NbO(C2O4)3.
nH2O].
3.1.4. SEM analysis
Figures 4(a) and (b) present the morphology of the oxalic precursor through SEM analysis of the material with
1000x and 5000x ampliications. Circled region of Figure
4(a) highlight small particles’ agglomerates. Amorphous regions can be observed as well, which is in agreement with the XRD pattern for this material. On Figure 4(b) larger particles can be observed.
Particles of diferent shapes are present in the agglomerate
displayed in Figure 4a, some of which have spherical form, while others are the form of platelets. According to Medeiros, 200211, these aspects depend on how the complex powder is
obtained from the complexing solution, i.e. on evaporation parameters, which can produce various materials in terms of particle shape and agglomerate sizes, though chemical characteristics are the same regardless of them.
Figure 4: SEM image of the niobium complex (precursor), (a) 1000x and (b)5000x.
3.2. Characterization of niobium and copper mixed
oxide
Niobium and copper mixed oxide was synthesized with 25% Cu (molar) and characterized by XRD, SEM-EDS and XRF.
3.2.1 XRD analysis and Rietveld reinement with
Maud sotware
Niobium and copper mixed oxide, CuNb2O6, (ICSD 71606- orthorhombic) was synthesized with 25% molar Cu and its XRD pattern is presented on Figure 5. Intense
and characteristic peaks, mainly at θ=31.62°, can be easily identiied. This compound was also identiied by other
authors (Vasconcelos, 201013) however Nb
2O5 was also
present in those papers.
Figure 5: XRD pattern for the copper-niobium mixed oxide.
Rietveld’s reining method was used to compare the
observed XRD pattern with the one obtained from the
calculations of the mathematical proile from structural data of the identiied phase.
Figure 6 presents the reined XRD pattern, indicating
the presence of CuNb2O6 with orthorhombic structure. It was possible to calculate crystallographic parameters that are presented on Table 2.
3.2.2 XRF and EDS
Figure 6: XRD spectra reined according to Rietveld method.
Table 2: Rietveld reinement of 25%CuNb2O6 using Maud Software.
Phases a(Å) b(Å) c (Å) α(°) ß(°) γ (°)
CuNb2O6 14.06 5.58 5.58 90 90 90
Density (g/ cm³)
Cell volume
(Å)
Crystallite size (nm)
(%) weight
S
5.71 4.45 384.5 100 1.49
composition. Table 3 refers to elemental composition found on niobium and copper oxide. XRF data indicates the presence of copper; however, as this analysis is semi-quantitative,
diferences between expected and observed values can
be noted. Also, as copper nitrate is a highly hygroscopic
compound, diferences on weighted and theoretical values
can be attained.
EDS’ results are presented on Table 4. Copper was also
identiied on the produced compound, conirming XRF
and XRD data. Obtained values are compatible with those
veriied by XRF.
3.2.3. SEM analysis
Morphological aspects of CuNb2O6 were observed through Scanning Electron Microscopy. Figures 7(a) and (b) present the observed morphology. It can be seen that the compound is highly agglomerated as it is composed of
ine particles of diferent sizes. On Figure 7(b) the presence
of randomly dispersed pores can be noted. Those present
themselves with diferent sizes and shapes, which is an
expected characteristic of this material.
Table 3: XRF elemental analysis of 25%CuNb2O6.
Analyte Molar (%)
Nb 76.75
Cu 23.25
Table 4: EDS elemental analysis of the 25%CuNb2O6 compound.
Element (%) Molar
Oxygen 43.42
Copper 22.95
Niobium 33.67
2000x and (b) 4000x.
In general, CuNb2O6 as obtained in this process, is produced as an agglomerated powder with particles with platelet’s morphology with various sizes. According to Fan 199116, this
behavior is explained on the basis of Van der Walls’ theory,
as short distances forces’ efect become more pronounced for
materials with nanoscale sizes. Toniolo, 200417 explains this
phenomenon on the basis of the minimization of free energy, as coalesced nuclei provide fewer interfaces with the medium.
4. Conclusions
The studied synthesis’ method has proved to be
efective for the production of the niobium precursor [tris
oxalate monohydrate ammonium oxiniobate] which, as TG/DTA analysis showed, decomposes into NH3, CO, CO2 and H2O to form niobium oxide with the temperature increase. The physical mixture of this precursor with copper nitrate followed by calcination produced niobium and copper mixed oxide.
XRD spectra of the precursor conirmed the amorphous
characteristic of it. Morphological observations revealed the presence of agglomerated particles with platelets’ shape.
The doping process was considered feasible for the production of mixed copper-niobium oxide, as XRD analysis indicated the formation of single phase CuNb2O6. EDS and XRF evaluation also showed the presence of copper in the calcining product in composition close to theoretical values.
Reitveld’s reinement of the microstructure was performed and attained a small deviation coeicient, which indicates
the consistency of the produced crystallographic information
with the material and identiied phase.
The mixed oxide compound’s morphology is basically
an agglomerated powder of diferent size and forms, some
in the shape of platelets and some with spherical appearance.
These difering morphologies are attributed to the attraction
and coalescence of nuclei/small particles.
5. Acknowledgments
Programa de Pós-Graduação em Ciências e Engenharia de Materiais- PPGCEM;
Universidade Federal do Rio Grande do Norte- UFRN;
Laboratório de Materiais Cerâmicos e Metais Especiais – LMCME;
Coordenação de Aperfeiçoamento de Pessoal de Nível Superior-CAPES
6. References
1. Lima, J. M. G.; Relatório Técnico 20 – Peril da Mineração do Nióbio, Ministério de Minas e Energia, 2010.
2. European Commission. Critical raw materials for the EU. [cited 2015 Apr 25]. Availavle from: http://ec.europa.eu/growth/
sectors/raw-materials/speciic-interest/critical/index_en.htm 3. Lopes OF, Mendonça VR, Silva FBF, Paris EC, Ribeiro C. Óxidos
de nióbio: uma visão sobre a síntese do Nb2O5 e sua aplicação em
fotocatálise heterogênea. Química Nova. 2015;38(1):106-117. 4. Leite RCC, Comim A, Leme CR, Pereira ES, Queiroz R. Nióbio: Uma Conquista Nacional. São Paulo: Livraria Duas Cidades; 1988.
5. Tanabe K. Application of niobium oxides as catalysts. Catalysis Today.1990;8(1):1-11.
6. Ziolek M. Niobium-containing catalysts—the state of the art. Catalysis Today.2003;78(1-4):47-64.
7. Oliveira LCA, Gonçalves M, Oliveira DQL, Guarieiro, ALN, Pereira
MC. Synthesis and catalytic properties on oxidation reaction of goethite containing niobium. Química Nova. 2007;30(4):925-929.
8. Cardoso FP, Nogueira AE, Patrício PSO, Oliveira LCA. Efect
of tungsten doping on catalytic properties of niobium oxide.
Journal of the Brazilian Chemical Society. 2012;23(4):702-709.
9. Lee JD. Química Inorgânica: não tão concisa. Tradução da 5a
edição inglesa. São Paulo: Edgard Blucher; 1999.
10. Marthern RW, Weiss R, Rohmer R. The crystal structures of ammonium oxotrioxalatoniobate monohydrate and ammonium diperoxodioxalatoniobate monohydrate. Journal of the Chemical Society D: Chemical Communications. 1969;2:70-71.
11. Medeiros FFP. Síntese de carbetos de tungstênio e nióbio a baixa temperatura, através de reação gás-sólido em reator de leito ixo [Tese de doutorado]. Natal: Centro de Tecnologia,
Departamento de Engenharia Química, Programa de Pós-Graduação em Engenharia Química, Universidade Federal do
Rio Grande do Norte; 2002. 145p.
12. Oliveira SA. Avaliação cinética e potencial do Nb2O5 obtido
a partir de um complexo de nióbio para formação do oleato de metila através da reação de esteriicação do ácido oleico
[Dissertação de Mestrado]. Natal: Programa de Pós-Graduação
em Engenharia Química, Área de Concentração: Engenharia de Processos – Universidade Federal do Rio Grande do
Norte; 2014.
13. Vasconcelos BR, Morais AMV, Lopes FWB, Souza CP. Estudo
da variação da concentração de cu na/no CuNb2O6 sintetizado
a partir de reação sólido-sólido. In: Anais XVIII Congresso Brasileiro de Engenharia Química COBEQ; 2010 Set 19-22; Foz do Iguaçu, PR.
14. Marta L, Zaharescu M, Macarovici C. Thermal and
structural investigation of some oxalato-niobium complexes I potassium tris(oxalato)oxiniobate. Revue Roumaine de Chimie.1979;24:1115-1122.
15. Lu L, Sahajwallaa V, Kong C, Harris D. Quantitative X-ray difraction analysis and its application to various coals. Carbon.
2001;39(12):1821-1833.
16. Fan M. Ceramic and glasses. In: Engineered Materials Handbook, v. 4. Materials Park: ASM International; 1991. p.270.
![Figure 3: XDR pattern of the niobium complex[(NH 4 ) 3 NbO(C 2 O 4 ) 3 . nH 2 O].](https://thumb-eu.123doks.com/thumbv2/123dok_br/18882817.423078/3.765.65.375.360.757/figure-xdr-pattern-niobium-complex-nh-nbo-c.webp)