*e-mail: [email protected]
Electrochemical Reversibility of Reticulated Vitreous Carbon Electrodes Heat
Treated at Different Carbonization Temperatures
Emerson Sarmento Gonçalvesa,b*, Mirabel Cerqueira Rezendea, Marta Ferreira Koyama Takahashic, Neidenêi Gomes Ferreirad
a
Divisão de Materiais, AMR/IAE/CTA, Centro Técnico Aeroespacial
bDepartamento de Aeronáutica e Mecânica, ITA/CTA, Centro Técnico Aeroespacial
c
Divisão de Química, AQI/IAE/CTA, Centro Técnico Aeroespacial,
12228-904 São José dos Campos - SP, Brazil
d
Laboratório Associado de Sensores, CTE/INPE, Instituto Nacional de Pesquisas Espaciais,
12227-010 São José dos Campos - SP, Brazil
Received: February 14, 2005; Revised: March 9, 2006
Electrochemical response of ferri/ferrocyanide redox couple is discussed for a system that uses reticulated vitreous carbon (RVC) three dimensional electrodes prepared at five different Heat Treatment Temperatures (HTT) in the range of 700 °C to 1100 °C. Electrical resistivity, scanning electron microscopy and X ray Diffraction analyses were performed for all prepared samples. It was observed that the HTT increasing promotes an electrical conductivity increasing while the Bragg distance d002 decreases. The correlation between reversibility behavior
of ferri/ferrocyanide redox couple and both surface morphology and chemical properties of the RVC electrodes demonstrated a strong dependence on the HTT used to prepare the RVC.
Keywords:reticulated vitreous carbon, pyrolysis, X ray diffraction, electrochemical properties
1. Introduction
Reticulated Vitreous Carbon (RVC) is an important material known by its high mechanical resistance, porosity, biocompatibility and relatively high electrical conductivity. These properties have been extensively explored in the last decades in many applications, for example, in thermal coating of airspace vehicles1,2, bony
pros-theses3, heart valves4-6, molecular sieves7 and hydrogenation catalyst
supports8.
Electrical conductivity variation is a determinant parameter for using RVC electrodes in many electrochemical applications. Polyaro-matic hydrocarbon crystals are intrinsic semi-conductors with resistiv-ity values between 102 and 1010Ω.cm. RVC characteristically shows a
decrease in its electrical resistivity as a function of the manufacturing temperature increase. This behavior is associated with a better ar-rangement of the carbon atoms in the basal planes, forming graphitic lamellar planes, which are stacked in the carbon structure. This graph-itic structure favors the transference of electrons among the hexagonal carbon rings in carbon material9. The extreme case of a polyaromatic
carbon material highly arranged is the graphite single crystals. The carbon plane sheets show two-dimensional metallic conduction with resistivity values smaller than 3.3 x 10⁻⁵Ω.cm within the sheet and a
negative temperature coefficient9. The gradual increase of conjugated
carbon in the sp2 state during the heat treatment of the raw material
in inert atmosphere (carbonization treatment) changes the precursor material progressively from an insulator to a good conductor in a remarkable decrease of 19 orders of magnitude in resistivity values. The electrical property is, therefore, sensitive to measure the various stages of the carbonization treatment and provide information about the final structure of carbon9. Yamaguchi10-12 made the first
measure-ments of electrical resistivity of vitreous carbon obtained from heat treatment temperatures between 800 °C and 3200 °C.
The electrical resistivity behavior of vitreous carbon derived from phenolic resin, at room temperature, assessed by potentiometric method, was described by Jenkins et al.9. The resistivity decreases
rapidly up to 900 °C. Afterwards, it decreases gradually reaching a constant value at 1500 °C, comparable to that of well-graphitized material with crystallite size greater than 1000 Å.
Additionally, the literature shows that the conductivity of solid carbons reaches a similar value in the same temperature range, be-tween 600 °C and 700 °C, when the carbon loses its acid proper-ties13-18. The properties of solid carbon surface are strictly related to
heteroatoms, which are removed during the heat-treatment, as water (up to 400 °C), CO2 (up to 700 °C), CO (up to 1200 °C), H2 and CH4 (above 950 °C), and also nitrogenated and sulfonated forms (above 1800 °C)13-15,19-23. Therefore, the acid functionality loss (initially by
CO2) approximately coincides with the trend of electrical conductivity to keep nearly constant for solid carbons. These factors are presum-ably related to the effects of electron delocalization, which favors electrical conduction that becomes higher after the acid group loss. Furfuryl alcohol resin is a polymer of national production and it usually presents low volatile losses during curing and carbonization processes. These characteristics induce to the more dense final carbon-ized foam (RVC) stems and, consequently, with higher mechanical properties (for example more resistant to flexion efforts) and lower electrical resistivity than those obtained from phenolic resins.
resin (dynamic viscosity of ~ 3.0 Pa s). Using p-toluenossulfonic acid as catalyst (3% w/w) the resin cure process was carried out. Furfuryl alcohol resin cure cycle was performed at 60 °C and this temperature was kept for 2 hours. Afterwards, the temperature was raised up to 80 °C for 2 hours. Then, the samples show suitable mechanical resist-ance to be manipulated and machined in different shapes.
To evaluate the influence of the maximum HTT on the RVC prop-erties the cured resin was carbonized up to five different maximum temperatures, between 700 °C and 1100 °C. The samples were heated at 1.0 °C min-1 under a nitrogen flow of 1 L.h-1, from room temperature
until the selected maximum temperature. This step took nearly 30 min-utes. The cooling occurred naturally up to room temperature.
The RVC superficial morphology analyses were performed by Scanning Electronic Microscopy (SEM) by using the equipment Zeiss DSM/950. Structural analyses were carried out by X ray Diffraction (XRD) in a diffractrometer Phillips, PW 1210/W/380/80.
Electrical resistivity measurements were carried out according to the four-probe method24. The samples were kept linked to a tension
measurer HP 34401A and a continuous current generator Tectrol TC-50-015. RVC samples were shaped into rectangular bars with the longest axis being the axis of the resistivity measurements. Silver paint was used for improving the electrical contacts. The compact volume electrical resistivity (ρ) was determined as a function of the inner probe separation.
FTIR (Fourier Transformed Infrared) spectra were performed by using a spectrophotometer SPECTRUM 2000 – Perkin Elmer, in the region of 4000 - 400 cm-1. The spectra were obtained by Photoacustic
Spectroscopy (PAS) technique.
Cyclic Voltammetry (CV) measurements were carried out by using a Microquimica potentiostat MQPG-01 in 1 mM of ferrocya-nide/0.1 M KCl, at scan rates of 5 to 500 mV.s-1. The experiments
were performed at room temperature in normal atmosphere. A simple three-electrode (WE – Working Electrode, CE – Counter Electrode of Pt mesh, RE – Reference Electrode of Ag/AgCl) and a single-compartment electrochemical cell were used in this study. The CE was positioned in front of the WE one. The RE was positioned close to the WE one, in the opposite side of the CE. The WE was prepared by machining RVC pieces in rectangular shape with dimensions of 14.3 mm x 12.6 mm x 7.02 mm, respectively. For all experiments, the
RE was Ag/AgCl. The solution was not stirred during the voltammetry experiments. The end of the electrodes was assembled over one brass base and the electrical contact was adapted by using silver based paste to improve the electrical contact. The electrodes were not submitted to superficial pre-treatment before the electrochemical measurements and their behaviors were registered in the first CV cycle.
3. Results and Discussion
3.1. Morphology and microstructure
Images obtained by SEM do not reveal large differences among the RVC structures manufactured at different HTT. However, the bubble formation is remarkable in the temperature range of 700 °C and 800 °C, as shown in Figure 1a,b. SEM images of the RVC sam-ples, with magnification of 20 times, (Figure 1c) allow estimating the pore diameters and its distribution considering pores per inch (ppi). This figure shows that the RVC is rich in transport pores with robust stemsthat guarantees its handling. Figure 1d depicts a small region of the vitreous carbon stem treated at 1100 °C. This typical image shows a smooth aspect of the vitreous carbon and no
bub-geometric surface area of electrode. Friedrich et al. measured the effective area of the pore stems by SEM and found a linear relation between the quantity of ppi and the specific surface area. By using this relation a specific area of 31.0 cm2 cm-3 was evaluated for the
50 ppi-RVC sample tested in this work.
Figure 2 presents the resistivity behavior as a function of HTT. This analysis is commonly presented in literature6, but it does not
involve the electrochemical response of the electrodes. In Figure 2 an abrupt decrease of the resistivity values is observed. This value is nearly ten times higher for the RVC sample treated at 700 °C than the one treated at 800 °C. Above this temperature (up to 1100 °C) the resistivity values show no significant variation. Usually, to ex-plain these results, the classical approach used for semiconductor conductivity is applied26. This consideration is associated with the
presence of energy gaps of two different origins, i.e., the intrinsic gap and one caused by impurities or lattice defects attributed to crystalline structure distortions. The later, as a chemical effect, decreases as the temperature increases and it is correlated to the fact that lower HTT does not offer sufficient energy for eliminating bonds C = C and functional groups C = O. The presence of these functionalities on the RVC surface (C = C and C = O) was deter-mined by FTIR analysis for the samples treated at 700 °C, as shown in Figure 3. This figure shows contributions of C = C and C = O at 1700 - 1500 cm-1. The presence of an intrinsic gap is explained by
graphite-like ribbon distortions. Additionally, the bubbles present in Figure 1a,b, which represent vacancies, can also promote the conductivity decrease.
X ray diffraction measurements have proved to be an important technique for RVC structural analysis. Considering the model pro-posed by Kawamura and Jenkins27 for vitreous carbon structure, the
main purpose of these measurements is to evaluate both the develop-ment of carbon layers28 and the character of their mutual ordering29.
It is known that the profiles of (hk) reflections correspond to the
model of flat rectangular anisotropic Coherently Scattering Domains (CSD). The heat treatment results in anisotropic growth of CSD29.
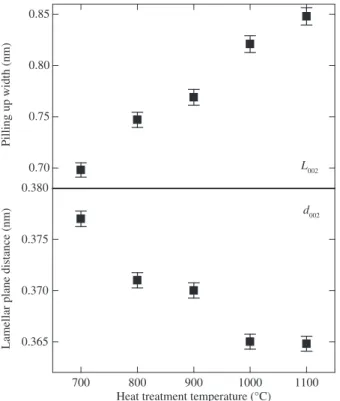
Figure 4 shows the determined values for both the distances between the lamellar planes (d002) and the plane stacking sizes (L002) evaluated from XRD spectra. The analysis of (002) reflections evidences a sharp reduction of interlayer distance from 0.377 nm to 0.364 nm between 700 °C and 1100 °C. These results may be explained from two im-portant contributions. The first involves the volatile release trapped in the material and the second the rearrangement of graphitic lamellar planes. The simultaneous occurrence of these two phenomena leads to a more organized carbon strucutre, as described in literature9. In
this same temperature interval L002 changes from 0.698 nm up to
0.848 nm, confirming the crystallinity increase as a function of the HTT. This is related to the repulsive interaction decrease between the clouds of π-electrons of adjacent graphitic layers, allowing these layers to come closer. In fact, the release of both oxygenated groups and olefin bonds provides a decrease in the electronic cloud density, responsible for the repulsion among layers. Besides, these groups and bonds represent a volumetric impediment which leads to the Bragg distance decreasing. This interpretation confirms the mechanism proposed by Fitzer et al.31,32.
3.2. Electrochemical behavior
Cyclic voltammetry analysis has been widely used to characterize different types and shapes of carbon electrodes9,13. A series of
(a) (c)
(b) (d)
Figure 1. SEM images of RVC samples heat treated at: a) 700 °C-3000 X; b) 800 °C-3000 X; c) 800 °C-20 X; and d) 1100 °C-5000 X.
600 700 800 900 1000 1100 1200
Resisti
vity (
7
.cm)
Heat treatment temperature (°C) 14
12
10
8
6
4
2
0
- 2
4000 3500 3000 2500 2000 1500 1000
1000 °C 700 °C
Photoacustic spectroscop
y relati
v
e intensity
Wave number (cm-1)
1.0
0.9
0.8
0.7
0.6
0.5
Figure 2. Resistivity behavior of RVC as function of the maximum temperature
used in its manufacture. Figure 3.
FT-IR spectra of RVC samples heat treated at 700 °C and 1000 °C.
The interval between 1700 and 1100 cm-1 suggest the presence of
study. Electrochemical response also permitted to evaluate the Spe-cific Electrochemical Surface Area (SESA) of the RVC electrodes. The results have shown a strong dependence between the HTT and the reversibility behavior, as expected. This method represents an additional technique for controlling the RVC electrode quality. To understand the next approach, the following notion was used: Ss for
the specific surface area (cm2 cm-3); I
p for the anodic peak current
in-tensity (A); Co for the oxidant concentration (equal to reductor); Vel for
the electrode volume immersed in solution (cm3); D
o for the oxidant
difusivity in solution (cm2 s-1, also considered equal to reductor), and
v for the sweeping rate in voltammetric experiments (V.s-1).
The voltametric studies show that the RVC electrodes may be analyzed by quasi-reversibility criteria: Ip increases with v1/2 but
does not keep the proportionality; ∆Ep is larger than 59/n mV and it
increases with v; and the cathodic peak potential, EPc, shifts to
nega-tive value when v increases. This analysis was associated with the
kinetic parameters ∆Ep and IPc as function of both HTT and sweeping
rate33. The treatment of systems called quasi-reversible is associated
with reactions that show electron transfer kinetic limitations where the reverse reaction must be considered. The results obtained in the performed experiments led to conclude that this consideration is the most suitable treatment for such RVC electrodes in the studied redox system, mainly due to the range of ∆EP obtained as a function
of the sweeping rates.
Figure 5 presents voltammetric curves for a RVC electrode treated at 800 °C in 1 mM of ferrocyanide/0.1 M KCl. For all electrodes, it was observed that the sweeping rate increase promotes an increase of the current peak intensity in cathodic and anodic reactions. The
The anodic peak current is also used to evaluate the specific electrochemical surface area, which is obtained by Equation 134:
(1)
where: SESA values are shown in Figure 6. These values are in good agreement with Friedrich et al.25, for samples heat treated
at temperatures of 1000 °C and 1100 °C, considering the area measurements of the foam stems. The apparent disagreement for lower HTT samples may be explained by two important contribu-tions. The lower HTT provides larger resistive effect as exposed in Figure 2, which is determinant for the electrode electrochemical response. Besides, the influence of the measured current may also contain an unknown contribution from surface modifications of the electrode34. FTIR analysis supports this argument by detecting
carbonyl groups and olefin bonds that represent modifications on carbon surface for samples heat treated at 700 °C. The micromet-ric bubbles observed by SEM are an additional factor which may represent important roughness effect. Consequently, the surface
700 800 900 1000 1100
0.365 0.370 0.375 0.380
Lamellar plane distance (nm)
Heat treatment temperature (°C) 0.70
0.75 0.80 0.85
L002
d002
Pilling up width (nm)
Figure 4. Lamellar planes d002 and pilling up width L002 obtained from XRD analysis.
600 700 800 900 1000 1100 1200
SESA (cm
2cm -3)
Heat treatment temperature (°C) 35
30
25
20
15
10
5
Figure 6. Specific electrochemical surface areas (SESA) for RVC electrodes
manufactured at different HTT (from 700 °C up to 1100 °C).
- 0.8 - 0.6 - 0.4 - 0.2 0.0 0.2 0.4 0.6 0.8 1.0
C
B
A
Current intensity (mA)
Potential (V x Ag/AgCl) 3.0
2.5 2.0 1.5
1.0 0.5 0.0
- 0.5 - 1.0 - 1.5 - 2.0
- 2.5 - 3.0
A B C
Figure 5. Cyclic voltammetric behavior of RVC electrode heat treated at
800 °C in 1 mM Ferrocyanide/0.1 M KCl. Each voltammogram is related to
area value evaluated through this process will not represent the real area of such electrode.
By using the quasi-reversibility criteria, ∆Ep shows a slightly
increase (for the samples heat treated at 800 - 1100 °C) with the sweeping rate increase and it is larger than 59/n mV (where n = 1 is the number of electrons involved in the reaction) (Figure 7), as-sisting an approach of quasi reversibility. Another important aspect
is related to the cathodic peak variation: the current increases with
v1/2, as shown in Figure 8. From this figure it is possible to observe
the irreversibility of the system assembled with RVC electrodes heat-treated at the maximum temperature of 700 °C. This is observed by considering that the peak current profile does not increase in function of v1/2 if compared with the pronounced increase observed
for the RVC electrodes treated at higher temperatures. The carbo-nyl groups and olefin bonds determined by FTIR analysis for the samples heat treated at 700 °C, associated to the bubble presence on the steam surfaces, justify this significant difference observed for the electrochemical behavior of such samples. Firstly, the bubbles provide an increase of the void volume that hinders the electron transport. Also, the presence of oxygenated groups such as carbonyl, carboxyl, lactones and quinones is related in literature35.
Presence of methilenical bonds decreases the conductivity because it constitutes an electronic barrier from sp3 hybridization. However,
it is known that the presence of acid groups in samples does not necessarily provide resistivity changes, but decreases the cathodic character of vitreous carbon. Figure 9 reveals that ∆Ep is larger only
for electrodes heat treated at 700 °C, indicating the inadequacy of this treatment for obtaining a good electrode. For HTT higher than 900 °C, ∆Ep is 0.2 V, nearly six times lower than that determined
for the sample treated at 700 °C. This electrochemical behavior is similar in the whole range of sweeping rate studied.
4. Conclusions
RVC electrodes obtained from different heat treatment tem-peratures were studied by correlating their morphology, structure, electrical resistivity and electrochemical response. X ray diffraction and resistivity measurements have demonstrated to be important tools for studding the RVC electrode properties. Besides, electrochemical study has shown to be adequate for detecting electroactive species and revealing a quasi-reversible behavior for such electrodes, except for samples heat treated at 700 °C. This sample, which presents car-bonyl groups, showed by cyclic voltammetry the lowest anodic and cathodic current peaks and the largest ∆Ep, mainly correlated to its
higher resistivity. This effect provides voltammograms without peaks and with the highest inclination, revealing worthless faradic current peaks. Finally, the evaluation of the specific electrochemical area is strongly affected by the electrode resistivity. For the samples manufac-tured by using HTT values higher than 800 °C, with lower resistivity values, a SESA was found in good agreement with the values shown by Friedrich et al.25. The resistive component of voltammograms
in the temperature range of 700-800 °C is more intense for carbon treated at lower HTT, influencing the electrochemical responses.This behavior is probably related to the presence of methilenical bonds and oxygenated groups from furfuryl alcohol resin used as raw material in the RVC processing.
Acknowledgments
The authors would like to thank A. O. Santos for SEM images, A. V. Diniz from LAS/INPE for X ray diffraction measurements and FAPESP (Process number: 05/50718-9) and CNPq (Process number: 303528/2003-6). We are specially grateful to E. C. Botelho for improving the technical discussion of this work.
0 50 100 150 200
0 1
$
Ep
(V)
v (mV.s-1)
700 °C
1000 °C 800 °C
1100 °C 900 °C
Figure 7.∆Ep as a function of sweep rate in 1 mM Ferrocyanide/0.1 M KCl
for RVC electrodes manufactured at different HTT (from 700 °C up to 1100 °C).
0 5 10 15
Cathodic peak current intensity (mA)
v1/2 (mV.s-1)1/2 2.0
1.6
1.2
0.8
0.4
0.0
700 °C 800 °C 900 °C 1000 °C 1100 °C
Figure 8. Cathodic peak current as a function of (sweep rate)1/2 in 1 mM Ferrocyanide/0.1 M KCl for RVC electrodes manufactured at different HTT (from 700 °C up to 1100 °C).
600 700 800 900 1000 1100 1200
$
Ep
(V)
Heat treatment temperature (°C) 1.2
1.0
0.8
0.6
0.4
0.2
0.0
50 mV.s-1
Figure 9.∆Ep as a function of HTT used in the RVC electrode manufacture,
1969; Boston: USA. Boston: American Carbon Society; 1969. p. 7. 2. Bunnell LR. Proc. Vitreous carbon matrix carbon-carbon composite by
copyrolysis. In: Proceedings of 12th Biennial Conference on Carbon;
Pennsylvania; 1975; USA. Pennsilvania: American Carbon Society; 1975. p. 333-334
3. Kaplan RB. Open cell tantalum structures for cancellous bone implants
and cell and tissue receptors. US Patent 5282861; 1994.
4. Rezende MC. Produção de Carbono Vítreo, em Escala de Laboratório,
a partir de Resinas Furfurílica e Fenólica. São Paulo: Brazil. [Doctoral Thesis]. São Paulo, EPUSP; 1991.
5. Bokros JC. Carbon biomedical devices. Carbon. 1977; 15(6):353.
6. Jenkins GM, Grigson CJ. The fabrication of artifacts out of glassy carbon
and arbon-fiber-reinforced carbon for biomedical applications. J. Biomed.
Mater. Res. 1979; 13:371-394.
7. Schmitt Jr JL, Walker PL. Carbon molecular sieve supports for metal catalysts-II. Selective hydrogenation of hydrocarbons over platinum
supported on polyfurfuryl alcohol. Carbon. 1972; 10(1):87-92.
8. Cooper BJ, Trimm DL. Selectivity of carbon molecular sieve supported
catalysts. In: Preprint 3rd Conference on Industrial Carbon and Graphite;
1970; London: UK. London: Soc. Chem. Ind.; 1970. p. 49.
9. Jenkins GM, Kawamura K. Polymeric carbons – carbon fibre, glass and
char. Cambridge: Cambridge University Press; 1976. p. 83-108
10. Yamaguchi T. Galvanomagnetic properties of glassy carbon. Carbon.
1964; 1(1):47-50.
11. Yamaguchi T. Thermoelectric power of glassy carbon at high temperature. Carbon. 1964; 1(4):535-536.
12. Yamaguchi T. Electronic Properties of Carbonized Polyacrylonitrile
Fibers. Carbon. 1964; 2(1):95-96.
13. Leon y Leon CA, Radovic LR. Interfacial Chemistry and Electrochemistry
of Carbon Surfaces. In: Thrower PA, editor. Chemistry and physics of
carbon; New York: USA. New York: Dekker. 1994; 24:213-310.
14. Rivin D. Surface Properties of Carbon. Rubber Chem. Technol. 1971;
44:307-343.
15. Rivin D. Carbon Black Iodination. Extended Abstract, in Proc. 5th Conf.
on Carbon; 1963; New York: USA. New York: Pergamon Press; 1963. v. 2. p. 199.
16. Papirer E, Li S, Donnet JB. Contribution to the study of basic surface
groups on carbons. Carbon. 1987; 25(2):243-247.
17. Papirer E, Dentzer J, Li S, Donnet JB. Surface groups on nitric acid oxi-dized carbon black samples determined by chemical and thermodesorption
analyses. Carbon. 1991; 29(1):69-72.
New York: Wiley, p. 1-17, 86-91, 1988.
20. Morimoto T, Miura K. Adsorption sites for water on graphite. 1. Effect of
high-temperature treatment of sample. Langmuir. 1985; 1(6):658-662.
21. Morimoto T, Miura K. Adsorption sites for water on graphite. 2. Effect
of autoclave treatment of sample. Langmuir. 1986; 2(1):43-46.
22. Miura K, Morimoto T. Adsorption sites for water on graphite. 3. Effect
of oxidation treatment of sample. Langmuir. 1986; 2(6):824-828.
23. Miura K, Morimoto T. Adsorption sites for water on graphite. 4.
Chemi-sorption of water on graphite at room temperature. Langmuir. 1988;
4(6):1283-1288.
24. Shui X, Frysz CA, Chung DDL. Solvent cleansing of the surface of carbon
filaments and its benefit to the electrochemical behavior. Carbon. 1995;
33(12):1681-1698.
25. Friedrich JM, Ponce-de-León C, Reade GW, Walsh FC. Reticulated
vitreous carbon as an electrode material. Journal of Electroanalytical
Chemistry. 2004; 561(1):203-217.
26. Pesin LA. Review – Structure and properties of vitreous carbon. J. Matter.
Sci. 2002; 37:1-28.
27. Kawamura K, Jenkins GM. Structure of Glassy Carbon. Nature. 1971;
231:175-176.
28. Fischbach DB. The Kinetics and Mechanism of Graphitization. In: Walker,
Jr PL, editor. Chemistry and physics of carbon; New York: USA. New
York: Dekker. 1971; 7:1-105.
29. Rousseaux F, Tchoubar D. Structural evolution of a glassy carbon as a result of thermal treatment between 1000 and 2700 °C – I. Evolution of
the Layers. Carbon. 1977; 15(2):55-61.
30. Hagio T, Nakamizo M, Kobayashi K. Studies on X-ray diffraction and
Raman spectra of B-doped natural graphite. Carbon. 1989;
27(2):259-263.
31. Fitzer E, Schafer W, Yamada S. The formation of glasslike carbon by
pyrolysis of polyfurfuryl alcohol and phenolic resin. Carbon. 1969;
7(6):643-646.
32. Fitzer E, Schafer W. The effect of crosslinking on the formation of
glass-like carbons from thermosetting resins. Carbon. 1970; 8(3):353-364.
33. Greef R, Peat R, Peter LM, Pletcher D, Robinson J. Instrumental Methods
in Electrochemistry, New York: Wiley; 1985. p. 178-227.
34. Trassatti S, Petrii OA. Real Surface Area Measurements in
Electrochem-istry. Pure & Appl. Chem. 1991; 5(5):711-734.
35. Fabish TJ, Schleifer DE. Surface chemistry and the carbon black work