*e-mail: [email protected]
Nanomechanical Properties of Rough Surfaces
Gelson Biscaia de Souzaa*, Carlos Eugênio Foersterb, Silvio Luiz Rutz da Silvab, Carlos Maurício Lepienskic
a
Universidade Estadual de Maringá, Campus Regional de Goioerê, Departamento de Ciências,
Av. Reitor Zeferino Vaz, s/n, 87360-000 Goioerê - PR, Brazil
b
Universidade Estadual de Ponta Grossa, Departamento de Física,
Av. Carlos Cavalcanti, s/n, 84030-900 Ponta Grossa - PR, Brazil
c
Universidade Federal do Paraná, Departamento de Física,
C. P. 19044, 81531-990 Curitiba - PR, Brazil
Received: May 1, 2005; Revised: October 3, 2005
The nanoindentation technique allows the determination of mechanical properties at nanometric scale. Hardness (H) and elastic modulus (E) profiles are usually determined by using the Oliver-Pharr method from the load/unload curves. This approach is valid only for flat surfaces, or at least, when a very low degree of asperity is present (lower than 30 nm). The basic statement is the determination of the zero tip-surface contact point. If a rough surface is present, errors can occur in determining this contact point and, as a consequence, the surface hardness and elastic modulus profiles are drastically altered resulting in under evaluated values. Surfaces with different roughness were produced by controlled nitrogen glow discharge process on titanium. The changed nitriding parameters were different N2/H2 atmospheres and temperatures (600 °C-900 °C). The most correct H
and E profiles were obtained by using the contact stiffness analysis method, proposed here, that overcomes the surface roughness. The obtained results were compared with available literature data.
Keywords:nanoindentation, roughness, nitriding, titanium
1. Introduction
The nanoindentation technique allows the determination of the surface mechanical properties in nanometric scale. Hardness and elastic modulus can be calculated by using the method proposed by Oliver and Pharr1-2. This method relates applied load, tip
displace-ment and time, and all of them are measured by sensors while a diamond-tip penetrate the material surface (depth sensing method or instrumented indentation). For thin films or modified layers at near surface, it is possible by nanoidentation technique to investigate hard-ness (H) and elastic modulus (E) profiles at very shallow depths (on the order of nm) up to deeper regions (on the order of µm)3. In the
Oliver-Pharr method, the surfaces must be as flat as possible because the method is strongly dependent of the contact stiffness between the tip and the sample surface to start the data acquisition onset to build the loading/unloading curves.
It is well known that surface modifying processes such as nitrogen glow discharge and nitrogen plasma immersion ion implantation (PIII) can produce high surface roughness due to sputtering effects that depend on the surface nature, ion energy and working temperature4.
However, almost of all surface hardness profiles reported in the litera-ture were measured trough the microhardness tests, when the surface roughness degree is less important to obtain these profiles.
Odo and Lepienski5 reported a study about hardness and elastic
modulus surface profiles, using nanoindentation technique, in dif-ferent rough surfaces (soda-lime glass, Al and nitrided Ti). The authors recalculated from the experimental loading curve a new loading/unloading curve that does not take into consideration the ef-fect of the surface roughness. In this method the load vs. depth plot is fitted by a power law function to know the zero surface contact point. The hardness is than calculated from the first derivatives of the loading/unloading curve.
In the present work we propose another method to minimize the surface roughness effect on the loading/unloading curves ob-tained from the instrumented indentation. The method is based on the analysis of the contact stiffness between the tip and the sample surface, taking into account the mean surface roughness and the most actual elastoplastic deformation. After that, the well-known Oliver and Pharr method1 is then applied. The analyzed rough surfaces
were titanium ion nitrided in different conditions of atmosphere and temperature. The hardness and elastic modulus profiles obtained by the present proposed method are also compared to the Odo-Lepi-enski method5 in addition to Vickers measurements. Major details
about mechanical properties of ion-nitrided titanium can be found in de Souza et al.6
2. Materials and Methods
Commercial pure titanium samples were cut from a 2.0 cm di-ameter ingot in thickness of 0.3 cm. In order to obtain flat and less surface stresses, the samples were electrochemically polished in an HClO4 solution and then cleaned in (CH3)2CO and CCl4 solutions.
modified region of up to 4 µm in thickness is obtained. The nitriding parameters are shown in Table 1.
Hardness and elastic modulus profiles were determined by a MTS Systems "Nano Indenter XPTM” device. The applied loads changed
from 12.5 mN to 400 mN. In order to have a representative ensem-ble, 40 indentations per sample separated 50 µm to each other were performed. The diamond tip was a Berkovich type. In order to reach deeper regions (substrate), Vickers microhardness measurements were performed in a Carl Zeiss MHP-160 device, with loads ranging from 500 mN to 1600 mN. Surface roughness profiles were obtained by a Veeco/Sloan "Dektak3" profile meter.
3. Results and Discussion
Depending on the nitriding conditions, different titanium nitrides and titanium oxides can be formed (δ-TiN, ε-Ti2N, TiO and TiO2) in addition to a nitrogen solid solution region10,11 in the Ti matrix. X ray
diffraction analysis, shown in the reference 6, confirms the presence of all of these phases as a function of the working conditions.
All of these phases have hardness higher than titanium substrate4,7-10,12. Consequently, it is expected that the hardness profiles
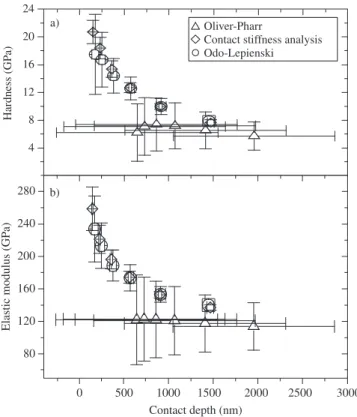
decrease with depth until reaching the substrate value. However, this typical hardness behavior was not obtained, as can be observed in Fig-ure 1a (triangles symbols), which relates hardness with contact depth for the sample nitrided at 60%N2 / 40%H2 atmosphere and 800 °C, as calculated by the Oliver-Pharr method. These kinds of hardness profiles were obtained in all of the different nitriding atmospheres and high temperatures worked. Along with a big error bar in the hardness, it is also observed an enormous error in the respective tip depth. The average contact depth starts at ≈ 700 nm with hardness similar to Ti bulk hardness6 (≈ 4 GPa), it reaches around 7 GPa at ≈ 900 nm in depth and then decreases to ≈ 5 GPa at 2000 nm. Similar curve behavior was verified for the elastic modulus profiles, as can also be seen in Figure 1b for the same sample (triangles symbols). The surface elastic modulus is approximately constant until deeper regions, not making evident the existence of a nitrided layer. For
Table 1. Nitriding parameters and surface average roughness (Ra). All titanium samples were plasma nitrided during 3 hours.
Sample Temperature (°C)
Atmosphere Ra (nm)
As received - - 19.0 ± 8.6
1 600 100%N2 21.0 ± 5.4
2 600 80%N2 / 20%H2 18.4 ± 4.3 3 600 60%N2 / 40%H2 23.0 ± 6.1 4 600 20%N2 / 80%H2 22.0 ± 5.2
5 700 100%N2 33.3 ± 7.8
6 700 80%N2 / 20%H2 15.2 ± 4.2 7 700 60%N2 / 40%H2 68.9 ± 9.5 8 700 20%N2 / 80%H2 90.9 ± 32.5
9 800 100%N2 206.3 ± 30.3
10 800 80%N2 / 20%H2 77.3 ± 8.7 11 800 60%N2 / 40%H2 42.4 ± 15.4 12 800 20%N2 / 80%H2 68.4 ± 17.0
13 900 100%N2 48.3 ± 10.7
14 900 80%N2 / 20%H2 188.8 ± 67.8 15 900 60%N2 / 40%H2 235.7 ± 62.6 16 900 20%N2 / 80%H2 200.8 ± 53.9
- 800 - 400
0
400 800
900 °C
700 °C
Distance (nm)
Prof
ile (nm)
0 10000 20000 30000 40000 50000 - 800
- 400
0
400 800 - 800 - 400
0
400 800
800 °C
Figure 2. Surface profiles for the titanium samples nitrided at 80%N2 / 20%H2 atmosphere and different temperatures.
nitrided titanium, surfaces are expected to be stiffer than substrate, that is, with greater elastic modulus values.
In Figure 2 it is shown typical surface roughness profiles at differ-ent working temperatures for the samples nitrided at 80%N2 / 20%H2 atmosphere. This figure summarizes the roughness patterns for all working conditions. The mean roughness Ra was determined by us-ing the expression4,13
Figure 1. a) Hardness and b) elastic modulus vs. contact depth for titanium nitrided at 60%N2 / 40%H2 atmosphere and 800 °C: () not corrected (as obtained for the nanoindenter algorithm), () according to the contact stiff-ness analysis correction and () the Odo-Lepienski method.
0 500 1000 1500 2000 2500 3000 Contact depth (nm)
280
240
200
160
120
80
Elastic modulus (GP
a)
Oliver-Pharr
Contact stiffness analysis Odo-Lepienski 24
20
16
12
8
4
Hardness (GP
a)
a)
where P is the applied load. Consequently if roughness is present, H
will be lower than the most actual one. This effect is very significant for small applied loads and for the cases when the mean roughness
Ra is in the range of the tip penetration depth (similar to tip diameter, Figure 3c and 3d). The elastic modulus determination by means of the Oliver-Pharr method also depends strongly on the hmax value as can be observed in reference 1.
As cited above, in the present work we do not have interest to corre-late surface roughness patterns to the plasma working parameters. The “Nano Indenter XPTM” device allows obtain the tip to surface stiffness
response during the tip penetration. This mechanical parameter can be associated to the surface roughness degree. For a flat surface the contact stiffness increases very quickly, exceeding drastically the device stiff-ness (around 100 N/m) meaning then an effective tip penetration in the surface. However, if roughness is present some fluctuations around the initial stiffness take place, even during the tip displacement. This typical contact stiffness fluctuation behavior, that not increases quickly, reveals the difficulty of the system in determine the most actual zero surface contact point, shifting the contact tip depth.
The relation between applied load (P) and tip displacement (h) can be written as1
P = αhm (4)
where α and m are constants, with m approximately equal to 2 for a Berkovich tip at a plastic regime and low loads1.
This expression can be rewritten as
log P = log α + m log h (5)
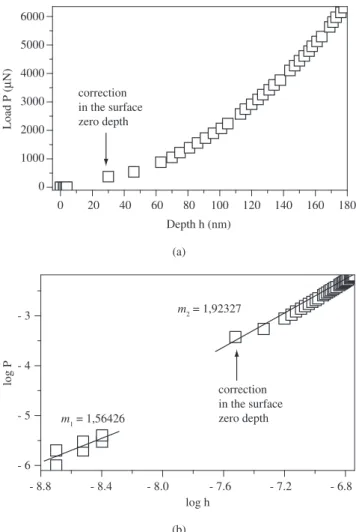
Figure 4 shows part of a loading curve, at very low load, for a typical situation that can be found for a rough surface. Figure 4a shows the as obtained curve (P = αhm) and Figure 4b the corresponding curve
in logarithmic form (Equation 5). Two distinct fits for the m parameter are possible in the curve, one in the range from – 8.8 to – 8.3 (m1), and another beyond – 7.6 (m2). Due to the fact that the Oliver and Pharr method is based on an m value in the order of 2, the second branch (m2) of the log h data determine the new zero surface contact point as indicated in Figure 4b. The new corresponding tip depth will be then used to correct the surface zero point at the contact stiffness curve and so, hardness and elastic modulus will be recalculated by the Oliver and Pharr method.
This cutoff depth specifies now the new zero surface contact point and it is in some way correlated to the calculated Ra value of the sur-face for all treated samples. This depth in the contact stiffness curve is ever easily identified by the quick increase on its value. Beyond this depth the curve shows a normal behavior as for a flat surface.
In Figure 1 it is also shown the hardness and elastic modulus curves recalculated after correction based on contact stiffness (loz-enges symbols). The error bar are now reduced mainly in its depths spreads, showing most expected values at near surface region in agreement with literature data4,7-10,12.
In order to verify if the corrected values, obtained by the present analysis process, were not influenced by artifacts that can be intro-duced by this correction, it was also performed another correction recently introduced and based in the adjustment of the loading curve by using a power law function fitting (Odo-Lepienski method5). In
this method, loading curves are fitted by a power law function:
P = C(h – ho)m (6)
where P is the applied load and h denotes contact depth. The constants
C, h0 and m are obtained by fitting the loading curve using the least squares method, where it is not necessary to know the zero surface contact point. Hardness and elastic modulus are calculated using the first derivative of the loading and unloading vs. depth curves. The
indenter indenter
surface
P P
P
P
surface
a) b)
c) d)
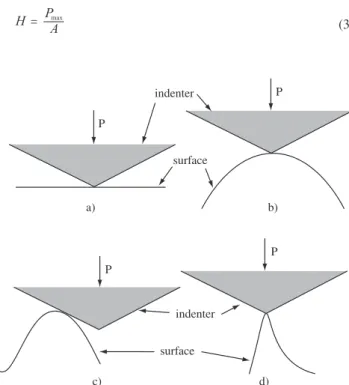
Figure 3. Different tip-surface approach. a) No asperities present (flat sur-face); b) asperities larger than tip diameter; c) tip sliding at the asperity; and d) asperity curvature diameter in the same order than tip diameter.
(1)
where L is the profile meter track length, N the number of data point, and yi are the vertical deviations from a central line, which divides the profile so that the upper area is equal to the inferior one.
There are complicated relations between surface roughness pat-terns and working conditions (atmosphere composition and tempera-ture), which are not our aim in this present study. As can be observed in Table 1, in average the surface roughness increases as a function of the working temperature. It was observed that the pure nitrogen atmosphere shows an irregular pattern for the surface roughness in comparing to the other atmospheres.
To understand different tip-surface approximation conditions, during a surface indentation, four different situations are shown in Figure 3: in the case a) a flat surface is indented, where no asperities are present or also for asperities for which Ra is much lower than the tip diameter (present situation Ra << 100 nm); in b) the tip reaches asperities with a diameter that is much greater than the tip curvature diameter14,15 - similar condition of reaching a great diameter valley;
in the case c) the tip can slide through the asperity and the penetra-tion onset is not determined correctly by the nanoindenter system; and in the case d) when the tip diameter is greater than the asperity diameter, and the first materials deformation may be plastic and not elastic. The last case can generates a nucleation of homogeneous dislocations under the contact point (high pressure), meaning a plastic deformation at the firsts indentation stages15. In the both last cases,
the incorrect determination of the zero contact point increases the maximum tip penetration depth value (hmax) at the applied load, and consequently increasing the projected contact area (A) value for the ideal Berkovich tip, that is calculated by1
A = 24,5hc2 (2)
In this equation, hc is the contact depth and it is related to hmax by
hc = hmax – hs, where hs corresponds to the surface displacement in the contact perimeter (elastic deformation).
Hardness is calculated by the expression1,16
Odo-Lepienski method is shown in Figures 1a and 1b, too (circles symbols). A very good agreement between this method and our method is observed.
To reinforce the recalculated hardness profiles by nanoindenta-tion, Vickers microhardness measurements were also performed in all samples. Figure 5 shows simultaneously a typical combined hard-ness profiles trough samples nitrided at 20%N2 / 80%H2 atmosphere at 700°C, at 800°C and at 900°C. It is observed that the values of hardness fit very well in the hardness profile from near surface to deeper regions.
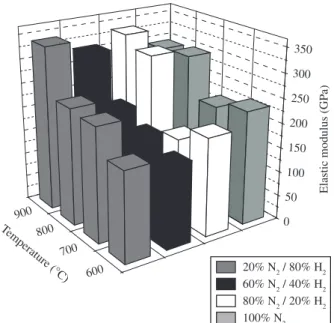
Figure 6 shows hardness, at 250 nm in depth, for all nitriding conditions summarized in Table 1. This depth was chosen because different samples temperatures and gas atmospheres produce very different nitrided depth that can change from the near surface until deeper regions (µm). From this plot it is possible to observe that the best near surface hardness improvements, from ≈ 4 GPa for bulk Ti to ≈ 23 GPa, are obtained at 900°C independent of the plasma at-mosphere. Higher elastic modulus values were also obtained for the treatment at 900 °C, ranging from ≈ 136 GPa for bulk to ≈ 300 GPa at 250 nm in depth, as shown in Figure 7.
4. Conclusions
In order to obtain hardness and elastic modulus profiles in rough surfaces, it is proposed in the present work a method based on the
0 20 40 60 80 100 120 140 160 180 correction
in the surface zero depth
Depth h (nm)
Load P (
M
N)
6000
5000
4000
3000
2000
1000
0
(a)
- 8.8 - 8.4 - 8.0 - 7.6 - 7.2 - 6.8 correction
in the surface zero depth m
1 = 1,56426
m
2 = 1,92327
log P
log h - 3
- 4
- 5
- 6
(b)
Figure 4. a) Initial portion of the loading curve; and b) the same curve linearized, for a nanoindentation test of the sample treated at 60%N2 / 40%H2 atmosphere
and 600 °C. The arrows indicate the same experimental point in both plots.
0 800 1600 2400 3200 4000 4800 5600 0
4 8 12 16 20 24 28 32 36
700 °C 800 °C 900 °C
Hardness (GP
a)
Contact depth (nm)
Vickers microhardness Berkovich nanohardness
Figure 5. Hardness vs. contact depth for titanium samples nitrided at 700°C, 800°C and 900 °C and 20%N2 / 80%H2 atmosphere, corrected by the contact
stiffness analysis (). Vickers microhardness values are also shown (). The lines are a guide for the eyes.
600 700 800 900
Temperature (°C)
25
20
15
10
5
0
20% N2 / 80% H2 60% N2 / 40% H2 80% N2 / 20% H2 100% N2
Hardness (GP
a)
Figure 6. Hardness as a function of temperature and gaseous mixture, obtained at 250 nm in depth, for all titanium working conditions.
600 700 800 900
Temperature (°C)
20% N2 / 80% H2 60% N2 / 40% H2 80% N2 / 20% H2 100% N2
350
300
250
200
150
100
50
0
Elastic modulus (GP
a)
Figure 7. Elastic modulus as a function of temperature and gaseous mixture, obtained at 250 nm in depth, for all titanium working conditions.
to higher values, reaching in some working conditions 23 GPa. In the same way elastic modulus changed from 136 GPa to 300 GPa. These corrected values are in agreement with the literature data.
Consequently, if roughness is present in the surface and it is quantified, we propose that this type of contact stiffness analysis can be used for correct to the most actual zero surface contact point, and then obtain the most correct hardness and elastic modulus on rough surfaces.
Acknowledgments
Dr. Carlos Alberto dos Santos (IF/UFRGS - Porto Alegre, Brazil), Dr. Ivo A. Hümmelgen (DEFIS/UFPR - Curitiba, Brazil) and Erasto Gaertner Hospital Bioengineering Institute (Curitiba, Brazil).
References
1. Oliver WC, Pharr GM. An improved technique for determining hardness and elastic modulus using load and displacement sensing indentation experiments. Journal of Materials Research. 1992; 7(6):1564-1583. 2. Brotzen FR. Mechanical testing of thin films. International Materials
Reviews. 1994; 39(1):24-45.
3. Tsui TY, Pharr GM. Substrate effects on nanoindentation mechanical property measurement of soft films on hard substrates. Journal of Materi-als Research. 1999; 14(1):292-301.
4. Bhushan B, Gupta BK. Handbook of tribology: materials, coatings and surface treatments. New York: McGraw-Hill; 1991.
5. Odo GY. Fundamentos de nanoindentação e aplicações em vidros com superfícies modificadas por migrações iônicas. [Unpublished PhD thesis]. Curitiba, Brazil: Universidade Federal do Paraná; 2001.
6. Souza GB, Foerster CE, Silva SLR, Serbena FC, Lepienski CM, Santos CA. Hardness and elastic modulus of ion-nitrided titanium obtained by nanoindentation. Surface & Coatings Technology. 2005; 191:76-82.
7. Fu Y, Loh NL, Wei J, Yan B, Hing P. Friction and wear behaviour of carbon nitride films deposited on plasma nitrided Ti-6Al-4V. Wear. 2000; 237:12-19.
8. Metin ES, Inal OT. Microstructural and microhardness evaluations in ion nitrided titanium. Materials Science and Engineering. 1991; A145:65-77. 9. Raveh A, Avni R, Grill A. R.F. plasma nitriding of Ti-6Al-4V alloy. Thin
Solid Films. 1990; 186:241-256.
10. Bell T, Bergmann HW, Lanagan J, Morton PH, Staines AM. Surface en-gineering of titanium with nitrogen. Surface Engineering. 1986; 2(2). 11. Brading HJ, Morton PH, Bell T, Earwaker LG. Plasma nitriding with
nitrogen, hydrogen, and argon gas mixtures: structure and composition of coatings on titanium. Surface Engineering. 1992; 8(3):206-212.
12. Sundgren JE. Structure and properties of TiN coatings. Thin Solid Films. 1985; 128:21-44.
13. Song JF, Vorburger TV. Surface texture. In: ASM International Handbook Committee. ASM Handbook. USA: ASM. 1992; 18:334-345.
14. Bobji MS, Biswas SK. Estimation of hardness by nanoindentation of rough surfaces. Journal of Materials Research. 1998; 13(11):3227-3233.
15. Gouldstone A, Van Vliet KJ, Suresh S. Simulation of defect nucleation in a crystal. Nature. 2001 Jun 7; 411(6838):656.