RESEARCH ARTICLE
Deregulated Expression of SRC, LYN and CKB
Kinases by DNA Methylation and Its
Potential Role in Gastric Cancer Invasiveness
and Metastasis
Adriano Azevedo Mello1☯, Mariana Ferreira Leal2,3☯*, Juan Antonio Rey4, Giovanny
Rebouças Pinto5, Leticia Martins Lamarão6,7, Raquel Carvalho Montenegro7, Ana Paula Negreiros Nunes Alves8, Paulo Pimentel Assumpção9, Barbara do Nascimento Borges7,10,
Marília Cardoso Smith2, Rommel Rodriguez Burbano7,9
1Centro de Ciências Biológicas e da Saúde, Universidade Federal de Campina Grande, Campina Grande, PB, Brazil,2Disciplina de Genética, Departamento de Morfologia e Genética, Universidade Federal de São Paulo, São Paulo, SP, Brazil,3Departamento de Ortopedia e Traumatologia, Universidade Federal de São Paulo, São Paulo, SP, Brazil,4Laboratorio de Oncogenética Molecular, Hospital Universitario La Paz, Madrid, Madrid, Spain,5Departmento de Biomedicina, Universidade Federal do Piauí, Parnaíba, PI, Brazil,
6Laboratório de Testes de Ácidos Nucleicos, Fundação Centro de Hemoterapia e Hematologia do Pará, Belém, PA, Brazil,7Instituto de Ciências Biológicas, Universidade Federal do Pará, Belém, PA, Brazil,
8Departamento de Patologia Oral, Faculdade de Odontologia, Universidade Federal do Ceará, Fortaleza, CE, Brasil,9Núcleo de Pesquisa em Oncologia, Hospital Universitário João de Barros Barreto,
Universidade Federal do Pará, Belém, PA, Brazil,10 Centro de Tecnologia Agropecuária, Instituto Socioambiental e dos Recursos Hídricos, Universidade Federal Rural da Amazônia, Belém, PA, Brazil
☯These authors contributed equally to this work.
*mariana.morf@epm.br
Abstract
Kinases are downstream modulators and effectors of several cellular signaling cascades and play key roles in the development of neoplastic disease. In this study, we aimed to eval-uate SRC, LYN and CKB protein and mRNA expression, as well as their promoter methyla-tion, in gastric cancer. We found elevated expression of SRC and LYN kinase mRNA and protein but decreased levels of CKB kinase, alterations that may have a role in the invasive-ness and metastasis of gastric tumors. Expression of the three studied kinases was also associated with MYC oncogene expression, a possible biomarker for gastric cancer. To understand the mechanisms that regulate the expression of these genes, we evaluated the DNA promoter methylation of the three kinases. We found that reducedSRCandLYN meth-ylation and increasedCKBmethylation was associated with gastric cancer. The reduced SRCandLYNmethylation was associated with increased levels of mRNA and protein expression, suggesting that DNA methylation is involved in regulating the expression of these kinases. Conversely, reducedCKBmethylation was observed in samples with reduced mRNA and protein expression, suggesting CKB expression was found to be only partly regulated by DNA methylation. Additionally, we found that alterations in the DNA methylation pattern of the three studied kinases were also associated with the gastric can-cer onset, advanced gastric cancan-cer, deeper tumor invasion and the presence of metastasis.
PLOS ONE | DOI:10.1371/journal.pone.0140492 October 13, 2015 1 / 23
OPEN ACCESS
Citation:Mello AA, Leal MF, Rey JA, Pinto GR, Lamarão LM, Montenegro RC, et al. (2015) Deregulated Expression of SRC, LYN and CKB Kinases by DNA Methylation and Its Potential Role in Gastric Cancer Invasiveness and Metastasis. PLoS ONE 10(10): e0140492. doi:10.1371/journal. pone.0140492
Editor:Jose G. Trevino, University of Florida, UNITED STATES
Received:May 27, 2015
Accepted:September 25, 2015
Published:October 13, 2015
Copyright:© 2015 Mello et al. This is an open access article distributed under the terms of the
Creative Commons Attribution License, which permits
unrestricted use, distribution, and reproduction in any medium, provided the original author and source are credited.
Data Availability Statement:All relevant data are within the paper and its Supporting Information files.
Therefore, SRC, LYN and CKB expression or DNA methylation could be useful markers for predicting tumor progression and targeting in anti-cancer strategies.
Introduction
Gastric cancer (GC) is the fourth most frequent cancer type and the second highest cause of cancer mortality worldwide [1]. Treatment of GC at advanced stages remains difficult, and the prognosis is still poor, partly as a result of local recurrence, tumor invasion and/or metastasis. The overall relative 5-year survival rate is currently less than 20% [2]. A better understanding of the biology of the progression of this neoplasia is crucial to reducing the mortality rate with the development of novel patient management and therapeutic strategies.
Phosphotransferases, also known as kinases, are downstream modulators and effectors of several cellular signaling cascades and play key roles in the development of neoplastic disease [3]. To date, several protein kinase-interacting drugs have been registered for clinical trials [4]. We previously performed screening to identify kinase proteins expressed in GC using Capture Compound Mass Spectrometry [5,6] (S1 File), and 22 kinase proteins, including SRC, LYN and CKB, were detected (S1 Table). These three kinases were selected for further investigations
(S1 Fig).
SRC was the first proto-oncogene discovered, and it plays a central role in cellular signal transduction pathways. Aberrant SRC activity is observed in several human cancers, including GC [7–9], and it may be important during tumor development and progression [10,11]. The mitogenic function of SRC is, at least in part, mediated by the induction of MYC, a cell cycle regulator and transcription factor [12,13]. Our group previously described MYC upregulation in human GC and in N-methyl-nitrosourea-treated non-human primates [14–19]. Because the activation of SRC, as well as that of other kinases, has pleiotropic effects that depend on the cell type and context [20], it is still important to understand the possible relationship between kinases and MYC expression in gastric carcinogenesis and the molecular mechanism involved in their regulation.
LYN is another member of the SRC family of kinases, and theLYNgene is located at chro-mosome 8q13. Our group previously reported the presence of gains of chrochro-mosome 8 (on which theMYCgene is also located) in GC cases from Northern Brazil [16,21–23] and in all GC cell lines established from neoplasias in this population [24,25]. Therefore, this chromo-some may contain important genes involved in gastric carcinogenesis. To our knowledge, no previous study has investigated the role of LYN and its regulation in GC. However, LYN over-expression has been reported in several cancers [26–32]. In addition, the regulation ofLYNby DNA methylation was demonstrated in both colorectal cancer and Ewing’s sarcoma [33,34], andLYNmethylation has been observed in some hematopoietic and non-hematopoietic cell lines [35]. DNA methylation is a molecular modification of DNA that is tightly associated with gene function and cell type-specific gene function [36]. Moreover, DNA methylation may be a robust biomarker, as it is vastly more stable than RNA or protein and is therefore a promising target for the development of new approaches for the diagnosis and prognosis of cancers [36].
CKB is one of two cytosolic isoforms of creatine kinase and may participate in metabolic processes involving glycolysis in non-muscle cells [37]. In contrast to normal cells, which pri-marily generate energy via oxidative phosphorylation, most cancer cells prefer aerobic glycoly-sis, which is known as the Warburg effect [38]. Interestingly, the MYC oncogene appears to activate several glucose transporters and glycolytic enzymes, thereby contributing to the
Kinases Expression and Methylation in Gastric Cancer
PLOS ONE | DOI:10.1371/journal.pone.0140492 October 13, 2015 2 / 23
had no role in study design, data collection and analysis, decision to publish, or preparation of the manuscript.
Warburg effect [39]. Our previous proteomic study revealed that several proteins involved in energy production processes were deregulated in GC samples and reinforced the Warburg effect in this neoplasia [40]. The role of CKB in GC remains poorly understood: some tran-scriptomic studies reported the upregulation ofCKBin GC samples [41,42], whereas another showedCKBdownregulation [43]. In addition, as for theLYNgene,CKBmethylation was pre-viously described in hematologic and solid cancer cell lines, including GC cell lines [44]. The methylation ofCKBappears to be related to its reduced level of expression; however, further investigation is still necessary to understand the regulation ofCKBby epigenetic modifications.
Therefore, we first aimed to evaluate the mRNA and protein expression of SRC, LYN and CKB in a large set of GC samples. Then, we evaluated whether these genes may be regulated by DNA methylation in gastric carcinogenesis. In addition, we investigated the possible associa-tion between kinase expression or methylaassocia-tion and clinical variables as well as MYC expression and methylation.
Material and Methods
Tissue samples
Kinase expression and methylation patterns were evaluated in 138 pairs of GC samples and their corresponding non-neoplastic gastric tissue samples obtained from patients who under-went gastrectomy in Northern Brazil. All of the patients had negative histories of exposure to either chemotherapy or radiotherapy prior to surgery, and there was no co-occurrence of other diagnosed cancers. This study was approved by the ethics committee of João de Barros Barreto University Hospital (Protocol #316737). Written informed consent with approval of the ethics committee was obtained from all patients prior to specimen collection.
Part of each dissected tumor sample was formalin-fixed and paraffin-embedded (FFPE). Sections of FFPE tissue were stained with hematoxylin-eosin for histological evaluation or used for immunohistochemistry (IHC) analysis. Additional portions of each tumor and paired non-neoplastic tissue specimens were snap-frozen in liquid nitrogen and stored at -80°C until pro-tein and nucleic acid purification.
All of the samples were classified according to Laurén [45], and the tumors were staged according to the TNM staging criteria [46]. The presence ofHelicobacter pylori, a class I carcin-ogen, in gastric samples was detected by the rapid urease test, and its virulence factor cytotoxic-ity associated gene A (CagA gene) was detect by PCR using DNA purified simultaneously with proteins and mRNA, as previously performed by our group [47]. Epstein-Barr virus (EBV) was detected by RNA in situ hybridization [47].
For 49 of these pairs of neoplastic and non-neoplastic samples, we assessed the MYC immu-noreactivity, mRNA expression and methylation status data previously published by our group [18].
Protein, mRNA and DNA purification
Total protein, mRNA, and DNA were simultaneously isolated from gastric tissue samples using the AllPrep DNA/RNA/Protein Kit (Qiagen, Germany) according to the manufacturer's instructions. The protein pellet was dissolved in a buffer containing 7 M urea, 2 M thiourea, 4% CHAPS, 50 mM DTT, 1% Protease Inhibitor Cocktail (Sigma-Aldrich, USA), and 0.5% each Phosphatase Inhibitor Cocktail 1 and 2 (Sigma-Aldrich, USA), as previously performed by our group [48]. The protein concentrations were determined by the method of Bradford (Sigma-Aldrich, USA). The RNA concentration and quality were determined using a Nano-Drop spectrophotometer (Kisker, Germany) and 1% agarose gels, respectively. Samples were stored at -80°C until use.
Kinases Expression and Methylation in Gastric Cancer
Protein immunoreactivity analysis
Tumor tissue sections (3 or 4-mm thick) were deparaffinized in xylene and rehydrated in a graded series of ethanol. After heat-induced epitope retrieval, the tissue sections were incu-bated with primary mouse monoclonal antibodies against SRC (dilution 1:400; clone 28, Life Technologies, USA), LYN (dilution 1:400; clone C13F9; Life Technologies, USA) or CKB (dilu-tion 1:250; HPA001254, Santa Cruz Biotechnology, USA). A universal peroxidase-conjugated secondary antibody kit (LSAB System, DakoCytomation, USA) was used for detection. We used 3,30-diamino-benzidine/H2O2(DakoCytomation, Denmark) as the chromogen and
hematoxylin as the counterstain. A protein immunoreactivity-positive sample was defined as one having 10% or more neoplastic cells that were positive for the protein.
Protein expression analysis
Western blot analysis was performed as previously described by our group [49]. Reduced pro-tein (25μg) from each sample was separated by 12.5% homogeneous SDS-PAGE and
electro-blotted onto a PVDF membrane (Hybond-P, GE Healthcare, USA). The PVDF membrane was blocked with phosphate-buffered saline containing 0.1% Tween 20, and 5% low fat milk and incubated overnight at 4°C with the corresponding primary antibodies: anti-SRC (dilution 1:1000; clone 28, Life Technologies, USA), anti-LYN (dilution 1:1000; clone C13F9; Life Tech-nologies, USA), anti-CKB (dilution 1:400; HPA001254, Santa Cruz Biotechnology, USA), and anti-ACTB (dilution 1:250; Ac-15, Life Technologies, USA). After extensive washing, a peroxi-dase-conjugated secondary antibody was added for 1 h at room temperature. Immunoreactive bands were visualized using the western blotting Luminol reagent, and the images were acquired using an ImageQuant 350 digital image system (GE Healthcare, Sweden). ACTB was used as a loading reference control.
mRNA expression analysis
First, RNA was reverse-transcribed using the High-Capacity cDNA Archive kit according to the manufacturer’s protocol (Life Technologies, USA). Complementary DNA was then ampli-fied by real-time reverse transcription quantitative PCR (RT-qPCR) using TaqMan probes purchased as Assays-on-demand Products for Gene Expression (Life Technologies, USA) and a 7500 Fast Real-Time PCR instrument (Life Technologies, USA). TheGAPDHgene was selected as an internal control for RNA input and reverse-transcription efficiency. All RT-qPCRs were performed in triplicate for both the target genes (SRC: Hs01082246_m1;LYN: Hs00176719_m1;CKB: Hs00176484_m1) and the internal control (GAPDH: NM_002046.3).
The relative quantification of gene expression was calculated according to Livak and Schmittgen [50]. The corresponding control sample was designated as a calibrator from each tumor.
DNA methylation analysis
The methylation pattern and frequency of kinase genes were evaluated by methylation-specific PCR (MSP) [51]. The EZ DNA Methylation-Lightning™Kit (Zymo Research, USA) was used to modify the gDNA by bisulfite treatment, converting unmethylated cytosines into uracils and leaving methylated cytosines unchanged. Specific primers for the gene promoters are described
inTable 1.
PCR reactions were carried out using 0.1μmol/L dNTPs, 2μmol/L MgCl2, 0.5μmol
prim-ers, 1.25 U Taq DNA polymerase, and 100 ng bisulfite-modified DNA. After initial denatur-ation for 5 min at 94°C, 40 cycles at 94°C for 45 s, the annealing temperature (Table 1) for 45 s,
Kinases Expression and Methylation in Gastric Cancer
and 72°C for 30 s were carried out, followed by a final extension for 5 min at 72°C. The PCR products were directly loaded onto 3% agarose gels and electrophoresed. The gel was stained with SYBR1Safe DNA Gel Stain (Life Technologies, USA) and directly visualized under UV illumination. As a positive control for all MSP reactions, a gDNA sample was completely meth-ylated using CpG Methylase (SssI, New England Biolabs, USA) following the manufacturer’s instructions. Furthermore, primers for detecting the wild-type sequence were used to monitor the complete conversion of DNA obtained in the bisulfite reaction.
The samples were stratified as follows: 1) a sample was defined as hypomethylated when a positive amplification product was detected only in the PCR with specific primers for
unmethylated sequences; 2) a sample was defined as hypermethylated when positive amplifica-tion was detected only in the PCR with specific primers for methylated sequences; 3) a sample was defined as partially methylated when positive amplification was detected in the PCR with the two primer sets.
The primers’specificity and MSP results were confirmed using a bisulfite sequencing PCR (BSP) approach [52]. BSP was also used to evaluate the percentage of methylation. The primers and anneling temperatures of BSP are described inTable 1. Following amplification, the frag-ments were purified using the NucleoSpin Gel and PCR Clean-up Kit (Macherey-Nagel, Ger-many), ligated into pGEM T-easy Vector (Promega, Germany) and cloned into competentE. coliJM109 cells. After incubation time, white colonies were selected for PCR with M13 forward
(5'-TGTAAAACGACGGCCAGT-3') and M13 reverse (5'-CAGGAAACAGCTATGAC-3')
primers [53]. After initial denaturation for 3 min at 94°C, the PCR amplification consisted of 35 cycles at 94°C for 30 s, 55°C for 30 s, and 72°C for 90 s were carried out, followed by a final extension for 5 min at 72°C. The PCR products were visualized in agarose gel. Six clones were selected for purification and sequenced in an ABI310 automatic sequencer (Applied Biosys-tems, Foster City, CA, USA). All sequences were aligned with BioEdit v7.0.5 [54], and the methylation analyses were performed with the BiQ Analyzer software [55]. The percentage of methylation for each sample was calculated by dividing the number of methylated CpGs by the total number of CpGs sequenced (CpGs in all the six clones).
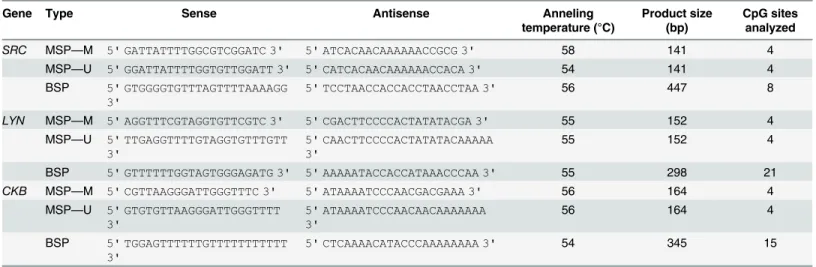
Table 1. Primer sequences (5’-3’) for methylation analysis.
Gene Type Sense Antisense Anneling
temperature (°C)
Product size (bp)
CpG sites analyzed
SRC MSP—M 5' GATTATTTTGGCGTCGGATC 3' 5' ATCACAACAAAAAACCGCG 3' 58 141 4
MSP—U 5' GGATTATTTTGGTGTTGGATT 3' 5' CATCACAACAAAAAACCACA 3' 54 141 4
BSP 5' GTGGGGTGTTTAGTTTTAAAAGG 3'
5' TCCTAACCACCACCTAACCTAA 3' 56 447 8
LYN MSP—M 5' AGGTTTCGTAGGTGTTCGTC 3' 5' CGACTTCCCCACTATATACGA 3' 55 152 4
MSP—U 5' TTGAGGTTTTGTAGGTGTTTGTT 3'
5' CAACTTCCCCACTATATACAAAAA
3'
55 152 4
BSP 5' GTTTTTTGGTAGTGGGAGATG 3' 5' AAAAATACCACCATAAACCCAA 3' 55 298 21
CKB MSP—M 5' CGTTAAGGGATTGGGTTTC 3' 5' ATAAAATCCCAACGACGAAA 3' 56 164 4
MSP—U 5' GTGTGTTAAGGGATTGGGTTTT 3'
5' ATAAAATCCCAACAACAAAAAAA
3'
56 164 4
BSP 5' TGGAGTTTTTTGTTTTTTTTTTT 3'
5' CTCAAAACATACCCAAAAAAAA 3' 54 345 15
MSP: primers for methyl-specific PCR; BSP: primers for Bisulfite Sequencing PCR; M: primer for methylated sequence by MSP; U: primer for unmethylated sequences by MSP; bp: base pair.
doi:10.1371/journal.pone.0140492.t001
Kinases Expression and Methylation in Gastric Cancer
Statistical analyses
The data are shown as the frequency, median and interquartile range (IQR). The Shapiro-Wilk test was used to evaluate the distribution of the age, mRNA, protein expression and percentage of methylation data and to determine the appropriate subsequent test for statistical compari-sons. The Mann-Whitney test was used to investigate possible associations between kinase mRNA or protein expression and categorical variables, such as immunoreactivity, methylation pattern and clinicopathological features. The Mann-Whitney test was used to investigate possi-ble associations between the percentage of methylation and immunoreactivity and clinico-pathological features. Wilcoxon test was used to compare the percentage of methylation between pairs of neoplastic and non-neoplastic samples. An association between categorical variables was analyzed using the Chi-squared (χ2) test. A Spearman correlation test was used to
evaluate the possible correlation between mRNA and protein expression, as well as promoter methylation. A p-value less than 0.05 was considered significant. Bonferroni adjustment of the p-value was applied when multiple comparisons were performed, with the alpha level being divided by the number of comparisons.
Results
Kinase expression in gastric tumors
Non-atypical gastric cells did not present SRC or LYN immunoreactivity (Fig 1A and 1C). However, SRC immunoreactivity was observed in dysplastic cells. Cell membrane and cyto-plasmic immunoreactivity for SRC and LYN was detected in neoplastic cells (Fig 1B and 1D), and LYN also presented nucleic immunoreactivity. CKB immunoreactivity was detected in the cytoplasm or in the cell membrane in non-neoplastic gastric cells (Fig 1E). In contrast, GC cells did not present CKB immunoreactivity (Fig 1F).
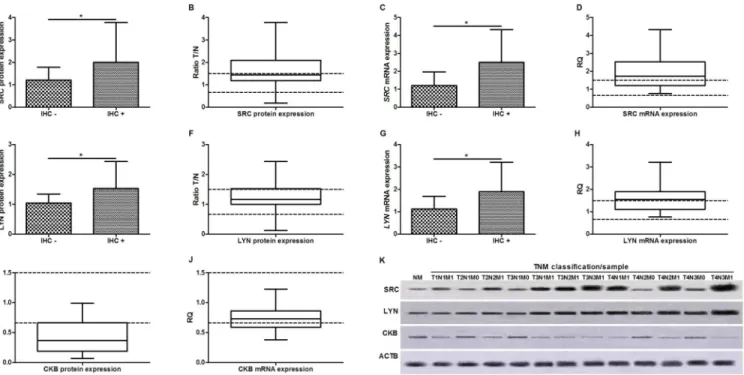
SRC, LYN and CKB immunoreactivity was detected in 72 (52.2%), 66 (47.8%) and 0 (0%) of the tumor samples. SRC and LYN immunoreactivity were associated with higher mRNA and protein levels in GC samples (p<0.001, for all comparisons; Mann-Whitney test;Fig 2A, 2C,
2E and 2G). The protein and mRNA levels of SRC were increased at least 1.5-fold (at least a
50% increase in expression) in 67 (48.6%) and 80 (58%), respectively, GC samples in relation to their matched non-neoplastic gastric samples (Fig 2B, 2D and 2K). Moreover, the protein and mRNA levels of LYN were increased at least 1.5-fold in 36 (26.1%) and 72 (52.2%) GC samples, respectively (Fig 2F, 2H and 2K). Conversely, downregulation of CKB protein and mRNA (at least 50% decrease of expression) was detected in 104 (75.4%) and 49 (35.5%) GC samples, respectively (Fig 2I, 2J and 2K). A strong and direct correlation was observed between mRNA and protein expression for SRC (p<0.001,ρ= 0.856, Spearman correlation test), LYN
(p<0.001,ρ= 0.762) and CKB (p<0.001,ρ= 0.819).
The immunoreactivity of SRC was associated with the immunoreactivity of LYN (p<0.001, χ2test), with 52 (37.7%) of the GC samples presenting immunoreactivity for both proteins. In
addition, a direct correlation was observed between SRC and LYN protein (p<0.001,ρ=
0.556) and mRNA (p<0.001,ρ= 0.779) expression. The levels of CKB protein and mRNA
expression were inversely correlated with SRC (p<0.001,ρ= -0.734; p<0.001,ρ= -0.806,
respectively) and LYN (p<0.001,ρ= -0.643; p<0.001,ρ= -0.703, respectively).
Table 2shows the results for SRC, LYN and CKB expression and the clinicopathological
characteristics. The tumors of patients with late-onset GC presented significantly higher SRC and LYN protein (by IHC and western blotting) and mRNA (by RT-qPCR) expression, as well as reduced CKB protein expression by western blotting, compared with early-onset CG sam-ples (p<0.05, for all comparisons;Table 2). Increased protein and mRNA expression of SRC
Kinases Expression and Methylation in Gastric Cancer
and LYN and reduced CKB expression were associated with advanced stage, deeper tumor invasion, and the presence of lymph node and distant metastases (p<0.05, for all
compari-sons;Table 2).
A gradual significant increase in SRC protein (by western blotting) and mRNA expression was observed corresponding to the tumor stage (p<0.008, for most of the comparisons;
Mann-Whitney test followed by Bonferroni correction;Fig 3A and 3B). In contrast, a gradual significant decrease in CKB protein and mRNA expression was observed corresponding to the tumor stage (p<0.008, for most of the comparisons;Fig 3G and 3H). With regard to LYN
expression, we did not observe a significant difference between stages I and II or between stages III and IV. However, stages I and II were significantly different from stages III and IV (p<0.008, for these comparisons;Fig 3D and 3E).
Fig 1. Kinases immunoreactivity in gastric tissue samples.A) gastric mucosa without SRC
immunoreactivity; B) diffuse-type gastric cancer presenting cell membrane and cytoplasmic immunoreactivity of SRC; C) non-neoplastic gastric tissue without LYN immunoreactivity; D) intestinal-type gastric cancer presenting LYN immunoreactivity; E) non-neoplastic gastric mucosa showing weak cytoplasmic CKB staining in glandular cells; F) diffuse-type gastric cancer cells without CKB immunoreactivity.
doi:10.1371/journal.pone.0140492.g001
Kinases Expression and Methylation in Gastric Cancer
Kinase gene methylation patterns in gastric samples
Table 3shows the methylation pattern of the studied protein kinases in neoplastic and
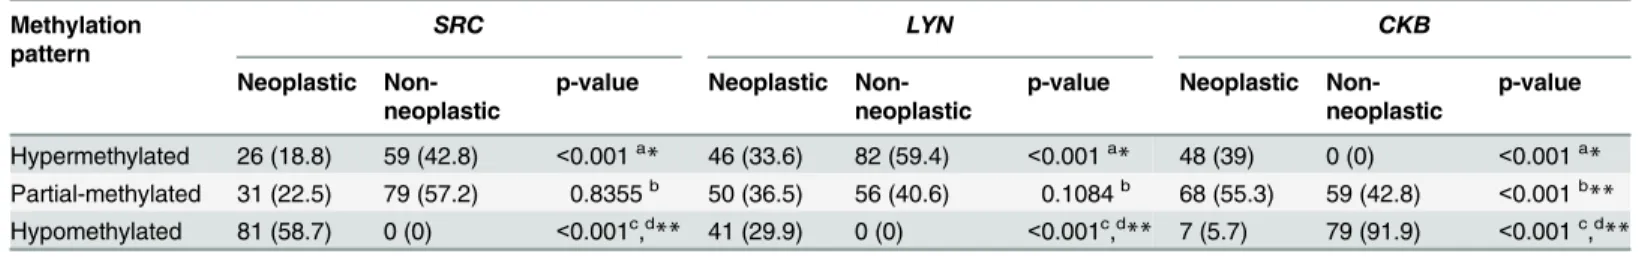
non-neoplastic gastric samples by MSP. Approximately 60% and 30% of the GC samples presented positive amplification with only the unmethylated primer set (hypomethylated samples) for theSRCandLYNgenes, respectively (Fig 4A and 4B). Hypomethylation of these genes was not observed in any non-neoplastic sample. Therefore, the frequency ofSRCandLYN hypomethy-lation was significantly higher in GC than in non-neoplastic gastric samples (p<0.001, for all
comparisons;χ2test followed by Bonferroni corrections).
The BSP analysis confirmed the MSP analysis. By BSP, 82 (59.4%) of neoplastic samples and 0 (0%) of non-neoplastic samples presented a cloned sequence without CpG methylation inSRCpromoter. In addition, 4 (2.89%) and 1 (0.72%) of neoplastic and non-neoplastic sam-ples presented a cloned sequence without CpG methylation inLYNpromoter, respectively. By BSP, the percentage ofSRC[0.135 (0.31)versus0.563 (0.23); p<0.001] andLYN[0.238 (0.40)
versus0.7063 (0.26); p<0.001] methylation was lower in neoplastic samples than in
non-neo-plastic samples (Fig 5A and 5B).
TheSRCandLYNmethylation patterns of the neoplastic and non-neoplastic samples whereas found to be associated (p<0.001, for both analyses;χ2test). We observed that 70/81
(86.4%) of tumors with hypomethylatedSRCpresented partial methylation of this gene in the matched non-neoplastic sample. In addition, we found that 37/41 (90.24%) of tumors with hypomethylatedLYNpresented partial methylation of this gene in the matched non-neoplastic sample.SRCandLYNpartial methylation in non-neoplastic samples was more frequently Fig 2. Kinases expression in gastric cancer.A) Association between SRC immunoreactivity and its protein expression; B) SRC protein expression; C) Association between SRC immunoreactivity and its mRNA expression; D)SRCmRNA expression. E) Association between LYN immunoreactivity and its protein expression; F) LYN protein expression; G) Association between LYN immunoreactivity and its mRNA expression; H)LYNmRNA expression; I) CKB protein expression; J)CKBmRNA expression; K) representative image of Western-blot, in each TNM of each sample is show. Protein and mRNA expression
were determined by Western-blot and RT-qPCR analysis, respectively. In all graphs, the expression in gastric tumors was normalized by matched non-neoplastic gastric tissue.*Significant difference between groups by Mann-Whitney (p<0.05). IHC+: cases presenting protein immunoreactivity; IHC–: cases without protein immunoreactivity; NM: normal mucosa sample.
doi:10.1371/journal.pone.0140492.g002
Kinases Expression and Methylation in Gastric Cancer
Table 2. Clinicopathological variables and kinases expression in gastric cancer.
Variable N SRC
immunoreactivity
SRC protein SRCmRNA LYN
immunoreactivity
LYN protein LYNmRNA CKB
immunoreactivity
CKB protein CKBmRNA
N (%) of positive cases
p-valuea Ratio T/N[median
(IQR)]
p-valueb RQ[median
(IQR)]
p-valueb N (%) ofpositive
cases
p-valuea Ratio T/N[median
(IQR)]
p-valueb RQ[median
(IQR)]
p-valueb N (%) ofnegative
cases
p-valuea Ratio T/N[median
(IQR)]
p-valueb RQ[median
(IQR)] p-valueb
Gender
Female 50 27 (54) 0.442 1.33
(0.82) 0.285 1.63(1.16) 0.674 25 (50) 0.417 1.19(0.48) 0.728 1.56(0.77) 0.910 50 (100) - 0.37(0.51) 0.529 0.73(0.26) 0.750 Male 88 45 (51.1) 1.67
(0.99) 1.79(1.36) 41 (62.1) 1.15(0.53) 1.56(0.82) 88 (100) 0.36(0.47) 0.73(0.31)
Onset
<45 years 35 13 (37.1) 0.031* 1.29
(0.69) 0.011* 1.46(1.05) 0.027* 10 (28.6) 0.007* 1.08(0.27) 0.008* 1.23(0.64) 0.014* 35 (100) - 0.49(0.48) 0.028* 0.77(0.22) 0.132
45 years 103 59 (57.3) 1.67
(1.02) 1.82 (1.5) 56 (54.4) 1.22(0.62) 1.64(0.82) 103 (100) 0.32(0.49) 0.71(0.30)
Tumor location
Cardia 52 22 (42.3) 0.052 1.35 (0.77)
0.263 1.46 (1.2) 0.152 21 (40.4) 0.118 1.14 (0.57)
0.276 1.25 (0.82)
0.090 52 (100) 0.40 (0.47)
0.190 0.74 (0.24)
0.309
Non-cardia 82 50 (58.1) 1.64 (0.94)
1.85 (1.35)
45 (52.3) 1.19 (0.50)
1.62 (0.79)
86 (100) 0.34 (0.47)
0.72 (0.28)
Histological type
Diffuse 64 35 (54.7) 0.353 1.58
(0.84) 0.665 1.89(1.34) 0.838 31 (48.4) 0.515 1.18(0.55) 0.785 1.58(0.82) 0.629 64 (100) - 0.33(0.48) 0.651 0.71(0.26) 0.210 Intestinal 74 37 (50) 1.44
(1.03) 1.63(1.40) 35 (47.3) 1.15(0.45) 1.50(0.80) 74 (100) 0.39(0.50) 0.74(0.27)
Stage
Early 12 3 (25) 0.046* 1.04
(0.67) 0.001* 1.04(0.78) 0.002* 0 (0)
<0.001* 1.02
(0.19) 0.003* 0.89(0.27)
<0.001* 12 (100) 0.74
(0.58) 0.015* 0.95(0.38) 0.019* Advanced 126 69 (54.8) 1.55
(0.94) 1.80(1.34) 66 (52.4) 1.21(0.53) 1.61(0.77) 126 (100) 0.36(0.47) 0.72(0.26)
Tumor invasion
T1/T2 43 14 (32.6) 0.002* 1.24 (0.64)
<0.001* 1.29
(0.99)
<0.001* 5 (11.6) <0.001* 1.05
(0.26)
<0.001* 1.17
(0.30)
<0.001* 43 (100) - 0.66
(0.54)
<0.001* 0.88
(0.31)
<0.001*
T3/T4 95 58 (61.1) 1.76
(1.07) 1.99(1.55) 61 (64.2) 1.32(0.60) 1.75(0.81) 95 (100) 0.28(0.40) 0.69(0.24)
Lymph node metastasis
Absent 16 0 (0) <0.001* 1.13
(0.26)
<0.001* 0.93
(0.24)
<0.001* 1 (6.3) <0.001* 1.01
(0.26)
<0.001* 0.99
(0.17)
<0.001* 16 (100) - 0.73
(0.20)
<0.001* 0.95
(0.24)
<0.001*
Present 122 72 (59) 1.67 (0.98)
1.89 (1.29)
65 (53.3) 1.23 (0.52)
1.63 (0.73)
122 (100) 0.31 (0.40)
0.70 (0.25)
Distant metastasis
Absent 70 11 (15.7) <0.001* 1.22
(0.25)
<0.001* 1.22
(0.41)
<0.001* 16 (22.9) <0.001* 106
(0.28)
<0.001* 1.11
(0.38)
<0.001* 70 (100) - 0.66
(0.31)
<0.001* 0.86
(0.22)
<0.001*
Present 68 61 (89.7) 2.11
(0.76) 2.53(0.92) 50 (73.5) 1.43(0.61) 1.81(0.44) 68 (100) 0.19(0.12) 0.60(0.16)
H.pylori
(Continued)
Table 2. (Continued)
Variable N SRC
immunoreactivity
SRC protein SRCmRNA LYN
immunoreactivity
LYN protein LYNmRNA CKB
immunoreactivity
CKB protein CKBmRNA
N (%) of positive cases p-valuea Ratio T/N [median (IQR)] p-valueb RQ [median (IQR)] p-valueb
N (%) of positive cases p-valuea Ratio T/N [median (IQR)] p-valueb RQ [median (IQR)] p-valueb
N (%) of negative cases p-valuea Ratio T/N [median (IQR)] p-valueb RQ [median (IQR)] p-valueb
Negative 14 9 (64.3) 0.251 1.47
(1.03) 0.647 1.71(1.47) 0.764 9 (64.3) 0.154 1.20(0.53) 0.838 1.60(0.91) 0.762 14 (100) - 0.30(0.34) 0.391 0.73(0.18) 0.841 Positive 124 63 (50.8) 1.44
(0.90) 1.73(1.32) 57 (46) 1.16(0.52) 1.54(0.79) 124 (100) 0.37(0.50) 0.73(0.29)
CagA
Negative 49 26 (53.1) 0.510 1.55
(0.84) 0.730 1.76(1.17) 0.779 24 (49) 0.490 1.15(0.52) 0.304 1.41(0.73) 0.441 49 (100) - 0.34(0.44) 0.836 0.74(0.30) 0.437 Positive 89 46 (51.7) 1.44
(0.99) 1.70(1.40) 42 (47.2) 1.17(0.49) 1.58(0.82) 89 (100) 0.37(0.51) 0.73(0.28)
EBV
Negative 117 60 (51.3) 0.399 1.44
(0.81) 0.259 1.67(1.22) 0.371 55 (47) 0.414 1.15(0.53) 0.718 1.56(0.79) 0.652 117 (100) - 0.37(0.49) 0.397 0.73(0.29) 0.543 Positive 21 12 (57.1) 1.77
(1.21) 2.24(1.67) 11 (52.4) 1.18(0.56) 1.53(0.95) 21 (100) 0.27(0.51) 0.70(0.28)
ap-value by
χ2test
bp-value by Mann-Whitney test
*Significantly difference between groups (p<0.05)
N: number of samples; IQR: interquartile range; EBV:Epstein-Barr virus
observed in individuals presenting tumor samples with hypomethylation of this gene com-pared with tumors with partial methylation (p<0.001, for both analyses) or hypermethylation
(p<0.001, for both analyses). Furthermore, partially methylatedLYNin non-neoplastic
sam-ples was also more frequently detected in individuals presenting tumor samsam-ples with partial methylation of this gene compared with tumors with hypermethylation (p = 0.004). By BSP, we also observed that the percentage ofSRC(p<0.001,ρ= 0.6902;Fig 5D) andLYN
(p<0.001,ρ= 0.739;Fig 5E) methylation of neoplastic and non-neoplastic samples were
correlated.
CKBpartial and hypomethylation was observed in both neoplastic and non-neoplastic sam-ples. However, 48 (39%) of GC samples presentedCKBhypermethylation (Fig 4C), which was not detect in the non-neoplastic samples. Moreover, the frequency ofCKB-hypermethylated samples was significantly higher in neoplastic compared to non-neoplastic gastric samples Fig 3. Kinases protein and mRNA expression and DNA methylation by tumor stage.A) SRC protein expression; B)SRCmRNA expression; C) Percentage ofSRCmethylation; D) LYN protein expression; E)LYNmRNA expression; F) Percentage ofLYNmethylation; G) CKB protein expression; H)
CKBmRNA expression; I) Percentage ofCKBmethylation. Protein and mRNA expression were determined by Western-blot and RT-qPCR analysis, respectively. In these expression analyses, the expression in gastric tumors was normalized by matched non-neoplastic gastric tissue. DNA methylation was determined by bisulfite sequencing PCR.*Significant difference between groups by Mann-Whitney test followed by Bonferroni corrections for multiple comparison analysis (p<0.008);**Significant difference between groups by Mann-Whitney test followed by Bonferroni corrections for multiple comparison analysis (p<0.001);+Difference between groups but not statistically significant after Bonferroni adjustment (p<0.05).
doi:10.1371/journal.pone.0140492.g003
Kinases Expression and Methylation in Gastric Cancer
(p<0.001), andCKBpartial methylation was also significantly more frequent in GC than in
non-neoplastic samples (p<0.001). By BSP, the percentage ofCKBmethylation was higher in
neoplastic samples than in non-neoplastic samples [0.511 (0.42)versus0.133 (0.12); p<0.001;
Fig 5C]. Cloned sequences without CpG methylation was detected in 4 (2.89%) and 0 (0%) of
neoplastic and non-neoplastic samples, respectively.
TheCKBmethylation pattern of the neoplastic and non-neoplastic samples appeared to be associated (p = 0.014, byχ2test). A 2x2 analysis using theχ2test revealed that pairs in which
the tumor samples presented hypermethylatedCKBand the matched non-neoplastic samples presented hypomethylation of this gene were more frequent than pairs of tumors with hyper-methylation and matched non-neoplastic samples with partial hyper-methylation (p = 0.0381), but this finding did not reach statistical significance if the Bonferroni adjustment was applied (adjustedα= 0.05/3 = 0.0167). However, by BSP, we observed that the percentage ofCKB
methylation of neoplastic and non-neoplastic samples were inversely correlated (p<0.001,ρ=
-0.375;Fig 5F).
A direct correlation was observed between theSRCandLYNmethylation patterns in the non-neoplastic samples (p<0.001,ρ= 0.627). In addition, an inverse correlation was detected
betweenSRCandCKB(p<0.001,ρ= -0.467) andLYNandCKB(p<0.001,ρ= -0.359)
meth-ylation. However, in GC samples, a direct correlation was observed among the methylation percentage of the three studied kinases:SRCandLYN(p<0.001,ρ= 0.840);SRCandCKB
(p<0.001,ρ= 0.684);LYNandCKB(p<0.001,ρ= 0.663).
Table 3. Protein kinases methylation pattern in gastric samples.
Methylation pattern
SRC LYN CKB
Neoplastic Non-neoplastic
p-value Neoplastic Non-neoplastic
p-value Neoplastic Non-neoplastic
p-value
Hypermethylated 26 (18.8) 59 (42.8) <0.001a* 46 (33.6) 82 (59.4) <0.001a* 48 (39) 0 (0) <0.001a* Partial-methylated 31 (22.5) 79 (57.2) 0.8355b 50 (36.5) 56 (40.6) 0.1084b 68 (55.3) 59 (42.8) <0.001b
** Hypomethylated 81 (58.7) 0 (0) <0.001c,d** 41 (29.9) 0 (0) <0.001c,d** 7 (5.7) 79 (91.9) <0.001c,d**
ap-value of χ2test
bp-value of the post-hoc comparison between tissue samples hypermethylated and partial-methylated cp-value of the post-hoc comparison between tissue samples partial-methylated and hypomethylated dp-value of the post-hoc comparison between tissue samples hypermethylated and hypomethylated *Statistically significant difference between neoplastic and non-neoplastic samples byχ2test (p<0.05) **Statistically significant difference between groups byχ2test followed Bonferroni adjustment (p<0.016)
doi:10.1371/journal.pone.0140492.t003
Fig 4. Methylation analysis of the kinases promoters showing methylated and unmethylated bands.
A)SRCpromoter methylation analysis, in which samples 1 and 2 presented hypomethylated promoter, sample 3 presented partial methylation and sample 4 presented hypermethylated promoter; B)LYNpromoter
methylation analysis, in which samples 1 presented hypomethylated promoter, sample 2 presented partial methylation and samples 3 and 4 presented hypermethylated promoter; C)CKBpromoter methylation analysis, in which samples 1 and 2 presented hypermethylated promoter, and samples 3 and 4 presented hypomethylated promoter. C–: blank; C+: positive control, gDNA sample completely methylated; U: PCR with
unmethylated primer set; M: PCR with methylated primer set; MW: molecular weight marker; bp: base pairs.
doi:10.1371/journal.pone.0140492.g004
Kinases Expression and Methylation in Gastric Cancer
Methylation regulation of kinases
To elucidate the epigenetic regulation of the studied genes, we evaluated the possible associa-tion between the promoter methylaassocia-tion and protein immunoreactivity and mRNA and protein expression (by western blotting).
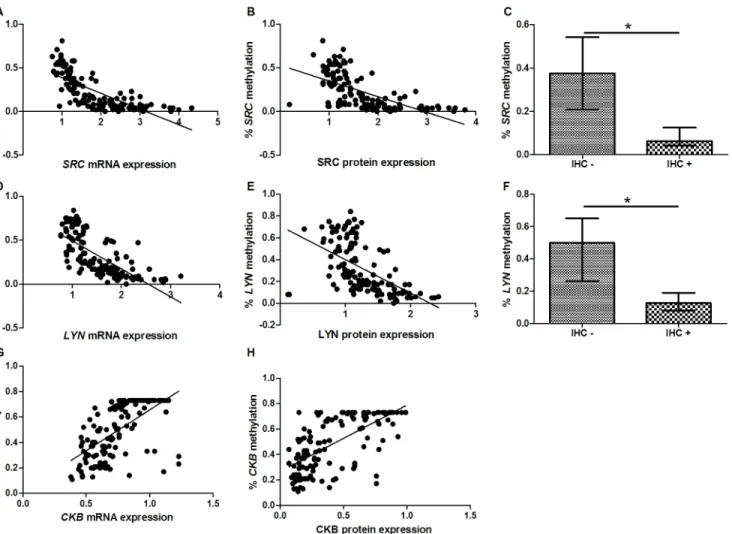
We observed that both the mRNA and protein expression of SRC (p<0.001,ρ= -0.834;
p<0.001,ρ= -0.718; respectively;Fig 6A and 6B) and LYN (p<0.001,ρ= -0.792; p<0.001,
ρ= -0.654; respectively;Fig 6D and 6E) was inversely correlated to the percentage of
pro-moter methylation. Moreover, tumors with SRC [0.062 (0.08)versus0.375 (0.33); p<0.001;
Mann-Whitney test;Fig 6C] and LYN [0.127 (0.11)versus0.500 (0.39); p<0.001;Fig 6F]
immunoreactivity presented lower percentage of methylation than tumor lacking this protein immunoreactivity.
Concerning CKB regulation, a direct correlation was observed between the percentage of methylation and the CKB mRNA and protein expression (p<0.001,ρ= 0.684; p<0.001,ρ=
0.686; respectively;Fig 6G and 6H). Interestingly, increased CKB protein and mRNA expres-sion was observed in tumors with a hypomethylatedCKBpromoter compared with tumors with a partially methylated promoter (p = 0.015, p = 0.008, respectively; Mann-Whitney test followed by Bonferroni corrections;S1 Fig). However, tumors with a hypermethylatedCKB promoter also presented increased protein and mRNA expression compared with tumors with a partially methylated promoter (p<0.001, for both comparisons).
Methylation of kinase promoters and clinicopathological variables
In non-neoplastic gastric mucosa, the percentage ofSRC(p = 0.010,ρ= -0.218) andLYN(p = 0.003,ρ= -0.248) methylation was (weakly) inversely correlated with the age of patients at
Fig 5. Percentage of methylation in gastric samples.A)SRCmethylation in gastric tumors and non-tumor samples; B)LYNmethylation in gastric tumors and non-tumor samples; C)CKBmethylation in gastric tumors and non-tumor samples; D) Correlation between the percentage ofSRCmethylation in gastric tumors and paired non-tumor samples; E) Correlation between the percentage ofLYNmethylation in gastric tumors and paired non-tumor samples; F)
Correlation between the percentage ofCKBmethylation in gastric tumors and paired non-tumor samples.*Significant difference between groups by Mann-Whitney test (p<0.05).
doi:10.1371/journal.pone.0140492.g005
Kinases Expression and Methylation in Gastric Cancer
surgery, though no other association was observed between the percentage of methylation and gender,H.pyloriand EBV infection in the non-neoplastic samples (p>0.05; Mann-Whitney
test).
Table 4shows the associations between the percentage of methylation in GC samples and
clinicopathological characteristics. In neoplastic samples, the percentage ofSRC(p = 0.002,ρ=
-0.267),LYN(p = 0.014,ρ= -0.208) andCKB(p = 0.024,ρ= -0.192) methylation was (weakly)
inversely correlated with the age of patients at surgery. Moreover, the percentage ofSRC (p = 0.002),LYN(p = 0.015) andCKB(p = 0.024) methylation was lower in late-onset than in early-onset GC samples. Additionally, we observed that SRC methylation was lower in non-cardia GC in relation to non-cardia GC (p = 0.028).
Reduced percentage ofSRC,LYNandCKBmethylation were associated with advanced stage, deeper tumor invasion, and the presence of lymph node and distant metastases
(p<0.05, for all comparisons;Table 4). The comparison ofSRCandLYNmethylation pattern
by MSP and clinicopathological characteristics presented similar results (S2 Table). However, partial methylation ofCKBby MSP was also more frequently found than hypermethylation in Fig 6. Kinases expression regulation by DNA methylation.A)SRCmRNA expression; B) SRC protein expression; C) SRC immunoreactivity; D)LYN
mRNA expression; E) LYN protein expression; F) LYN protein immunoreactivity; G)CKBmRNA expression; H) CKB protein expression. Protein and mRNA expression were determined by Western-blot and RT-qPCR analysis, respectively. In these analyses, the expression in gastric tumors was normalized by matched non-neoplastic gastric tissue.*Significant difference between groups byχ2(for analysis involving IHC data) or Mann-Whitney tests (p<0.05). IHC–:
cases without protein immunoreactivity; IHC+: cases presenting protein immunoreactivity.
doi:10.1371/journal.pone.0140492.g006
Kinases Expression and Methylation in Gastric Cancer
T3/T4 tumors (p = 0.008;S2 Table).CKBpartial methylation was also more frequent than hypermethylation (p<0.001) and hypomethylation (p = 0.009;S2 Table) in tumors from
individuals with distant metastasis in relation to tumors from individuals without distant metastasis.
A gradual decrease in the percentage ofSRCandLYNmethylation was observed corre-sponding to the tumor stage (p<0.008, for most of the comparisons; Mann-Whitney test
fol-lowed by Bonferroni correction;Fig 3C and 3F). With regard toCKBmethylation, 12 of 14 (85.7%) of the samples of GC in the stage I presented 73.3% of methylation. The percentage of Table 4. Clinicopathological variables and kinases methylation in gastric cancer.
Variable N %SRCmethylation %LYNmethylation %CKBmethylation
Median (IQR) p-value Median (IQR) p-value Median (IQR) p-value
Gender
Female 50 0.13 (0.31) 0.523 0.23 (0.45) 0.424 0.51 (0.42) 0.804
Male 88 0.13 (0.36) 0.24 (0.39) 0.51 (0.42)
Onset
<45 years 35 0.31 (0.44) 0.002* 0.28 (0.48) 0.015* 0.63 (0.30) 0.024*
45 years 103 0.10 (0.31) 0.19 (0.39) 0.50 (0.41)
Tumor location
Cardia 52 0.11 (0.30) 0.028* 0.19 (0.38) 0.184 0.49 (0.44) 0.076
Non-cardia 82 0.26 (0.41) 0.32 (0.43) 0.53 (0.40)
Histological type
Diffuse 64 0.19 (0.35) 0.182 0.26 (0.38) 0.579 0.49 (0.46) 0.309
Intestinal 74 0.10 (0.33) 0.21 (0.41) 0.52 (0.39)
Stage
Early 12 0.41 (0.44) 0.016* 0.52 (0.49) 0.004* 0.73 (0.24) 0.006*
Advanced 126 0.12 (0.33) 0.21 (0.38) 0.50 (0.42)
Tumor invasion
T1/T2 43 0.31 (0.42) <0.001* 0.55 (0.46) <0.001* 0.73 (0.29) <0.001*
T3/T4 95 0.10 (0.27) 0.17 (0.34) 0.43 (0.42)
Lymph node metastasis
Absent 16 0.51 (0.16) <0.001* 0.69 (0.12) <0.001* 0.73 (0.07) <0.001*
Present 122 0.10 (0.27) 0.19 (0.32) 0.45 (0.41)
Distant metastasis
Absent 70 0.37 (0.30) <0.001* 0.52 (0.32) <0.001* 0.72 (0.08) <0.001*
Present 68 0.06 (0.04) 0.12 (0.10) 0.33 (0.22)
H.pylori
Negative 14 0.12 (0.49) 0.520 0.29 (0.46) 0.519 0.56 (0.31) 0.310
Positive 124 0.13 (0.31) 0.24 (0.38) 0.50 (0.43)
CagA
Negative 49 0.10 (0.32) 0.659 0.25 (0.43) 0.774 0.50 (0.40) 0.588
Positive 89 0.15 (0.35) 0.24 (0.38) 0.52 (0.43)
EBV
Negative 117 0.15 (0.31) 0.605 0.25 (0.39) 0.144 0.52 (0.42) 0.402
Positive 21 0.12 (0.41) 0.13 (0.35) 0.40 (0.44)
*Significantly difference between groups by Mann-Whitney test (p<0.05) N: number of samples; IQR: interquartile range; EBV:Epstein-Barr virus
doi:10.1371/journal.pone.0140492.t004
Kinases Expression and Methylation in Gastric Cancer
CKBmethylation was higher in stage I than in stages II, III and IV (p<0.008, for most of these
comparisons;Fig 3I). Conversely, the percentage ofCKBmethylation was significantly reduced in the stage IV in relation to the other stages (p<0.008, for these comparisons;Fig 3I).
Kinases and MYC relationships
We examined MYC immunoreactivity, mRNA expression and methylation status data for a set of 49 of the studied pairs of neoplastic and non-neoplastic samples. [18]
MYC immunoreactivity was detected in 38 (77.6%) tumors. The immunoreactivity of MYC was associated with the immunoreactivity of SRC (p<0.001, byχ2test) and LYN (p<0.004,
byχ2test), with 2 (4.1%) GC samples presenting only kinase immunoreactivity and 9 (18.4%)
GC samples without MYC or kinase immunoreactivity.
The mRNA level ofMYCwas increased at least 1.5-fold in all GC samples in relation to matched non-neoplastic gastric samples. In addition, a direct correlation was observed between the mRNA expression ofMYCandSRC(p<0.001,ρ= 0.856;Fig 7A) andMYCandLYN
(p<0.001,ρ= 0.763;Fig 7B). In contrast, an inverse correlation was observed betweenMYC
andCKBmRNA expression (p<0.001,ρ= -0.890;Fig 7C).
In non-neoplastic samples, a direct correlation was observed between theMYCandSRC methylation patterns (p<0.001,ρ= 0.486) and betweenMYCandLYNmethylation patterns
(p<0.001,ρ= 0.647) by MSP. In addition, an inverse correlation was detected betweenMYC
andCKB(p<0.001,ρ= -0.320). However, no correlation was observed betweenMYCand the
three studied kinases in the GC samples:MYCandSRC(p = 0.626,ρ= -0.071);MYCandLYN
(p = 0.724,ρ= 0.052);MYCandCKB(p = 0.820,ρ= -0.039).
Discussion
Kinases are the most intensively studied category of protein drug targets in current pharmaco-logical research, as evidenced by the vast number of kinase-targeting agents enrolled in active clinical trials [4]. In the present study, we evaluated the role of CKB and of two members of the SRC family of kinases, SRC and LYN. We observed that the SRC and LYN kinases were upregu-lated in approximately 50% of GC samples. Aberrant SRC activity has already been observed in several human cancers, including GC [7–9]. In addition, LYN overexpression has been reported in several cancers, such as chronic myelogenous leukemia [26], colorectal cancer [27], breast cancer [28], prostate cancer [29], oral cancer [30], renal cancer [31] and Ewing’s sarcoma [32]; nonetheless, no previous study has evaluated the role of LYN in gastric carcinogenesis. Our results suggest that SRC and LYN may be targets of anticancer therapies in GC patients present-ing elevated expression of these kinases.
SRC immunoreactivity or elevated protein and mRNA expression was associated with late onset, an advanced stage, deeper tumor extension and the presence of metastasis. Yang et al. demonstrated that SRC regulates migration and invasion in a GC cell line (BGC-823) following Fig 7. Correlation betweenMYCand kinases mRNA expression.A)MYCandSRC; B)MYCandLYN; C)
MYCandCKB.
doi:10.1371/journal.pone.0140492.g007
Kinases Expression and Methylation in Gastric Cancer
treatment of these cells with the SRC inhibitors PP2 and SU6656, which is in part in agreement with our findings in primary GC samples [56]. Moreover, as for SRC, LYN may also have a role in gastric tumor invasiveness, metastasis, and thus aggressiveness. These associations have been suggested for other cancers. LYN upregulation was associated with colorectal tumor grade, stage, and lymph node and distant metastases [27]. In addition, the inhibition of LYN was able to decrease primary tumor growth, reduce metastases in an in vivo model of Ewing’s sarcoma, and decrease the invasive capacity of Ewing’s sarcoma cells in vitro [32].
The mitogenic function of SRC is, at least in part, mediated by the induction of MYC [12, 13]. Here, we report a direct correlation between SRC and LYN expression, as well as between the expression of these kinases and that of MYC. As for SRC and LYN, MYC immunoreactivity or elevated mRNA expression was previously associated with late onset, advanced stage, deeper tumor extension and the presence of metastasis [18]. We also previously described MYC dereg-ulation in preneoplastic gastric lesions [15,19,57]. Therefore, our results suggest that the observed associations among SRC, LYN and MYC might be necessary for gastric carcinogene-sis progression.
In our study, CKB downregulation was observed in GC samples.CKBdownregulation was previously detected in a transcriptomic study [43], however, further validation by other meth-odologies was lacking. This enzyme is overexpressed in a wide variety of cancers [37,58,59], with the exception of colon cancer [60,61]. Li et al. showed that CKB knockdown inhibits ovarian cancer progression by decreasing glycolysis [60]. Our previous proteomic study sug-gested the presence of a Warburg effect in GC [40], and we also reported the upregulation of theMYConcogene [14–18], which appears to contribute to this effect [39]. Therefore, the downregulation of CKB and its strong inverse correlation with MYC expression is not in agree-ment with the role of CKB in the regulation of glycolysis in gastric carcinogenesis [40].
Mooney et al. suggested that ATP storage is not the most important function of CKB in colon cancer, in which the expression of CKB protein and mRNA are downregulated [61]. These authors showed that the overexpression of CKB-C283S, a dominant-negative construct with effects similar to CKB downregulation, appears to promote the epithelial-to-mesenchymal transition in colon cancer [61]. In addition, the authors showed that although CKB expression may be advantageous to the formation of a solid tumor, it appears to be a hindrance to the met-astatic potential of colon cancer cells. Similar to the findings of Mooney et al. [61], our results also showed that reduced CKB in GC may have a role in tissue invasion and metastasis. More-over, Mooney et al. also showed that colon cancer cells overexpressing CKB-C283S and cul-tured in medium without glucose presented higher expression of MYC than cells with a wild-type CKB construct [61]. In the present study, we detected a strong inverse correlation between CKB and MYC. Thus, an inverse correlation between CKB and MYC might also be necessary for GC progression.
Interestingly, increased SRC and LYN expression and reduced CKB expression were also associated with onset GC. Clinicopathological differences between early-onset and late-onset GC have been described [62–64], but little is known about the genetic and epigenetic changes associated with the age of onset of GC [65]. Buffart et al. previously demonstrated that young and old patients belong to groups with different genomic profiles [66]. The deregulation of the three studied kinases highlights the heterogeneity of GC.
DNA methylation of CpG islands plays a crucial role in the regulation of gene expression. Our group previously reported alterations in the DNA methylation pattern of several onco-genes and tumor suppressor onco-genes in GC samples of individuals from Northern Brazil [18,67–
73]. According to CpG Island Searcher, theSRCandLYNgenes contain a CpG island of more than 1 kb (http://cpgislands.usc.edu/; version: 10/29/04). The first CpG island in theSRCgene is between intron 1 and intron 2, and theLYNgene has a CpG island in its promoter, exon 1
Kinases Expression and Methylation in Gastric Cancer
and part of intron 1. Among the three studied kinases,CKBhas the largest CpG island, almost 3 kb, located between its promoter and intron 3. To the best of our knowledge, no previous study has evaluated the methylation patterns of these kinases in gastric tissue samples.
In the present study, we observed that theSRC,LYNandCKBmethylation patterns were altered in GC. ReducedSRCandLYNmethylation was detected in GC samples. The reduced SRCandLYNmethylation was associated with increased levels of mRNA and protein expres-sion, suggesting that DNA methylation is involved in regulating the expression of these kinases. Moreover, patients with tumors presenting loss ofSRCandLYNmethylation also exhibited altered methylation for these genes in non-neoplastic gastric mucosa, albeit at a lower level. Although further investigation of premalignant GC is necessary, this finding suggests that indi-viduals with the loss ofSRCandLYNmethylation in the gastric mucosa may have a higher risk for GC.
The identification of specific DNA methylation patterns may help in the classification of GC and could be associated with specific clinical outcomes. Here, we report that reducedSRC andLYNmethylation was associated with advanced stage GC, deeper tumor invasion and with lymph node or distant metastasis. These findings support the hypothesis that DNA methyla-tion is involved inSRCandLYNregulation because we also observed that the elevated expres-sion of theses kinases may have a role in GC invasiveness and metastasis. DNA is a stable molecule, and the detection of DNA methylation, especially by the MSP assay (a qualitative method), may be readily used as an approach for GC prognosis in the clinical routine. There-fore, analysis of theSRCandLYNmethylation may help in determining GC prognosis.
ReducedSRCandLYNmethylation and their increased expression were associated with late-onset GC. The incidence of GC increases with age, highlighting the association between age-related methylation and GC development [71,74].
In contrast, the percentage ofCKBmethylation was higher in GC samples than in non-neo-plastic gastric samples. However, increased percentage of CpG methylated sites inCKB pro-moter were correlated with increased mRNA and protein expression. On the other hand, tumors with partial methylation ofCKBpresented reduced protein and mRNA expression compared to tumors with hypermethylated and hypomethylatedCKB. Ishikawa et al. [44] pre-viously evaluatedCKBmethylation patterns in seven GC cell lines and other solid tumor cell lines and observed thatCKBpromoter methylation was not associated with mRNA expression. We hypothesized that DNA methylation of other CpGs, as well as other genetic and epigenetic mechanisms, may also have a role inCKBgene expression. Moreover, post-transcriptional mechanisms may be involved in CKB regulation in gastric carcinogenesis because we observed that the frequency of GC samples presenting reduced CKB protein expression was higher than those presenting reduced mRNA expression.
Although reduced CKB expression was associated with a poor prognosis and late-onset GC, reducedCKBmethylation was associated with advanced stage, deeper tumor invasion, lymph node or distant metastasis and with late-onset GC. This finding is in agreement with the observation of a direct correlation between CKB expression and methylation and rein-forces that further investigation are still necessary to understand the role ofCKBmethylation in gastric carcinogenesis. However,CKBmethylation might contribute to GC cell migration and invasion.
In conclusion, our study provides a basis for the development of a biomarker for the prog-nosis of GC. Expression of SRC, LYN and CKB in gastric cancer is significantly associated with tumor invasion and lymph node and distant metastases, as well as with MYC expression, which is also a possible biomarker for GC. In addition, these three kinases appear to be regu-lated, at least in part, by DNA methylation in GC. SRC, LYN and CKB proteins or DNA
Kinases Expression and Methylation in Gastric Cancer
methylation could serve as markers for predicting tumor progression and target in anti-cancer strategies.
Supporting Information
S1 Fig. Schematic flowchart of the study design.GC: gastric cancer samples; FFPE: formalin-fixed and paraffin-embedded; EBV: Epstein-Barr virus; IHC: immunohistochemistry; HP: Heli-cobacter pylori; WB: Western blot; MSP: methylation-specific PCR; BSP: bisulfite sequencing PCR; RT-qPCR: reverse transcription quantitative PCR.
(TIF)
S2 Fig. Association between DNA methylation pattern by methylation-specific PCR and kinases expression.A) SRC immunoreactivity; B) SRC protein expression; C) SRC mRNA expression; D) LYN protein immunoreactivity; E) LYN protein expression; F) LYN mRNA expression; G) CKB immunoreactivity; H) CKB protein expression; I) CKB mRNA expression. Protein and mRNA expression were determined by Western-blot and RT-qPCR analysis, respectively. In these analyses, the expression in gastric tumors was normalized by matched non-neoplastic gastric tissue.Significant difference between groups by
χ2 (for analysis
involv-ing IHC data) or Mann-Whitney tests followed by Bonferroni corrections for multiple compari-son analysis (p<0.0167);Significant difference between groups byχ2 (for analysis involving
IHC data) or Mann-Whitney tests followed by Bonferroni corrections for multiple comparison analysis (p<0.001). IHC+: cases presenting protein immunoreactivity; IHC–: cases without
protein immunoreactivity. (TIF)
S1 File. Screening of kinases using capture compound mass spectrometry. (DOCX)
S1 Table. Kinases in gastric cancer by capture compound methodology. (DOCX)
S2 Table. Clinicopathological variables and kinases methylation pattern by methylation-specific PCR in gastric cancer.
(DOCX)
Author Contributions
Conceived and designed the experiments: MFL JAR MCS RRB. Performed the experiments: AAM MFL GRP LML APNNA BNB. Analyzed the data: AAM MFL JAR RRB. Contributed reagents/materials/analysis tools: JAR LML RCM PPA BNB MCS RRB. Wrote the paper: AAM MFL MCS RRB. Contributed with sample collection: AAM RCM PPA.
References
1. Parkin DM, Bray F, Ferlay J, Pisani P. Global cancer statistics, 2002. CA Cancer J Clin. 2005; 55(2):
74–108. PMID:15761078
2. Kimura Y, Noguchi T, Kawahara K, Kashima K, Daa T, Yokoyama S. Genetic alterations in 102 primary gastric cancers by comparative genomic hybridization: gain of 20q and loss of 18q are associated with tumor progression. Mod Pathol. 2004; 17(11): 1328–1337. PMID:15154013
3. Hanahan D, Weinberg RA. Hallmarks of cancer: the next generation. Cell. 2011; 144(5): 646–674. doi:
10.1016/j.cell.2011.02.013PMID:21376230
4. Rask-Andersen M, Zhang J, Fabbro D, Schioth HB. Advances in kinase targeting: current clinical use and clinical trials. Trends Pharmacol Sci. 2014; 35(11): 604–620. doi:10.1016/j.tips.2014.09.007
PMID:25312588
Kinases Expression and Methylation in Gastric Cancer
5. Koster H, Little DP, Luan P, Muller R, Siddiqi SM, Marappan S, et al. Capture compound mass spec-trometry: a technology for the investigation of small molecule protein interactions. Assay Drug Dev Technol. 2007; 5(3): 381–390. PMID:17638538
6. Dalhoff C, Huben M, Lenz T, Poot P, Nordhoff E, Koster H, et al. Synthesis of S-adenosyl-L-homocyste-ine capture compounds for selective photoinduced isolation of methyltransferases. ChemBioChem. 2010; 11(2): 256–265. doi:10.1002/cbic.200900349PMID:20049756
7. Takekura N, Yasui W, Yoshida K, Tsujino T, Nakayama H, Kameda T, et al. pp60c-src protein kinase activity in human gastric carcinomas. Int J Cancer. 1990; 45(5): 847–851. PMID:2110550
8. Masaki T, Shiratori Y, Okada H, Nishioka M, Taniguchi K, Hatanaka Y, et al. pp60c-src activation in gastric carcinoma: a preliminary study. Am J Gastroenterol. 2000; 95(3): 837–838. PMID:10710104 9. Humar B, Fukuzawa R, Blair V, Dunbier A, More H, Charlton A, et al. Destabilized adhesion in the
gas-tric proliferative zone and c-Src kinase activation mark the development of early diffuse gasgas-tric cancer. Cancer Res. 2007; 67(6): 2480–2489. PMID:17363565
10. Summy JM, Gallick GE. Src family kinases in tumor progression and metastasis. Cancer Metastasis Rev. 2003; 22(4): 337–358. PMID:12884910
11. Kim LC, Song L, Haura EB. Src kinases as therapeutic targets for cancer. Nat Rev Clin Oncol. 2009; 6 (10): 587–595. doi:10.1038/nrclinonc.2009.129PMID:19787002
12. Abram CL, Courtneidge SA. Src family tyrosine kinases and growth factor signaling. Exp Cell Res. 2000; 254(1): 1–13. PMID:10623460
13. Blake RA, Broome MA, Liu X, Wu J, Gishizky M, Sun L, et al. SU6656, a selective src family kinase inhibitor, used to probe growth factor signaling. Mol Cell Biol. 2000; 20(23): 9018–9027. PMID:
11074000
14. Calcagno DQ, Freitas VM, Leal MF, de Souza CR, Demachki S, Montenegro R, et al. MYC, FBXW7 and TP53 copy number variation and expression in gastric cancer. BMC Gastroenterol. 2013; 13: 141. doi:10.1186/1471-230X-13-141PMID:24053468
15. Calcagno DQ, Leal MF, Demachki S, Araujo MT, Freitas FW, Oliveira e Souza D, et al. MYC in gastric carcinoma and intestinal metaplasia of young adults. Cancer Genet Cytogenet. 2010; 202(1): 63–66.
doi:10.1016/j.cancergencyto.2010.05.020PMID:20804924
16. Calcagno DQ, Leal MF, Seabra AD, Khayat AS, Chen ES, Demachki S, et al. Interrelationship between chromosome 8 aneuploidy, C-MYC amplification and increased expression in individuals from northern Brazil with gastric adenocarcinoma. World J Gastroenterol. 2006; 12(38): 6207–6211. PMID:
17036397
17. Costa Raiol LC, Figueira Silva EC, Mendes da Fonseca D, Leal MF, Guimaraes AC, Calcagno DQ, et al. Interrelationship between MYC gene numerical aberrations and protein expression in individuals from northern Brazil with early gastric adenocarcinoma. Cancer Genet Cytogenet. 2008; 181(1): 31–
35. doi:10.1016/j.cancergencyto.2007.10.011PMID:18262050
18. de Souza CR, Leal MF, Calcagno DQ, Costa Sozinho EK, Borges Bdo N, Montenegro RC, et al. MYC deregulation in gastric cancer and its clinicopathological implications. PLoS One. 2013; 8(5): e64420. doi:10.1371/journal.pone.0064420PMID:23717612
19. da Costa Jde F, Leal MF, Silva TC, Andrade Junior EF, Rezende AP, Muniz JA, et al. Experimental gastric carcinogenesis in Cebus apella nonhuman primates. PLoS One. 2011; 6(7): e21988. doi:10. 1371/journal.pone.0021988PMID:21811552
20. Okamoto W, Okamoto I, Yoshida T, Okamoto K, Takezawa K, Hatashita E, et al. Identification of c-Src as a potential therapeutic target for gastric cancer and of MET activation as a cause of resistance to c-Src inhibition. Mol Cancer Ther. 2010; 9(5): 1188–1197. doi:10.1158/1535-7163.MCT-10-0002PMID:
20406949
21. Assumpcao PP, Ishak G, Chen ES, Takeno SS, Leal MF, Guimaraes AC, et al. Numerical aberrations of chromosome 8 detected by conventional cytogenetics and fluorescence in situ hybridization in indi-viduals from northern Brazil with gastric adenocarcinoma. Cancer Genet Cytogenet. 2006; 169(1): 45–
49. PMID:16875936
22. Burbano RR, Assumpcao PP, Leal MF, Calcagno DQ, Guimaraes AC, Khayat AS, et al. C-MYC locus amplification as metastasis predictor in intestinal-type gastric adenocarcinomas: CGH study in Brazil. Anticancer Res. 2006; 26(4B): 2909–2914. PMID:16886612
23. Calcagno DQ, Leal MF, Taken SS, Assumpcao PP, Demachki S, Smith Mde A, et al. Aneuploidy of
chromosome 8 and C-MYC amplification in individuals from northern Brazil with gastric adenocarci-noma. Anticancer Res. 2005; 25(6B): 4069–4074. PMID:16309200
24. Leal MF, Martins do Nascimento JL, da Silva CE, Vita Lamarao MF, Calcagno DQ, Khayat AS, et al. Establishment and conventional cytogenetic characterization of three gastric cancer cell lines. Cancer Genet Cytogenet. 2009; 195(1): 85–91. doi:10.1016/j.cancergencyto.2009.04.020PMID:19837275
Kinases Expression and Methylation in Gastric Cancer
25. Lima EM, Rissino JD, Harada ML, Assumpcao PP, Demachki S, Guimaraes AC, et al. Conventional cytogenetic characterization of a new cell line, ACP01, established from a primary human gastric tumor. Braz J Med Biol Res. 2004; 37(12): 1831–1838. PMID:15558189
26. Donato NJ, Wu JY, Stapley J, Gallick G, Lin H, Arlinghaus R, et al. BCR-ABL independence and LYN kinase overexpression in chronic myelogenous leukemia cells selected for resistance to STI571. Blood. 2003; 101(2): 690–698. PMID:12509383
27. Su N, Peng L, Xia B, Zhao Y, Xu A, Wang J, et al. Lyn is involved in CD24-induced ERK1/2 activation in colorectal cancer. Mol Cancer. 2012; 11: 43. doi:10.1186/1476-4598-11-43PMID:22731636
28. Elsberger B, Fullerton R, Zino S, Jordan F, Mitchell TJ, Brunton VG, et al. Breast cancer patients' clini-cal outcome measures are associated with Src kinase family member expression. Br J Cancer. 2010; 103(6): 899–909. doi:10.1038/sj.bjc.6605829PMID:20717116
29. Zardan A, Nip KM, Thaper D, Toren P, Vahid S, Beraldi E, et al. Lyn tyrosine kinase regulates androgen receptor expression and activity in castrate-resistant prostate cancer. Oncogenesis. 2014; 3: e115. doi: 10.1038/oncsis.2014.30PMID:25133482
30. Bundela S, Sharma A, Bisen PS. Potential therapeutic targets for oral cancer: ADM, TP53, EGFR, LYN, CTLA4, SKIL, CTGF, CD70. PLoS One. 2014; 9(7): e102610. doi:10.1371/journal.pone.0102610 PMID:25029526
31. Qayyum T, McArdle PA, Lamb GW, Jordan F, Orange C, Seywright M, et al. Expression and prognostic significance of Src family members in renal clear cell carcinoma. Br J Cancer. 2012; 107(5): 856–863.
doi:10.1038/bjc.2012.314PMID:22814579
32. Guan H, Zhou Z, Gallick GE, Jia SF, Morales J, Sood AK, et al. Targeting Lyn inhibits tumor growth and metastasis in Ewing's sarcoma. Mol Cancer Ther. 2008; 7(7): 1807–1816. doi:10.1158/1535-7163.
MCT-08-0058PMID:18644993
33. Prabhu JS, Korlimarla A, Banerjee A, Wani S, K P, Sahoo R. Gene-specific methylation: potential mark-ers for colorectal cancer. Int J Biol Markmark-ers. 2009; 24(1): 57–62. PMID:19404924
34. Patel N, Black J, Chen X, Marcondes AM, Grady WM, Lawlor ER, et al. DNA methylation and gene expression profiling of ewing sarcoma primary tumors reveal genes that are potential targets of epige-netic inactivation. Sarcoma. 2012; 2012: 498472. PMID:23024594
35. Hoshino K, Quintas-Cardama A, Yang H, Sanchez-Gonzalez B, Garcia-Manero G. Aberrant DNA methylation of the Src kinase Hck, but not of Lyn, in Philadelphia chromosome negative acute lympho-cytic leukemia. Leukemia. 2007; 21(5): 906–911. PMID:17344919
36. Szyf M. DNA methylation signatures for breast cancer classification and prognosis. Genome Med. 2012; 4(3): 26. doi:10.1186/gm325PMID:22494847
37. Wallimann T, Hemmer W. Creatine kinase in non-muscle tissues and cells. Mol Cell Biochem. 1994; 133–134: 193–220. PMID:7808454
38. Warburg O. On the origin of cancer cells. Science. 1956; 123(3191): 309–314. PMID:13298683 39. Cairns RA, Harris IS, Mak TW. Regulation of cancer cell metabolism. Nat Rev Cancer. 2011; 11(2): 85–
95. doi:10.1038/nrc2981PMID:21258394
40. Leal MF, Chung J, Calcagno DQ, Assumpcao PP, Demachki S, da Silva ID, et al. Differential proteomic analysis of noncardia gastric cancer from individuals of northern Brazil. PLoS One. 2012; 7(7): e42255. doi:10.1371/journal.pone.0042255PMID:22860099
41. Nair NG, Blessantoli M, Vennila J. Gene Expression in Gastric Cancer for Singapore and UK Popula-tion: An Insilico Comparative Approach. Res J Recent Sci. 2014; 3: 7.
42. Cui J, Chen Y, Chou WC, Sun L, Chen L, Suo J, et al. An integrated transcriptomic and computational analysis for biomarker identification in gastric cancer. Nucleic Acids Res. 2011; 39(4): 1197–1207. doi:
10.1093/nar/gkq960PMID:20965966
43. Eftang LL, Esbensen Y, Tannaes TM, Blom GP, Bukholm IR, Bukholm G. Up-regulation of CLDN1 in gastric cancer is correlated with reduced survival. BMC Cancer. 2013; 13: 586. doi: 10.1186/1471-2407-13-586PMID:24321518
44. Ishikawa J, Taniguchi T, Takeshita A, Maekawa M. Increased creatine kinase BB activity and CKB mRNA expression in patients with hematologic disorders: relation to methylation status of the CKB pro-moter. Clin Chim Acta. 2005; 361(1–2): 135–140. PMID:15996648
45. Lauren P. The Two Histological Main Types of Gastric Carcinoma: Diffuse and So-Called Intestinal-Type Carcinoma. an Attempt at a Histo-Clinical Classification. Acta Pathol Microbiol Scand. 1965; 64: 31–49. PMID:14320675
46. Washington K. 7th edition of the AJCC cancer staging manual: stomach. Ann Surg Oncol. 2010; 17 (12): 3077–3079. doi:10.1245/s10434-010-1362-zPMID:20882416
Kinases Expression and Methylation in Gastric Cancer