Are There Differences in Zonal Distribution and Tumor Volume
of Prostate Cancer in Patients with a Positive Family History?
Wade J. Sexton, Philippe E. Spiess, Louis L. Pisters, Scott Carpenter, Lydia T. Madsen, Robin Zagone, Xuemei Wang, Patricia Troncoso
Genitourinary Oncology Program (WJS, PES), H. Lee Mofitt Cancer Center, Tampa, Florida, USA and De -partments of Urology (LLP, SC, LTM, RZ), Quantitative Sciences (XW), and Pathology (PT), The University of Texas M. D. Anderson Cancer Center, Houston, Texas, USA
ABSTRACT
Purpose: To determine if there are any differences in the zonal distribution and tumor volumes of familial and sporadic prostate cancers (PC) in men undergoing radical prostatectomy.
Material and Methods: 839 patients underwent a radical prostatectomy in the absence of prior neoadjuvant therapy between 1987 and 1996. Telephone interviews were conducted to obtain an updated family history. A positive family history was deined as the diagnosis of PC in at least one irst degree relative. Prostatectomy specimens were examined to determine the number of tumor foci, zonal origin of the dominant tumor focus, tumor volume of the largest cancer focus, total tumor volume, Gleason score and stage, and the surgical margin status. Results were stratiied according to family history and ethnicity.
Results: We successfully contacted 437 patients (52%). Prostatectomy specimens from 55 patients were excluded from review due to a history of prior transurethral resection of the prostate
(n = 26) or uncertain pathological stage (n = 29). Of the remaining 382 patients, 76 (20%) reported having a irst-degree relative with PC. Statistical analysis revealed no signiicant differences in the pathologic variables between the two groups of patients with or without a family history of PC.
Conclusions: Familial and sporadic PC share similar characteristics. No histopathological differences account for the increased positive predictive value of PC screening tests among patients with a family history of PC.
Key words: prostatic neoplasms; tumor burden; family characteristics; tumor volume; pathology Int Braz J Urol. 2010; 36: 571-82
doi: 10.1590/S1677-55382010000500007
INTRODUCTION
The reported rate of positive family history among men with prostate cancer (PC) ranges from 13% to 26% and approaches 40% for men diagnosed with the disease before age 55 (1-3). Detection of cancer in multiple first-degree or second-degree relatives coupled with early age at cancer diagnosis
substantially increases a man’s relative risk and ab -solute risk of developing PC (4).
disease-free survival (DFS) and overall survival (5-9). Very little information is available on the zonal distribution of cancers in patients with a positive family history. Furthermore, there are no pathologic data that explain the increased positive-predictive value reported for abnormal digital rectal examination (DRE) and pros-tate-speciic antigen (PSA) tests in high-risk patients, such as those with a positive family history (10,11). We as well do not currently know if there exist dif -ferences in terms of tumor volumes between patients with and without a family history of PC?
We hypothesized that RP specimens from patients with a family history of PC might reveal dif -ferent tumor characteristics compared with specimens from patients with sporadic PC and that the different characteristics could account for the higher diagnostic yield of prostate biopsies performed in patients with risk factors for disease. To address this hypothesis, we speciically examined the zonal distribution of cancer foci, tumor location, and tumor volume differences of our surgically managed patients with and without a family history of PC. We also analyzed corresponding clinicopathologic data, such as age, preoperative PSA levels, pathologic stage, Gleason score, and surgical margin status in patient groups stratiied by family history.
MATERIALS AND METHODS
A research protocol was designed and ap -proved by our Institutional Review Board prior to the initiation of this study. From January 1987 to December 1996, 839 patients underwent RP at The University of Texas M. D. Anderson Cancer Center, with no prior neoadjuvant therapy. The patients were followed for at least 6 years from the time of RP. Family history data were obtained by telephone interview to update the patient’s ile and to capture additional family members affected with PC since the index patient’s surgical procedure. The patients and immediate family members who were success -fully contacted were included in the study. Positive family history was deined as having at least 1 irst-degree relative (e.g., brother, son, father) who had a diagnosis of PC. Only a few patients with possible hereditary prostate cancer (HPC) were included in
the analysis. HPC is believed to be transmitted in an autosomal dominant fashion, and it is postulated that HPC accounts for 5% to 10% of all cases of PC (and possibly 30% to 45% of early onset cancers). To be classiied as having HPC, patients had to fulill one of the following clinical criteria: PC occurring in 3 successive generations (maternal or paternal side), 3 cases of PC diagnosed within a nuclear family, or 2 men within a single family diagnosed with PC before age 55 (4,12).
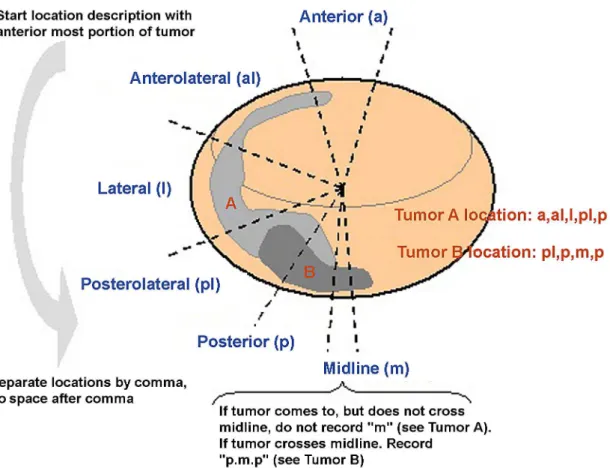
The prostatectomy specimens were evaluated as previously reported (13,14). Each tumor focus was outlined on the histologic sections, and the total num -ber of tumor foci as well as the zonal origin of each tumor focus were recorded. Zones were categorized as peripheral zone (PZ), transition zone (TZ), or multiple zones (MZ). An area of carcinoma was considered a different focus if it was separated by a low-power ield diameter (4.5 mm) from the nearest adjacent focus, as reported previously (15). Tumor location was recorded according to standardized guidelines (Figure-1). Each tumor focus was graded according to the Gleason grad -ing system (16). The Gleason score assigned to the specimen was that of the tumor focus with the highest Gleason score. The volume of each tumor focus was calculated according to the three-dimensional volume estimation method (17). The 2002 American Joint Committee on Cancer tumor-node-metastasis staging system was used to deine organ-conined cancers (T2), established extraprostatic extension (T3a), and cancer involvement of the seminal vesicles (T3b). Patients with positive margins without extraprostatic extension were categorized as having T2 tumors regardless of margin status.
1
pr(��ι = 1|xι) = _________________________ for m = 1
1 + Σj
j=2 exp(xιβj) exp(xιβm)
pr(��ι = m|xι) = ________________________ for m > 1
1 + Σ 1 + Σj
j=2 exp(xιβj)
where yi is the response variable for subject i, and can take values of 1, 2, …, m. In our case, the site of dominant tumor focus could be “P”, “T” or “M”; therefore, m = 3. Xi is vector of covariates for subject i (here, are family history and ethnicity) and βj is the
vector of coeficient, with j ranges from 2 to J. Note: J = m. All statistical analyses were carried out in SAS or Splus software program.
RESULTS
Patient Characteristics
transurethral prostatectomy (n = 26), uncertain or
missing pathologic data (n = 29), leaving 382 patients with complete clinical and pathologic data. Seventeen patients (4%) were believed to have HPC on the basis
Table 1 – Demographic and clinical characteristics.
Variable Negative FHx
(N = 306)
Positive FHx
(N = 76)
p Value
Age 63.2 (42.3 - 74.7) 62.8 (46.7 - 72.2) 0.43
% >= 60 years 207 (67.6%) 49 (64.5%) 0.70
Total Tumor volume 1.64 (0.02 - 17.44) 1.72 (0.04 - 9.56) 0.27
Tumor volume of largest cancer focus 1.20 (0.02 - 14.40) 1.36 (0.04 - 7.68) 0.44
Prostate Weight (g) 40 (10 - 141) 40 (18 - 95) 0.90
Total tumor volume/ Prostate Weight 0.038 (0.00046 - 0.31) 0.044 (0.0005 - 0.25) 0.27
Ethnicity 0.61
Caucasian 266 (86.9%) 70 (92.1%)
African American 23 (7.5%) 4 (5.3%)
Hispanic 15 (4.9%) 2 (2.6%)
Other 2 (0.7%) 0 (0.0%)
Diagnostic PSA 7.5 (0.7 - 55.0) 7.6 (1.3 - 30.1) 0.50
Pathologic Gleason Score 0.13
5,6 31 (10.1%) 14 (18.4%)
7 190 (62.1%) 42 (55.3%)
8,9 85 (27.8%) 20 (26.3%)
Pathologic Stage 0.44
T2 209 (68.3%) 46 (60.5%)
T3a 74 (24.2%) 23 (30.3%)
T3b 23 (7.5%) 7 (9.2%)
Surgical Margins 0.52
Negative 231 (75.5%) 54 (71.1%)
Positive 75 (24.5%) 22 (28.9%)
of the aforementioned clinical criteria. Table-1 lists clinical information and demographics of the patients with and without a family history of PC. There was no difference in any of the clinical or pathologic features including total tumor volume and tumor volume of the largest tumor focus among patients with and without a family history of PC. Table-2 characterizes the af-fected family members in familial prostate cancer and hereditary prostate cancer cases.
Association between Family History, Ethnicity,
and Pathologic Features
The association between family history of PC and pathologic stage was evaluated in Caucasian and other ethnicities (Table-3). No signiicant association was detected in either Caucasian (p = 0.46) or African American patients (p = 0.18). To further clarify the potential association between location of the largest cancer foci and ethnicity, we assessed the location
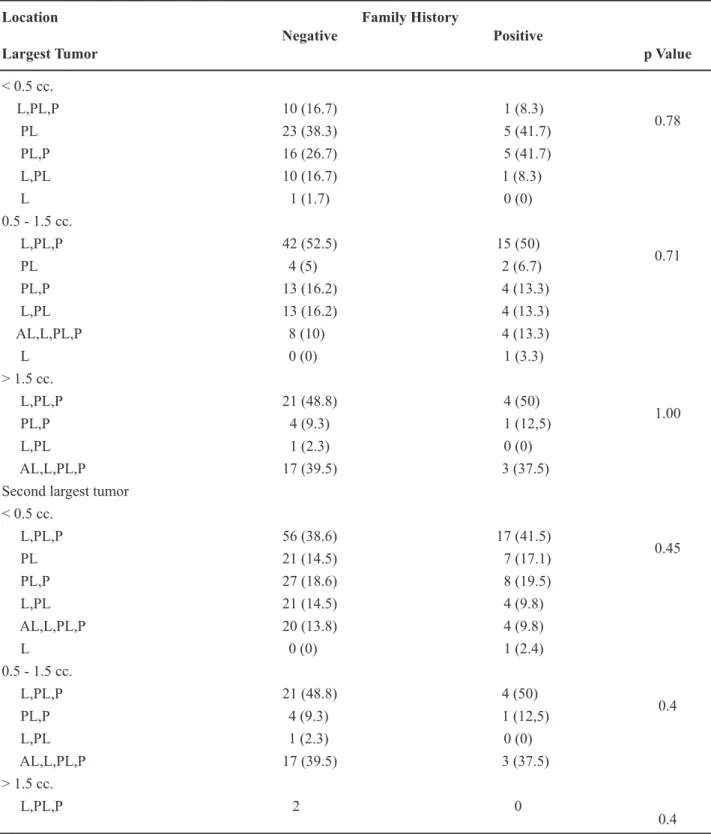
of cancer foci by familial history of prostate cancer (Table-4). We were unable to show an association between the location of the largest cancer focus and familial history of prostate cancer, with substratiica-tion of the volume of the largest cancer focus (< 0.5 cc, 0.5 to 1.5 cc, and > 1.5 cc). Similarly, we attempted to determine if there was an association between the location of the second largest cancer focus and family history of prostate cancer (Table-4), with no statisti-cally signiication association noted. Table-5 shows the location of the dominant tumor focus according to the patient’s reported family history and race. Positive family history of PC did not signiicantly impact (p = 0.73) the dominant tumor focus. On multinomial logistic regression analysis, the lack of association between ethnicity and site of dominant tumor focus was preserved (Tables 6 and 7). Furthermore, we com -pared the number of tumor foci based on either family history or ethnicity (Table-8). The mean and median number of tumor foci did not show a signiicant dif-ference based on family history of PC or ethnicity.
Table 2 – Characterization of affected family members in familial prostate caner cases (includes possible hereditary
cancers).
Affected Relatives in Index Patients with 1st Degree Family History (N = 76)
One Relative (N = 59) Number of Affected Relatives
Father 33
Brother 25
Son 1
Two Relatives (N = 15) Father, Brother 5
Father, Grandfather 5
Brother, Brother 4
Brother, Grandfather 1
Four Relatives (N = 2) Brothers (x4) 2 Categories of Possible Hereditary Prostate Cancer (n = 17)
Number of Cases At least three men within same nuclear family 11
Three successive generations 5
COMMENTS
Most physicians recommend early screen -ing for PC in populations at high risk for the disease. High-risk populations include men with a positive family history of PC and African American men (18). The risk is even greater for men with multiple risk factors or for those whose affected relatives were diagnosed with cancer at younger ages (less than 55-60 years of age) (4).
Several studies have sought the patterns of RP pathology that could be unique to patients with a family history of PC. Studies have focused on the number of tumors, Gleason score, pathologic stage, and biochemical DFS and cancer-speciic survival rates (1,5-9). However, there is very little informa-tion about the zonal distribuinforma-tion of prostate cancer in patients with a positive family history. Similarly, tumor volume has been shown to be an independent predictor of biochemical failure yet there is little to no information on the association between either tumor volume (either total or of the dominant focus of prostate cancer) among patients with or without a family history of PC (13,19).
Prostate cancer is characterized as a multifo -cal disease, and the majority of cancers are located in the PZ area most commonly targeted and sampled during prostate biopsies. Catalona et al. (10) reported that there is a higher positive predictive value of PC screening tests (PSA and DRE) for detecting PC in
patients with established risk factors such as family history and African American ethnicity while con -trolling for both age and PSA. It seems intuitive that prostatectomy specimens from patients with risk fac -tors for disease might contain more dominant tumor foci located peripherally in targeted biopsy zones, a greater number of tumor foci, or a greater percent -age of cancer per prostate specimen to account for the signiicantly higher yield of prostate biopsies. However, our pathology results do not support the hypothesis that differences in the zonal origin of the dominant tumor focus or differences in the number of tumor foci could account for higher cancer detection rates in patients with PC risk factors. There were no signiicant differences in the mean number of tumor foci based on family history or on ethnicity. Most dominant tumor foci were located peripherally and family history did not alter the distribution of the dominant tumor foci between the PZ, TZ, or MZ. Contrary to family history status, when the locations of the dominant tumor foci were stratiied according to ethnicity, non-Caucasians were demonstrated to have more dominant tumor foci originating within the transition zone compared to Caucasian patients.
In an attempt to clarify if the location of the largest and second largest tumor foci were different based on family history of PC, we were unable to iden -tify an association between site of these predominant tumor foci and familial history of PC. This may have had important clinical implications in terms of the
Table 3 – Pathologic T stage stratiied by family history and ethnicity.
Ethnicity Pathologic T-stage Negative Family History Positive Family History p Value
Caucasian 0.46
T2 180 (67.7%) 42 (60.0%)
T3a 65 (24.4%) 22 (31.4%)
T3b 21 (7.9%) 6 (8.6%)
African American 0.18
T2 16 (69.6%) 3 (75.0%)
T3a 6 (26.1%) 0 (0.0%)
T3b 1 (4.3%) 1 (25.0%)
Table 4 – The association between location of tumor foci and family history within patients having largest tumor and
second largest tumor less than 0.5 cc, between 0.5 cc and 1.5 cc, and greater than 1.5 cc.
Location Family History
Largest Tumor
Negative Positive
p Value
< 0.5 cc.
L,PL,P 10 (16.7) 1 (8.3)
0.78
PL 23 (38.3) 5 (41.7)
PL,P 16 (26.7) 5 (41.7)
L,PL 10 (16.7) 1 (8.3)
L 1 (1.7) 0 (0)
0.5 - 1.5 cc.
L,PL,P 42 (52.5) 15 (50)
0.71 PL 4 (5) 2 (6.7)
PL,P 13 (16.2) 4 (13.3)
L,PL 13 (16.2) 4 (13.3)
AL,L,PL,P 8 (10) 4 (13.3) L 0 (0) 1 (3.3) > 1.5 cc.
L,PL,P 21 (48.8) 4 (50)
1.00
PL,P 4 (9.3) 1 (12,5)
L,PL 1 (2.3) 0 (0)
AL,L,PL,P 17 (39.5) 3 (37.5)
Second largest tumor < 0.5 cc.
L,PL,P 56 (38.6) 17 (41.5)
0.45
PL 21 (14.5) 7 (17.1)
PL,P 27 (18.6) 8 (19.5)
L,PL 21 (14.5) 4 (9.8)
AL,L,PL,P 20 (13.8) 4 (9.8)
L 0 (0) 1 (2.4) 0.5 - 1.5 cc.
L,PL,P 21 (48.8) 4 (50)
0.4 PL,P 4 (9.3) 1 (12,5)
L,PL 1 (2.3) 0 (0)
AL,L,PL,P 17 (39.5) 3 (37.5)
> 1.5 cc.
L,PL,P 2 0
0.4
Table 6 –Fitted multinomial logistic regression model for zone distribution.
Parameter Zone Estimate Standard
Error
Probability > Chi Sq Point Estimate 95% CI
Intercept TZ -1.4944 0.1536 < 0.0001 Intercept MZ -4.0096 0.4906 < 0.0001
FH (pos vs. neg) TZ -0.3282 0.3590 0.36 0.72 0.356-1456 FH (pos. vs. neg) MZ -0.2464 1.1066 0.82 0.78 0.089-6.838 Black vs. Others TZ 0.9050 0.4364 0.04 2.47 1.051-5.815 Black vs. Others MZ 1.2126 1.1246 0.28 3.36 0.371-30.468
FH = family history; MZ = multiple zones; TZ = transition zone.
Table 5 – Site of dominant tumor focus stratiied by family history and ethnicity.
Dominant Tumor Focus
PZ TZ MZ p Value
Family History 0.73
Negative 242 (79.1%) 59 (19.3%) 5 (1.6%)
Positive 64 (84.2%) 11 (14.5%) 1 (1.3%)
Ethnicity 0.06
Caucasian 275 (81.8%) 56 (16.7%) 5 (1.5%) All Others 31 (67.4%) 14 (30.4%) 1 (2.2%)
African American 17 (63.0%) 9 (33.3%) 1 (3.7%) 0.04 All Others 289 (81.4%) 61 (17.2%) 5 (1.4%)
PZ = peripheral zone; TZ =transition zone; MZ = multiple zones.
transrectal ultrasound guided prostatic biopsy schemes to apply to patients based on familial history of PC. However, due to the lack of an association between the site of the largest and second largest tumor focus and family history of PC, an extensive biopsy scheme consisting of 10 to 12 biopsy cores should be obtained in all patients in whom prostatic biopsies are clinically indicated.
Racial variation in the location of dominant tumor foci has been reported previously. Pettaway and colleagues found that 35% of all tumor foci in African American men were of TZ origin compared with 21% of the tumor foci in a group of Caucasian patients matched according to pathologic stage. In this same study, the median number of tumor foci
and the overall prostatic tumor volumes (stratiied by pathologic stage and zone of origin of the cancers) were not statistically different (20). Pettaway et al. hypothesized that the TZ epithelium in African Ameri -can patients might be more susceptible to malignant transformation compared with the TZ epithelium of Caucasian men (20).
Table 7 –Fitted multinomial logistic regression model for zone distribution.
Parameter Zone Estimate Standard
Error
Probability > Chi Sq Point Estimate 95% CI
Intercept TZ -1.5327 0.1598 < .0001 Intercept MZ -3.9581 0.4924 < .0001
FH (pos vs. neg) TZ -0.3054 0.3595 0.40 0.737 0.364-1.491
FH (pos. vs. neg) MZ -0.2503 1.1069 0.82 0.779 0.089-6.815
Non-White vs. White TZ 0.7756 0.3548 0.03 2.172 1.083-4.354
Non-White vs. White MZ 0.5559 1.1140 0.62 1.743 0.196-15.477
FH = family history; MZ = multiple zones; TZ = transition zone.MZ = multiple zones; TZ = transition zone.
Table 8 –Mean number of tumor foci stratiied by family history and ethnicity.
Number of Tumor Foci
Mean Median (range) p Value
Family History
Negative 3.31 3 (1 - 10) 0.55
Positive 3.18 3 (1 - 8)
Ethnicity
Caucasian 3.27 3 (1 - 10) 0.32
All others 3.41 3 (1 - 7)
African American 3.52 3 (1 - 7) 0.29
All others 3.27 3 (1 - 10)
gland compared with a mean 5.2 tumor foci per gland in the familial PC group. On the contrary, patients with familial PC had a larger volume of cancer per gland compared with the sporadic PC group (3.3 cm3
vs. 2.4 cm3). However, these results failed to reach
statistical signiicance likely due to the small number of patients in each of the three groups.
Although patients with a positive family history of PC are at higher risk of developing the disease, most studies suggest that these patients have either equivalent (12) or more favorable disease char -acteristics, such as lower Gleason scores (1,7,21) or less extracapsular tumor extension (9). Furthermore, there is no convincing evidence that survival is better or worse for patients with a positive family history of PC undergoing RP (5,8,9) or primary radiation therapy (22) compared to patients with sporadic PC.
PC compared to patients without a family history of PC in terms of age, preoperative PSA, Gleason score, pathologic stage, and surgical margin status. We did not examine disease-speciic or biochemical DFS. Based on the pathologic results from both patient groups, it is unlikely that there would be meaningful differences in these outcome measures.
Several potential biases with this study de-serve mention. Although our data were stratiied ac-cording to ethnicity, few non-Caucasian patients were included in the overall analysis. Patients included in this study all underwent RP. Thus, our population may not represent the full spectrum of familial and spo -radic PC. Other potential risk factors, such as obesity and diet, may signiicantly affect cancer initiation, promotion, and progression, and were not accounted for in this analysis (24,25). Regarding family history, we did not conirm reported positive family histories with pathology reports of affected relatives. Neither were we able to accurately determine the exact age of most of the affected family members at the time of their own diagnosis. However, recognizing some of these potential biases at study onset, we did not rely on medical record family history data for study inclusion, thus excluding nearly half of the patients undergoing RP during the study period. We attempted to clarify and update family history data via telephone interviews with the patients or with their immediate family members. However, an accurate assessment of the signiicance of family history related to the devel-opment of PC will be limited as long as the deinition of a positive family history is based on clinical criteria and not on molecular ingerprints or biomarkers that might establish a true familial link to PC among af -fected individuals.
CONCLUSIONS
Patients with familial and sporadic PC have pathologically and morphologically similar tumors. In our study group, there were no clinically signiicant differences in the zonal origin and location of the dominant tumor foci, tumor volume, or number of tumor foci to account for the reported increased posi -tive predic-tive value of diagnostic screening tests in patients with a family history of PC.
ACkNOWLEDgEMENTS
We thank Cindy Soto BS, HT (ASCP) and Ina Prokhorova, MD, HT, HTL (ASCP) for expert technical assistance with the pathologic specimens, Brooke Reynolds for assistance in preparation of the manuscript, and Kim Vu for assistance in preparation of the illustrations.
CONFLICT OF INTEREST
None declared.
REFERENCES
1. Keetch DW, Humphrey PA, Smith DS, Stahl D, Cata-lona WJ: Clinical and pathological features of heredi-tary prostate cancer. J Urol. 1996; 155: 1841-3. 2. Bratt O, Kristoffersson U, Lundgren R, Olsson H:
Familial and hereditary prostate cancer in southern Sweden. A population-based case-control study. Eur J Cancer. 1999; 35: 272-7.
3. Carter BS, Beaty TH, Steinberg GD, Childs B, Walsh PC: Mendelian inheritance of familial prostate cancer. Proc Natl Acad Sci U S A. 1992; 89: 3367-71. 4. Bratt O: Hereditary prostate cancer: clinical aspects.
J Urol. 2002; 168: 906-13.
5. Azzouzi AR, Valeri A, Cormier L, Fournier G, Mangin P, Cussenot O: Familial prostate cancer cases before and after radical prostatectomy do not show any ag-gressiveness compared with sporadic cases. Urology. 2003; 61: 1193-7.
6. Kupelian PA, Kupelian VA, Witte JS, Macklis R, Klein EA: Family history of prostate cancer in patients with localized prostate cancer: an independent predictor of treatment outcome. J Clin Oncol. 1997; 15: 1478-80.
7. Kotsis SV, Spencer SL, Peyser PA, Montie JE, Cooney KA: Early onset prostate cancer: predictors of clinical grade. J Urol. 2002; 167: 1659-63.
8. Grönberg H, Damber L, Tavelin B, Damber JE: No difference in survival between sporadic, familial and hereditary prostate cancer. Br J Urol. 1998; 82: 564-7. 9. Norrish AE, McRae CU, Cohen RJ, Jackson RT: A
10. Catalona WJ, Antenor JA, Roehl KA, Moul JW. Screening for prostate cancer in high risk populations. J Urol. 2002; 168: 1980-3; discussion 1983-4. 11. Aprikian AG, Bazinet M, Plante M, Meshref A, Trudel
C, Aronson S, et al.: Family history and the risk of prostatic carcinoma in a high risk group of urological patients. J Urol. 1995; 154: 404-6.
12. Carter BS, Bova GS, Beaty TH, Steinberg GD, Childs B, Isaacs WB, et al.: Hereditary prostate cancer: epi -demiologic and clinical features. J Urol. 1993; 150: 797-802.
13. Babaian RJ, Troncoso P, Steelhammer LC, Lloreta-Trull J, Ramirez EI: Tumor volume and prostate speciic antigen: implications for early detection and deining a window of curability. J Urol. 1995; 154: 1808-12.
14. Sanchez-Ortiz RF, Troncoso P, Babaian RJ, Lloreta J, Johnston DA, Pettaway CA: African-American men with nonpalpable prostate cancer exhibit greater tumor volume than matched white men. Cancer. 2006; 107: 75-82.
15. Troncoso P, Babaian RJ, Ro JY, Grignon DJ, von Eschenbach AC, Ayala AG: Prostatic intraepithelial neoplasia and invasive prostatic adenocarcinoma in cystoprostatectomy specimens. Urology. 1989; 34(6 Suppl): 52-6.
16. Gleason D: Histologic grading and clinical staging of prostate carcinoma. In: Tannenbaum M (ed.), Urologic Pathology. The Prostate. Philadelphia, Lea & Febiger. 1977: pp. 171-97.
17. Chen ME, Johnston D, Reyes AO, Soto CP, Babaian RJ, Troncoso P: A streamlined three-dimensional volume estimation method accurately classiies pros-tate tumors by volume. Am J Surg Pathol. 2003; 27: 1291-301.
18. Crawford ED: Epidemiology of prostate cancer. Urol-ogy. 2003; 62(6 Suppl1): 3-12.
19. Nelson BA, Shappell SB, Chang SS, Wells N, Farnham SB, Smith JA Jr, et al.: Tumour volume is an indepen-dent predictor of prostate-speciic antigen recurrence in patients undergoing radical prostatectomy for clinically localized prostate cancer. BJU Int. 2006; 97: 1169-72.
20. Pettaway CA, Troncoso P, Ramirez EI, Johnston DA, Steelhammer L, Babaian RJ: Prostate speciic antigen and pathological features of prostate cancer in black and white patients: a comparative study based on radical prostatectomy specimens. J Urol. 1998; 160: 437-42.
21. Bastacky SI, Wojno KJ, Walsh PC, Carmichael MJ, Epstein JI: Pathological features of hereditary prostate cancer. J Urol. 1995; 153: 987-92.
22. Ray ME, Dunn RL, Cooney KA, Sandler HM: Family history of prostate cancer and relapse after deinitive external beam radiation therapy. Int J Radiat Oncol Biol Phys. 2003; 57: 371-6.
23. Narod SA, Dupont A, Cusan L, Diamond P, Gomez JL, Suburu R, et al.: The impact of family history on early detection of prostate cancer. Nat Med. 1995; 1: 99-101.
24. Amling CL, Riffenburgh RH, Sun L, Moul JW, Lance RS, Kusuda L, et al.: Soderdahl DW, Donahue TF, Foley JP, Chung AK, McLeod DG. Pathologic vari-ables and recurrence rates as related to obesity and race in men with prostate cancer undergoing radical prostatectomy. J Clin Oncol. 2004; 22: 439-45. 25. Rohrmann S, Roberts WW, Walsh PC, Platz EA:
Fam-ily history of prostate cancer and obesity in relation to high-grade disease and extraprostatic extension in young men with prostate cancer. Prostate. 2003; 55: 140-6.
Accepted after revision: March 17, 2010
Correspondence address: Dr. Wade J. Sexton
Genitourinary Oncology Program Mofitt Cancer Center
12902 Magnolia Drive
Tampa, Florida, 33612-9416, USA Fax: + 1 81 3745-8494
EDITORIAL COMMENT
This study revealed no signiicant differences between patients with familial histories compared with the patients without familial histories of pros -tate cancer in relation their age, preoperative PSA, Gleason score, pathological stage, and surgical status of the margin. However, important data that could be answered is related to the disease-speciic survival and biochemical disease-free survival. Otherwise, patients with familial PC had a larger volume of cancer per gland compared with the sporadic prostate cancer group - 3.3 cm3 vs. 2.4 cm3. This tumoral volume data
justiies more attention for men with a familial history of prostate cancer, since the larger the tumoral volume,
the larger the chances of biochemical recurrence. In cases of smaller tumoral volume (2.6 cc) normally the PSA is lower than 4.
REFERENCE
1. Zhu H, Roehl KA, Antenor JA, Catalona WJ: Biopsy of men with PSA level of 2.6 to 4.0 ng/mL associated with favorable pathologic features and PSA progres-sion rate: a preliminary analysis. Urology. 2005; 66: 547-51.
Dr. Marcos F. Dall’Oglio
University of Sao Paulo, USP Sao Paulo, Brazil E-mail: [email protected]REPLY BY THE AUTHORS
We agree with the editorial comments by Dr. Dall’Oglio that it would be interesting to analyze any differences in the survival characteristics (bio -chemical-free survival and disease speciic survival) of patients with sporadic prostate cancer compared to patients with a family history of prostate cancer. As discussed in the manuscript however, there is no convincing evidence to date that a positive family history impacts survival in those who have received therapy for clinically localized prostate cancer. Fur
-thermore, we found no difference in tumor volume (p = 0.27) in patients with a positive family history of prostate cancer (1.72 cm3) vs. patients with sporadic prostate cancer (1.64 cm3) as demonstrated in Table 1. Bastacky and colleagues (reference #21 in the manuscript) found a non-statistically signiicant dif-ference in the tumor volume of patients with familial prostate cancer compared to patients with sporadic prostate cancer (3.3 cm3 vs. 2.4 cm3).