www.nature.com/scientificreports
Adipose tissue dysfunction as a
central mechanism leading to
dysmetabolic obesity triggered by
chronic exposure to p,p’-DDe
Diogo pestana
1,2,3, Diana teixeira
1,2,3, Manuela Meireles
3, Cláudia Marques
1,2,3, sónia
Norberto
3, Carla sá
3, Virgínia C. Fernandes
4, Luísa Correia-sá
4, Ana Faria
1,2,3,5, Luísa
Guardão
6, João t. Guimarães
3,7, Wendy N. Cooper
8, Ionel sandovici
8, Valentina F.
Domingues
4, Cristina Delerue-Matos
4, Rosário Monteiro
3,9, Miguel Constância
8& Conceição
Calhau
1,2,3endocrine-disrupting chemicals such as p,p’-dichlorodiphenyldichloroethylene (p,p’-DDe), are bioaccumulated in the adipose tissue (At) and have been implicated in the obesity and diabetes epidemic. thus, it is hypothesized that p,p’-DDe exposure could aggravate the harm of an obesogenic context. We explored the effects of 12 weeks exposure in male Wistar rats’ metabolism and AT biology, assessing a range of metabolic, biochemical and histological parameters. p,p’-DDe -treatment exacerbated several of the metabolic syndrome-accompanying features induced by high-fat diet (HF), such as dyslipidaemia, glucose intolerance and hypertension. A transcriptome analysis comparing mesenteric visceral At (vAt) of HF and HF/DDe groups revealed a decrease in expression of nervous system and tissue development-related genes, with special relevance for the neuropeptide galanin that also revealed DNA methylation changes at its promoter region. Additionally, we observed an increase in transcription of dipeptidylpeptidase 4, as well as a plasmatic increase of the pro-inflammatory cytokine IL-1β. our results suggest that p,p’-DDE impairs vAT normal function and effectively decreases the
dynamic response to energy surplus. We conclude that p,p’-DDe does not merely accumulate in fat, but may contribute significantly to the development of metabolic dysfunction and inflammation. Our findings reinforce their recognition as metabolism disrupting chemicals, even in non-obesogenic contexts.
A combination of complex events are contributing to the current obesity epidemic and ultimately to the metabolic syndrome (MetS), a serious worldwide health threat1. Metabolic disorders such as cardiovascular diseases (CVD) and type 2 diabetes mellitus (T2D) result from alterations of metabolic pathways in several organs. They are the result of the co-occurrence of obesity (particularly central obesity), dyslipidaemia, hyperglycaemia and hyper-tension2. Amongst obese individuals, variable prevalence of cardiometabolic complications is often observed, with metabolically healthy subjects accounting for 10–25%3. A central role in unhealthy obesity, also known as dysmetabolic obesity, is attributed to visceral adipose tissue (vAT) dysfunction and inflammation, affecting
1cinteSiS - center for Health technology and Services Research, Porto, Portugal. 2nutrition & Metabolism, nOVA
Medical School|faculdade de ciências Médicas, Universidade nOVA de Lisboa, Lisboa, Portugal. 3Department of Biochemistry, faculty of Medicine, University of Porto, Porto, Portugal. 4ReQUiMte/LAQV, instituto Superior de engenharia, instituto Politécnico do Porto, Porto, Portugal. 5ReQUiMte/LAQV, Department of chemistry and Biochemistry, faculty of Sciences, University of Porto, Porto, Portugal. 6Animal House Department, faculty of Medicine, University of Porto, Porto, Portugal. 7Department of clinical Pathology, Hospital S. João, Porto, Portugal. 8University of cambridge, Metabolic Research Laboratories, MRc Metabolic Diseases Unit, Department of Obstetrics
& Gynaecology and national institute for Health Research, cambridge Biomedical Research centre, cambridge, UK. 9instituto de investigação e inovação em Saúde, Universidade do Porto, Porto, Portugal. correspondence and requests for materials should be addressed to D.P. (email: [email protected])
Received: 24 January 2017 Accepted: 19 April 2017 Published: xx xx xxxx
the dialog with other central (brain) and peripheral organs (liver, gut, muscle), but causal factors are still largely unknown3, 4.
The rate at which the prevalence of these conditions are increasing suggests that environmental and behav-ioural influences are “fuelling” the epidemic5, 6. Concerns have focused on the hypothesis that exposure to envi-ronmental endocrine-disrupting chemicals (EDCs) may be involved in the rise of obesity and MetS epidemic observed worldwide in the last 40 years. In particular, the man-made lipophilic persistent organic pollutants (POPs) with hormone-like activity (endocrine disruptors) can lead to an environmental disruption of metabolism and putative diabetogenic effect5, 7–11. POPs are bioaccumulated and biomagnified in the food chain and can be found in the adipose tissue (AT) of virtually all human populations12, functioning not only as a reservoir and a source of chronic internal exposure, but also as a possible tissue target of their disruptive effects13, 14. Due to their lipophilic nature, food consumption represents the main pathway for exposure to these contaminants, namely through ingestion of fat-containing food such as dairy products, meat and fish8, 15–17.
Recently, a series of studies concerning the burden of disease and cost analysis of exposure to EDCs revealed a likely substantial contribution to disease and dysfunction across the life course with elevated annual costs, both in the European Union and USA, emphasizing the need for evaluation of effects, better monitoring and active prevention18–20. Supporting these warnings are, among others, several epidemiological and in vivo studies that reported the positive correlation of EDCs concentrations, both in AT and plasma, with the prevalence of obesity, MetS, insulin resistance, hypertension and CVD21–23, as well as adipocyte dysfunction24.
Studies such as those developed by Ruzzin et al. where dietary supplementation with salmon oil contaminated with a mixture of POPs in conjunction with high-fat (HF) diet feeding promoted the development of obesity and T2D in a rodent model25, 26, led to the proposition of a broader metabolism disrupting chemical hypothesis where ECDs act as metabolic disruptors that increase the susceptibility to metabolic diseases7, 10, 27, 28. A recent publication reviewed the putative mechanisms of metabolic disruption28, highlighting the effects on adipogen-esis and adipokine production29, 30, neuroendocrine control of feeding and metabolism31, 32, energy homeostasis and T2D trough alteration of insulin action, glucose disposal and beta cell survival and function33, as well as hepatic steatosis34, and hyperlipidemia35. Involved molecular mechanism encompass the alteration of hormonal and homeostatic systems related to sex hormones (e.g. estrogens and androgens, thyroid function and corticoster-oids) acting through nuclear receptors, nonnuclear steroid hormone receptors, nonsteroid receptors (for example, neurotransmitter receptors), orphan receptors (such as aryl hydrocarbon receptor, AhR), endoplasmic reticulum and oxidative stress, inflammatory disruption and epigenetic changes7, 28.
In a recent paper, Gauthier et al.36 showed that the metabolically dysfunctional obese phenotype was associated with higher plasma POP levels. Results from our group in obese individuals revealed that POP levels especially in vAT, the main reservoir, were higher in subjects with evidence of metabolic abnormalities27, 37, thus comple-menting and strengthening the Gauthier study. In this context, the mechanisms by which POPs exert their effects could involve various pathways including dysregulation of hormonal systems, nuclear receptors and epigenetic processes, in addition to possible action on neurotransmitter receptors and systems38. Altogether, these mecha-nisms could ultimately interfere with AT remodeling and function with local and systemic consequences21, 24, 39. Hence, POPs stored in AT may be a key component in the pathogenesis of MetS, in synergy with lifestyle factors, to promote obesity and its associated complications, namely T2D21, 24, 40.
One of these synthetic organic chemicals is the pesticide p,p’-dichlorodiphenyldichloroethylene (p,p’-DDE), which has been associated with an increased prevalence of obesity and T2D in several epidemiological studies41, 42. However the causal relationship and specific mechanisms of action are still under discussion. This study was designed to evaluate if exposure of rats to sustained low levels of p,p’-DDE (2.5 times less than lowest-observed-adverse-effect level), either in presence or absence of a HF diet, could contribute to the appear-ance or aggravation of metabolic disorders and possible functioning as an environmental modifier between obesity subphenotypes3. For this purpose, the metabolic characterization of these rats was accompanied by a comprehensive and integrative evaluation of vAT histology, transcriptome and DNA methylation changes in key differentially expressed genes.
Results
Weight measurements and body composition.
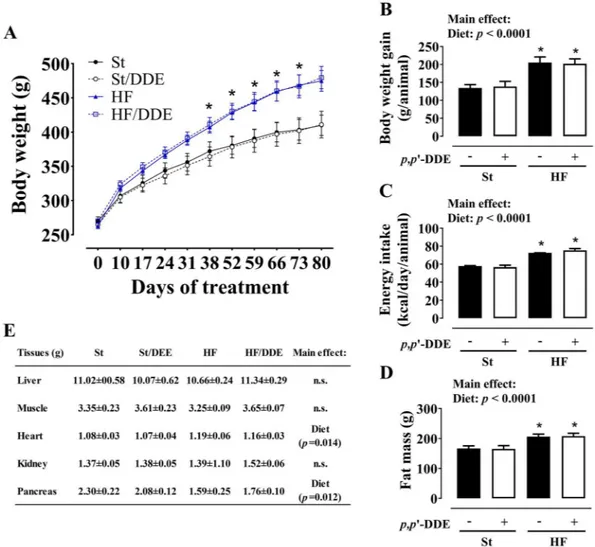
HF fed rats had a significantly accelerated growth dur-ing the treatment (Fig. 1), evident in body weight evolution, weight gain per animal and energy intake (kcal/day/ animal). Exposure to p,p’-DDE did not alter body weight profile in any of the diets. At the end of the treatment, both groups that ingested HF had significantly higher fat mass (bioelectrical impedance evaluation, p< 0.0001) and an effect in heart and pancreas (p= 0.014 and p= 0.012), respectively increasing and decreasing their weights.At - distribution, lipolysis and
p
,
p
’-DDe accumulation.
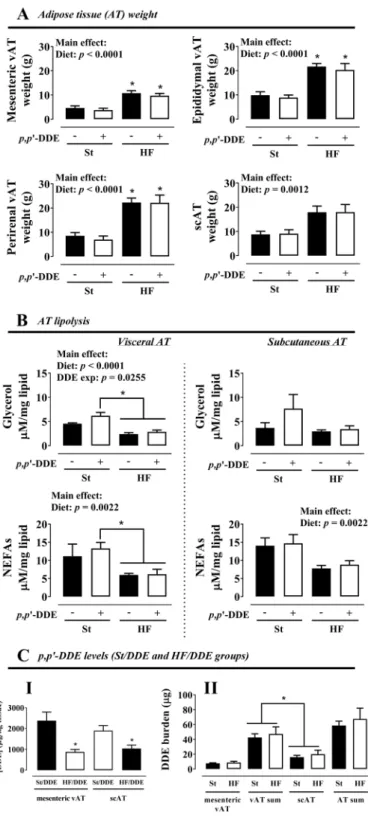
HF diet, independently of exposure top,p’-DDE, had a significant effect on AT weight increase (Fig. 2A). In contrast, vAT mature adipocytes basal lipol-ysis (Fig. 2B) was decreased when p,p’-DDE exposed and non-exposed animals were fed with HF diet, translated by a smaller glycerol and non-esterified fatty acids (NEFAs) release (p< 0.0001 and p= 0.0022). Nevertheless,
p,p’-DDE exposure increased vAT lipolysis (glycerol, p= 0.0255), an effect more pronounced in St/DDE rats without the overwhelming effect of HF diet. p,p’-DDE was only present in AT of exposed rats (data not shown) and its concentration was higher in St/DDE compared to HF/DDE rats in both mesenteric and subcutaneous AT depots (Fig. 2CI). However, no difference between exposed groups was observed in p,p’-DDE burden, calculated after normalization for AT weight (Fig. 2CII).
www.nature.com/scientificreports/
group (Fig. 3AI). Unlike standard diet-fed groups, glycaemia did not return to baseline in HF/DDE and HF after 120 min of glucose administration. Total area under the curve (AUC) of the glycaemic response was calcu-lated for each experimental group (Fig. 3AIII). HF diet increased the AUC independently of p,p’-DDE exposure (p= 0.0063), but in addition to a later and higher glucose peak in the OGTT, the effect of HF/DDE treatment was also reflected by a higher AUC comparing to St (p< 0.05, Tukey’s post-hoc test). In turn, p,p’-DDE exposure had a significant increasing effect on fasting glucose independently of the diet (p= 0.0033, Fig. 3AII). Fasting insulin levels (Fig. 3AIV) at the end of the treatment were tendentiously higher in HF diet groups, a tendency more pronounced in HF/DDE animals, which is in accordance to the results obtained for this group in OGTT. Correspondingly, homeostasis model assessment (HOMA) of insulin resistance indicated the same pattern (Fig. 3AV).
HF/DDE rats were hypertensive since week 4, with systolic blood pressure (SBP) >140 mmHg (Fig. 3B). Overall, p,p’-DDE exposure was responsible for SBP variation, demonstrated by higher SBP in St/DDE and HF/ DDE at 10 weeks (p= 0.0098). At the end of treatment (Fig. 3C), we observed that high-density lipoprotein (HDL) cholesterol levels were higher in animals fed with HF diet (p = 0.0041), however the increase in HDL levels caused by HF/DDE treatment was more pronounced comparing to St groups (p< 0.05, Tukey’s post-hoc test). The same pattern was observed for cholesterol. Regarding NEFAs, the HF diet effect was opposite to HDL, with lower levels in HF-treated animals (p= 0.0485).
Biochemical parameters and circulating cytokine profiles.
Plasma and urine biochemical parameters can be found as Supplementary Table S1. A significant interaction between HF diet and p,p’-DDE exposure was observed, resulting in the increase of plasma uric acid and lactate levels only in HF/DDE animals (interaction;p= 0.0015 and p= 0.0114). The same pattern was observed in some of the cellular damage plasma marker levels, with a significant increase of amylase, aspartate aminotransferase/alanine aminotransferase (AST/ALT) ratio, AST and creatine kinase (CK) only in HF/DDE animals (interaction; p= 0.0156, p= 0.0376, p= 0.0484 and
p= 0.0241, respectively).
www.nature.com/scientificreports/
Urinary glucose levels were higher in HF diet-fed groups (p= 0.0301), but more prominent in HF/DDE ani-mals. In the same way, microalbuminuria, which presence in urine is in itself alarming, was affected both by diet and p,p’-DDE exposure (p= 0.0473 and p= 0.0332, respectively), with a significant increase in HF/DDE animals compared to their St and HF counterparts (p< 0.05, Tukey’s post-hoc test).
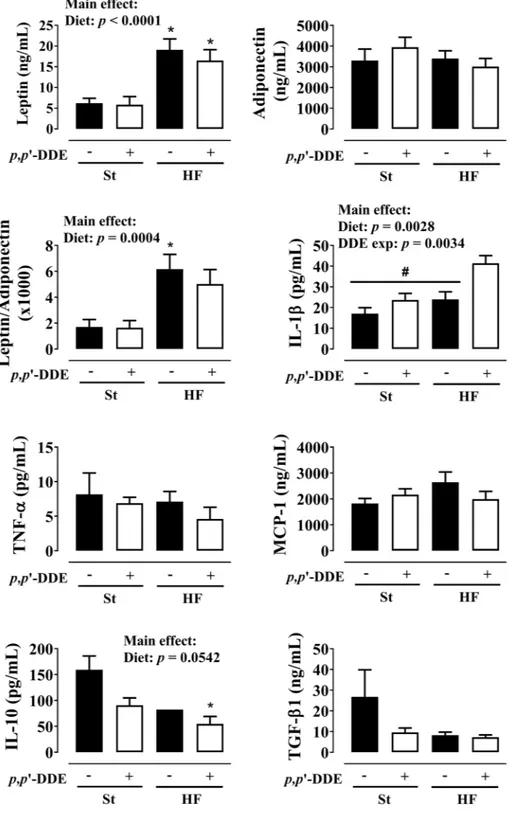
Circulating cytokines levels at 12 weeks (Fig. 4), showed a significant increase in leptin and leptin/adiponec-tin ratio by HF diet (p< 0.0001 and p= 0.0004). No significant differences were observed in TNF-α and MCP-1
Figure 3. Metabolic syndrome features. (A) oral glucose tolerance test (OGTT) at the 7th week: (I) blood glucose variation, (II) fasting glucose, (III) blood glucose area under the curve (AUC) and (IV) fasting insulin levels and (V) homeostasis model assessment (HOMA) of insulin resistance after 12 weeks; (B) systolic blood pressure at 4, 7 and 10 weeks; and (C) plasma lipid profile at the end of treatment: total cholesterol, triglycerides, high-density lipoprotein (HDL) cholesterol, cholesterol low-density lipoprotein (LDL) and non-esterified fatty acids (NEFAs). Statistical analysis with two-way ANOVA (main effects: diet, p,p’-DDE exposure and their interaction; p< 0.05), followed by Tukeys’s multiple comparison post-hoc test. (A) #p< 0.05 HF/DDE vs St and
levels. In contrast, IL-1β levels increased both by HF (p= 0.0028) and p,p’-DDE exposure (p= 0.0034), but with a significant increase in HF/DDE-treated rats when compared with all other groups (p< 0.05, Tukey’s). We observed an opposite effect for anti-inflammatory cytokines IL-10 and TGF-β1.
Figure 4. Effect of 12 weeks of treatment on circulating cytokine profile: leptin, adiponectin and their ratio; pro-inflammatory cytokines interleukin-1 beta (IL-1β), tumor necrosis factor-alpha (TNF-α) and monocyte chemotactic protein 1 (MCP-1); anti-inflammatory cytokines interleukin-10 (IL-10) and transforming growth factor-beta 1 (TGF-β1). Statistical analysis with two-way ANOVA (main effects: diet, p,p’-DDE exposure and their interaction; p< 0.05), followed by Tukey’s multiple comparison post-hoc test: *p< 0.05 vs St; #p< 0.05 vs
www.nature.com/scientificreports/
Mesenteric vAt morphology.
Adipocyte area (Fig. 5) was higher in HF diet groups (p< 0.0001). HF/DDE rats (vs HF) had an increase in % smaller/medium (<4000 µm2) and a decrease of bigger (>6000 µm2) adipocytes.We observed increased proliferation in St/DDE and HF rats, but the interaction between HF diet and p,p’-DDE exposure led to a significant decrease (p= 0.0038). Moreover, HF diet contributed for increased percentage of apoptotic cells, independently of exposure to p,p’-DDE (p= 0.0356).
Comparison of global gene expression between HF and HF/DDE rats.
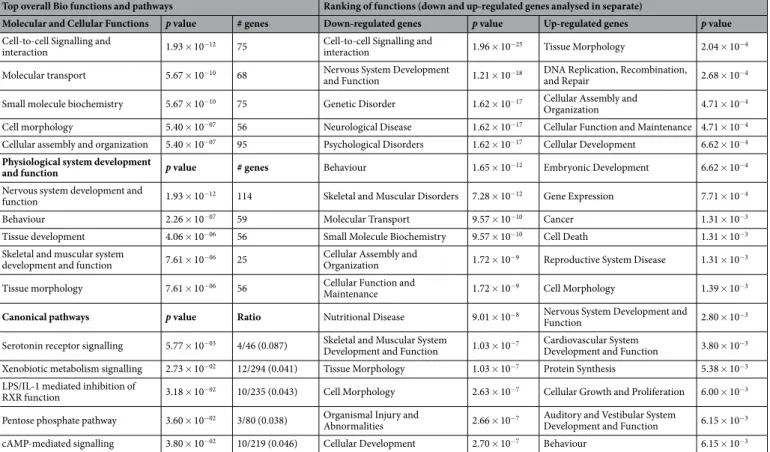
Gene expression microar-rays in mesenteric vAT from HF and HF/DDE rats showed that 320 genes were up-regulated and 311 were down-regulated (at least 1.25-fold change). Detailed data concerning up- and down-regulated genes are shown in Supplementary Table S2. The largest changes induced by HF/DDE were seen in down-regulated genes, such as galanin (Gal; −4.92-fold), cholinergic receptor nicotinic alpha 3 (Chrna3; −3.20-fold), somatostatin (Sst;−2.88-fold), neuromedin U (Nmu; −2.75-fold) or neuropeptide Y (Npy; −1.78-fold). Expression of genes such as dipeptidylpeptidase 4 (Dpp4; 2.36-fold) and ISL LIM homeobox 1 (Isl1; 1.77-fold) were up-regulated.
The differentially transcribed genes, mainly the down-regulated genes, were associated with several biolog-ical functions and pathways (Table 1). Cell-to-cell signalling and interaction, nervous system development and function, molecular transport, cellular assembly, organization and function, as well as cell and tissue morphology were on the top down-regulated functions by HF/DDE. Top transcription factors associated with HF/DDE (see Supplementary Fig. S1) disclosed an activation of hepatocyte nuclear factor 4 alpha (HNF4A; z-score 2.427) and a contrary trend for estrogen receptor alpha (Esr1). Simulating a data network between transcription factors and modulated genes using IPA, we observed a link between the transcription factors Esr1 and Isl1, and Gal.
Effects of all treatments in expression of specific genes and treatment-dependent changes
in Galanin promoter methylation status.
Nervous system development and function-related genes were evaluated by qRT-PCR (Fig. 6). We observed an overall up-regulation of selected genes, namelyFigure 5. Mesenteric visceral adipose tissue morphology and proliferative and apoptotic status. (A) adipocyte area; (B) adipocyte distribution regarding their size; (C) proliferation; (D) apoptosis; (E) proliferation/apoptosis ratio. Statistical analysis with two-way ANOVA (main effects: diet, p,p’-DDE exposure and their interaction;
p< 0.05), followed by Tukey’s multiple comparison post-hoc test: *p< 0.05 vs St; #p< 0.05 vs HF. Scale bar
neuropeptide-related genes Gal, Npy, Nmu and Sst and the galanin receptor 1 (Galr1), in HF group compar-ing to other treatments, includcompar-ing HF/DDE (significant interaction between HF diet and p,p’-DDE; exposure). Several neuroreceptor transcripts such as Chrna3, Chrm2 (cholinergic receptor, muscarinic 2), and Htr3a
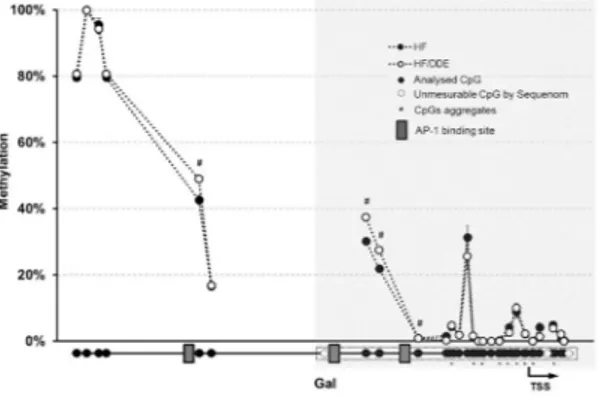
(5-hydroxytryptamine receptor 3A), as well as calcium (calbindin 2; Calb2), nitric oxide (nitric oxide synthase 1, neuronal; Nos1) and vesicle trafficking-related genes followed the same pattern. In contrast, the concomi-tant exposure to HF diet and p,p’-DDE was associated with the up-regulation of Dpp4, Isl1 and Nampt (nico-tinamide phosphoribosyltransferase), this last with a p,p’-DDE-dependent increase. Esr1 transcription did not show any difference between groups. From the nine genes with altered expression in HF/DDE animals that were selected for Sequenom analysis, only Gal (Fig. 7) showed changes in DNA methylation at its promoter region (see Supplementary Fig. S2). The HF animals (i.e. those with higher levels of expression) presented lower methylation of these CpGs comparing to HF/DDE and whilst the differences were small in magnitude and limited to a few CpGs sites, they were located near to AP-1 binding sites.
Discussion
The HF-fed rats exhibited several of the MetS features (Fig. 8) already described for this model43, 44, namely: a rapid weight gain, mostly due to a dramatic increase in AT mass; dysglycaemia with impaired response to glucose and tendentiously higher fasting insulin levels and HOMA index, mild dyslipidaemia; hyperleptinemia; and a reduction of the anti-inflammatory cytokine IL-10, alongside with a slight decrease in TGF-β1 levels, an immune system-modulating cytokine45.
However, our fundamental focus was on the assessment of p,p’-DDE exposure when supplied in an obe-sogenic context. Our study has revealed that HF-fed rats exposed to p,p’-DDE develop a severe and more exuber-ant metabolic dysfunction, independent of body weight changes (Fig. 8). The interaction between HF diet and
p,p’-DDE exposure observed in this study corroborates the suggestion that contaminants in foods can contribute to the worsening of metabolic complications of obesity25, and allowed us to further explore their causal effects.
Accordingly, HF/DDE had a clear aggravation of glycaemic metabolism (Fig. 3A), with a significant effect of
p,p’-DDE increasing fasting blood glucose levels and impairing glycaemia control with a pronounced tendency of increased fasting insulin levels and HOMA index for insulin resistance, effects to some extent already observed in St/DDE and in accordance with studies linking p,p’-DDE exposure to insulin resistance and T2D8, 29, 40–42.
In this context, the up-regulation of Dpp4 transcription in HF/DDE mesenteric vAT (see Supplementary Table S2 and Fig. 6) could be contributing for their metabolic impairment worsening, as recently described46, 47. In fact, Dpp4 (also known as CD26) is a ubiquitously expressed glycoprotein that is responsible for the rapid Top overall Bio functions and pathways Ranking of functions (down and up-regulated genes analysed in separate)
Molecular and Cellular Functions p value # genes Down-regulated genes p value Up-regulated genes p value
Cell-to-cell Signalling and
interaction 1.93 × 10⁻¹² 75
Cell-to-cell Signalling and
interaction 1.96 × 10⁻²⁵ Tissue Morphology 2.04 × 10⁻⁴
Molecular transport 5.67 × 10⁻¹⁰ 68 Nervous System Development
and Function 1.21 × 10⁻¹⁸
DNA Replication, Recombination,
and Repair 2.68 × 10⁻⁴
Small molecule biochemistry 5.67 × 10⁻¹⁰ 75 Genetic Disorder 1.62 × 10⁻¹⁷ Cellular Assembly and
Organization 4.71 × 10⁻⁴ Cell morphology 5.40 × 10−07 56 Neurological Disease 1.62 × 10⁻¹⁷ Cellular Function and Maintenance 4.71 × 10⁻⁴
Cellular assembly and organization 5.40 × 10−07 95 Psychological Disorders 1.62 × 10⁻¹⁷ Cellular Development 6.62 × 10⁻⁴
Physiological system development
and function p value # genes Behaviour 1.65 × 10⁻¹² Embryonic Development 6.62 × 10⁻⁴ Nervous system development and
function 1.93 × 10⁻¹² 114 Skeletal and Muscular Disorders 7.28 × 10⁻¹² Gene Expression 7.71 × 10⁻⁴ Behaviour 2.26 × 10−07 59 Molecular Transport 9.57 × 10⁻¹⁰ Cancer 1.31 × 10⁻³
Tissue development 4.06 × 10−06 56 Small Molecule Biochemistry 9.57 × 10⁻¹⁰ Cell Death 1.31 × 10⁻³
Skeletal and muscular system
development and function 7.61 × 10−06 25
Cellular Assembly and
Organization 1.72 × 10⁻⁹ Reproductive System Disease 1.31 × 10⁻³
Tissue morphology 7.61 × 10−06 56 Cellular Function and
Maintenance 1.72 × 10⁻⁹ Cell Morphology 1.39 × 10⁻³
Canonical pathways p value Ratio Nutritional Disease 9.01 × 10⁻⁸ Nervous System Development and
Function 2.80 × 10⁻³
Serotonin receptor signalling 5.77 × 10−03 4/46 (0.087) Skeletal and Muscular System
Development and Function 1.03 × 10⁻⁷
Cardiovascular System
Development and Function 3.80 × 10⁻³ Xenobiotic metabolism signalling 2.73 × 10−02 12/294 (0.041) Tissue Morphology 1.03 × 10⁻⁷ Protein Synthesis 5.38 × 10⁻³
LPS/IL-1 mediated inhibition of
RXR function 3.18 × 10−02 10/235 (0.043) Cell Morphology 2.63 × 10⁻⁷ Cellular Growth and Proliferation 6.00 × 10⁻³
Pentose phosphate pathway 3.60 × 10−02 3/80 (0.038) Organismal Injury and
Abnormalities 2.66 × 10⁻⁷
Auditory and Vestibular System
Development and Function 6.15 × 10⁻³ cAMP-mediated signalling 3.80 × 10−02 10/219 (0.046) Cellular Development 2.70 × 10⁻⁷ Behaviour 6.15 × 10⁻³
www.nature.com/scientificreports/
catalytic degradation of incretins, such as glucagon-like peptide-1 (GLP-1) and gastric inhibitory polypeptide (GIP), responsibles for an important part of postprandial insulin secretion. DPP4 also mediates the degradation of many growth factors and hormones, chemokines and neuropeptides and is up regulated in pro-inflammatory states including obesity and T2D48, 49. Recently, Dpp4 was also considered a novel cross-talk adipokine with auto-crine and paraauto-crine effects on insulin sensitivity impairment48, 50. On the other hand, insulin resistance may play an important role in the development of hypertension51. Corroborating epidemiological data27, 52, p,p’-DDE man-ifestly induced hypertension (Fig. 3B), an effect that was aggravated by the simultaneous ingestion of HF diet, but apparently distinct from those induced by HF diet alone.
Furthermore, one cannot overlook the probable effects of dyslipidaemia observed in HF/DDE animals (Fig. 3C), which, through lipotoxic events in insulin-responsive organs, may contribute to a reduction in periph-eral insulin response. Indeed, p,p’-DDE exposure contributed to a more marked dyslipidaemia compared to HF diet alone, namely with higher HDL levels, the main transporter of cholesterol in rats. Additionally, without an overall increase in HF-fed rats NEFAs53, HF/DDE vAT lipolysis was increased (Fig. 2B), although in a smaller Figure 6. Gene expression analysis by quantitative real-time PCR (qRT-PCR) in visceral adipose tissue. Gene expression normalised to the housekeeping genes (Hprt, Gusb and Tbp). Statistical analysis with two-way ANOVA (main effects: diet, p,p’-DDE exposure and their interaction; p< 0.05), followed by Tukey’s multiple comparison post-hoc test: *p< 0.05 vs St, #p< 0.05 vs HF/DDE and Øp< 0.05 vs St/DDE. St, standard diet; HF,
magnitude compared to St/DDE animals, probably due to an overwhelming effect of HF or a different p,p’-DDE concentration profile.
Taking into account an adipocentric view of metabolic dysfunction, we further evaluated the contribution of the mesenteric vAT impairment, considered determinant in the causal pathway of the MetS and dysmetabolic obesity3, 4. The AT inability to accommodate more lipids leads to functional and morphological changes, AT remodeling, in order to achieve a new equilibrium39. However, the apparent remodeling dynamics observed in HF group, characterized by higher proliferation and apoptotic indexes, was impaired by the interaction with
p,p’-DDE exposure, patent in decreased proliferation and lesser percentage of bigger adipocytes, without an effect on mean adipocyte area (Fig. 5). Indeed, an expanded population of small and dysfunctional adipocytes, charac-terized by lower differentiation capacity and impaired capacity to control endocrine homeostasis, and therefore energy, metabolic and inflammatory homeostasis24, 54, 55, may contribute to obesity-associated insulin resistance56. To further explore the underlying molecular mechanisms, we conducted a global gene expression evaluation between HF and HF/DDE, revealing a down-regulation of nervous system development and function-related genes, as well as of tissue development, signalling and metabolism-related genes (see Supplementary Table S2 and Table 1). To comprehend the importance of differences between HF groups, several genes of interest were
Figure 7. Methylation profile of galanin (Gal) promoter region in mesenteric vAT measured by Sequenom MassARRAY. The results are presented as average of percentage methylation ± SEM for each CpG site or aggregate of CpG sites. Statistical analysis unpaired t test: #p< 0.05. Gray area represents a CpG island. HF, high
fat diet; p,p’-DDE, p,p’-dichlorodiphenyldichloroethylene; TSS, transcription start site.
www.nature.com/scientificreports/
evaluated in all treatments (Fig. 6). The higher expression of nervous system-related genes in HF rats compared to a non-obesogenic context, possibly in response to higher energy influx and AT increase as is known that high caloric intake leads to an increased sympathetic tone57, seem impaired when rats were also exposed to p,p’-DDE, possibly contributing to AT dysfunction. Indeed, the autonomic innervation of AT is important in the regula-tion of tissue mass and funcregula-tion through neuro-adipose juncregula-tions that also mediate leptin-driven lipolysis58, 59. Moreover, exposure to EDCs, namely p,p’-DDE, have been associated with several effects on the nervous system, acting not only as neurotoxicants but also disrupting neurotransmitter function60, 61.
These changes are demonstrative of the decrease in competent metabolic control cross-talk mechanisms, as AT is known to be innervated by the autonomic nervous system, especially by sympathetic nerves62. Moreover, parasympathetic innervation in AT, along with the ability of macrophages to participate in this cross-talk63, has been recently linked with cytokine production, inflammation, energy homeostasis and insulin resistance trough the cholinergic anti-inflammatory pathway64. Remarkably, several genes related to parasympathetic nervous sys-tem, such as cholinergic receptors and Nos1, were down-regulated.
Additionally, transcript levels of some neuropeptides followed the same pattern. Gal, the most altered gene (receptor also down-regulated), is involved in the positive regulation of food intake and the risk for obesity, but also contributes to the decrease of insulin resistance and blood pressure65, 66. Gal is engaged in the regulation of numerous physiological processes and distributed widely throughout the central and peripheral nervous system and other tissues, such as vAT. The mechanisms underlying the effects of Gal on appetite and obesity are its interaction with other appetite-regulating peptides, such as the positive interaction with Npy and negative with leptin, and the stimulation of muscle to use carbohydrates over lipids67. Indeed, as in vivo evidence suggest, Gal may counteract the metabolic disturbances induced by a HF diet, in part corroborated in this study, by means of the favouring of carbohydrate over lipid metabolism in muscle67, 68.
One can also hypothesize about the possible molecular mechanism involved in this HF diet x p,p’-DDE expo-sure interaction. As xenoestrogen, p,p’-DDE can interfere with estrogen signalling, namely in the induction of
Gal69. The considerable inhibition of Esr1 transcription factor status in HF/DDE animals (see Supplementary Fig. S1), notwithstanding its unaltered transcription (Fig. 6), can be related with the Isl1-ER cross-talk ability to inhibit the ER-driven transcriptional activation70. Alternatively, compared to HF/DDE, the HF animals presented a decrease in DNA methylation at Gal regulatory region near to AP-1 binding sites, which could also help explain its increased expression (Fig. 7). Once more, p,p’-DDE exposure demonstrated to counteract this effect.
Furthermore, the HF diet x p,p’-DDE exposure interaction led to an increase of inflammation (Fig. 4), with a striking increase in plasmatic IL-1β levels, to some extent also seen in St/DDE group, alongside a decline in anti-inflammatory cytokines. This cytokine, is implicated in T2D through the activation of the inflammasome, and important part of our innate immune system that responds to danger signals that are sensed by intracellular NOD-like receptors (NLRs), such as NLRP3 inflammasome that after activation facilitates caspase-1-dependent processing of pro-IL-1β into its active form71. Indeed, IL-1β is associated with visceral obesity and β cell failure72,
73, promotion of AT inflammation and limitation of fat expandability, ultimately contributing to ectopic lipid accumulation and disturbed fat-liver crosstalk71, 73, 74, as well as to cardiac arrhythmias75. In this regard, a negative correlation was observed between the weight of vAT and other metabolically active organs susceptible to accumu-late lipids, especially liver (data not shown). Moreover, we already described that p,p’-DDE exposure associated with HF diet enhances the impairment of liver fatty acid composition and increases their overall levels, confirm-ing a close relationship with hepatic lipid dysfunction76. Despite its well accepted relation with dysmetabolic obesity, the triggers that determine differential inflammasome activation remain to be identified73, emerging the environmental exposure to POPs, and EDCs in general, as another plausible mechanism.
This AT impairment contributes to the dysfunction of other metabolically active organs and interfere with its toxicological functions, namely of protection13. Indeed, HF/DDE animals presented a strong indication of cellular damage, with a significant increase of AST, AST/ALT and CK only in HF diet-fed animals exposed to p,p’-DDE, which may imply liver, kidney or muscle damage (see Supplementary Table S1). Ultimately, this damage can have a plausible relationship with the observed metabolic dysfunction, namely with glucose intolerance as a result of pancreas damage, expressed by an increase in total plasmatic amylase. Moreover, the observed renal dysfunction could also implicate this organ in the MetS aggravation by p,p’-DDE exposure77, expressed in higher glucose and urea excretion in HF/DDE animals, alongside with a dramatic increase of microalbuminuria. One can also spec-ulate on the involvement of oxidative stress and hyperuricaemia, as well as the increase in lactate levels, on the development of insulin resistance and MetS78.
Taken together, our results confirm that p,p’-DDE exposure appears to have an important effect in MetS evo-lution and dysmetabolic obesity, exacerbating the effects of HF diet, in which the impairment of AT normal function seems to play an important role (Fig. 8). We verified that although p,p’-DDE exposure did not led to increased obesity, it contributed to a more exuberant MetS, aggravating some of its features, such as glucose intol-erance, hypertension, dyslipidaemia and inflammation. In an adipocentric view of the genesis of MetS, the results of the mesenteric vAT evaluation also point to a deleterious effect of exposure to p,p’-DDE in a HF diet context. In addition, p,p’-DDE also exerts noteworthy independent effects, as the induction of hypertension, elevated fasting glucose and inflammation, even when not in an obesogenic context. The involvement of p,p’-DDE in these pathological developments emphasizes the need for a better understanding of EDCs mechanisms of action and their recognition as metabolism disrupting chemicals. To some extent, these results can help explain the interin-dividual variability of obesity effects and introduce these compounds as possible markers of dysmetabolic obesity.
Methods
weeks: St, standard diet group; St/DDE, standard diet with p,p’-DDE exposed group; HF, high-fat diet group; HF/ DDE, high-fat diet with p,p’-DDE exposed group. The p,p’-DDE exposure was applied in drinking water with the average concentration of 100 µg/kg/day (2.5 times less than lowest-observed-adverse-effect level). The “Standard” (Teklad 2014, Harlan Laboratories, Santiga, Spain) and “High Fat” (D1245 Research Diets, New Brunswick, USA) diets had, respectively, 13% and 45% of energy from lipids. Body weights were monitored weekly. For the extended treatment details see Supplementary Methods online. Animal handling and housing protocols followed European Union guidelines (Directive 2010/63/EU) and Portuguese Act (129/92) for the use of experimental animals. The protocol was approved by the Committee on the Ethics of Animal Experiments of the Faculty of Medicine of University of Porto.
evaluation of metabolic parameters.
Oral glucose tolerance test (OGTT). After 7 weeks of treatment, the rats were fasted for 4–6 hours and a baseline blood drawn from the saphenous vein was collected for plasma fasting glucose evaluation79. The rats were gavaged with a glucose solution (2 mg/g of body weight) and glycae-mia measured thereafter until 120 min. Glucose levels were measured with Precision Xtra Plus test strips using a Optium Xceed device (Abbott Diabetes Care, Ltd., Maidenhead, UK). Plasma insulin levels at the end of the study were measured using a Rat/Mouse Insulin ELISA kit (Merck Milipore, Madrid, Spain). The homeostasis model assessment (HOMA) was used to calculate approximate insulin resistance using the formula: glucose (mg/dL) x insulin (ng/ml)/40580.Systolic blood pressure evaluation. Measurement of SBP in conscious restrained rats was carried out by the non-invasive tail-cuff method81 using LE 5000 (Letica, Rochester Hills, USA) at weeks 4, 7 and 10. Each value of SBP was obtained by averaging out three to five consecutive similar measurements.
Blood and urine biochemical analysis. Biochemical evaluation of plasma and urine was performed at São João Hospital Center Clinical Pathology Department. Routine biochemical parameters were measured using conven-tional methods with an Olympus AU5400
®
automated clinical chemistry analyser (Beckman-Coulter®
, Izasa, Porto, Portugal). Low-density lipoprotein (LDL) cholesterol was calculated according to Friedewald’s equation82. NEFAs were quantified using an in vitro enzymatic colorimetric method assay (Wako Chemicals GmbH, Neuss, Germany).Cytokine profile evaluation. Interleukin-1 beta (IL-1β), IL-10), tumor necrosis factor-alpha (TNF-α) and trans-forming growth factor-beta 1 (TGF-β1) were measured with custom Milliplex Rat kits (Merck Millipore, Madrid, Spain), using Luminex xMAP Multiplexing Technology platform. Leptin, adiponectin and monocyte chemoat-tractant protein-1 (MCP-1) were determined using, respectively, Rat Leptin ELISA Kit (Merck Millipore, Madrid, Spain), Adiponectin Enzyme Immunoassay Kit and MCP-1 ELISA Kit (RayBiotech, Norcross, USA).
Adipocyte isolation, lipolysis and determination of
p
,
p
’-DDe in the At.
Portions of visceral and subcutaneous AT (epididymal vAT and scAT, respectively) were used for adipocyte isolation according to the method of Rodbell et al.83 with some modifications, and determination of lipolysis (see Supplementary Methods online). The p,p’-DDE analysis was performed according to the method described by Fernandes & Pestana et al.84, and were expressed as µg of p,p’-DDE/kg of tissue or as p,p’-DDE burden in AT.At morphology, apoptosis and proliferation.
A portion of mesenteric vAT was fixed in buffered for-maldehyde 10%, at least for 48 h (4 °C), dehydrated and finally embedded in paraffin. Three µm thick sections were obtained with a Leica®
Microtome (RM2125RT, Lisbon, Portugal) for morphological analysis, apoptosis deter-mination, and immunohistochemistry. Adipocyte size measurement was performed from hematoxylin-eosin– stained tissue sections as previously described27. Apoptosis was analysed using the terminal deoxynucleotidyl transferase-mediated deoxyuridine triphosphate nick end-labeling (Roche) and proliferation the immuno-histochemical labeling of protein Ki67 protein85 (anti-Ki67, 1:50; fluorescein isothiocyanate-conjugated sec-ondary antibody, 1:200; in 4% bovine serum albumin; Santa Cruz Biotechnology), with simultaneous of total DAPI-stained nuclei (4′,6-diamidine-2′-phenylindole dihydrochloride; Roche) count for the same optical fields. Apoptosis and proliferation were determined as the percentage of positive cells over total counted cells. Images from five randomly-selected different optical fields were acquired, under specimen identity occultation, with a Nikon Eclipse 50i®
microscope and analysed with ImageJ software®
(National Institute of Health, Bethesda, USA).www.nature.com/scientificreports/
Microarray data analysis and functional profiling.
All downstream analysis of microarray data was performed using Agilent’s GeneSpring GX 9 software (Agilent Technologies Inc. Santa Clara, USA). After import-ing the data, the CEL files were analysed under high strimport-ingency in order to reduce the number of false positives, as previously reported86. Two different analysis algorithms were used (robust multi-array average (RMA) and Plier analysis) and only genes whose expression patterns in each of the analyses were identical were taken forward for further study. Gene expression levels were considered significantly up- or down-regulated with a fold change of at least 1.25 fold with a p value of 5% (Student’s t-test). The pathway and biological analysis of gene expression data was performed using the Ingenuity pathway analysis software (IPA, Ingenuity®
Systems, Redwood City, USA).Gene expression analysis by quantitative real-time pCR (qRt-pCR).
To validate the microarray data, 10 differentially transcribed genes (up- and down-regulated) were selected for qRT-PCR analysis (see Supplementary Fig. S3). Several target genes’ expression levels were evaluated in all treatment groups. Total RNA (1 µg) was reverse transcribed to cDNA using Multiscribe Reverse Transcriptase with random primers according to the manufacturer’s protocol (Applied Biosystems). All cDNA samples were analysed in triplicate by qRT-PCRs conducted with SYBR green qPCR Mix (SYBR Green JumpStart Taq ReadyMix for qPCR, Sigma) on a 7500 Fast Real-Time PCR System (Applied Biosystems, UK). Gene expression was calculated using the 2−∆CT method87 and normalized against the geometric mean expression levels of the endogenous control genes: hypoxanthine-guanine-phosphoribosyltransferase (Hprt), β-glucuronidase (Gusb) and TATA box binding pro-tein (Tbp). Gene-specific primers are listed in Supplementary Table S3.sequenom MassARRAY quantitative methylation analysis.
Genomic DNA was isolated from mesenteric vAT following standard methods and methylation analysis was performed following the protocol recommended by Sequenom (Sequenom, San Diego, USA). Aliquots of 0.5 µg were converted with sodium bisulphite using the EZ DNA Methylation™
Kit according to the manufacturer’s instructions (Zymo Research, Irvine, USA). Amplification of bisulphite-treated DNA (~2.5 ng µl−1) was performed using HotStarTaq DNApol-ymerase (Qiagen, UK) and primer pairs designed with Sequenom EpiDesigner (see parameters summarized in Supplementary Table S4). The PCR programme consisted of an initial 15 min denaturation at 94 °C followed by 45 cycles of 20 s at 94 °C, 30 s at the annealing temperature and 1 min at 72 °C. According to the manufacturer’s pro-tocol (Sequenom Inc., CA, USA), the amplicons of bisulfite PCR were treated with shrimp alkaline phosphatase (SAP) followed by in vitro transcription with T7 RNA polymerase and base-specific cleavage using MassCLEAVE T cleavage kit. The samples were desalted and spotted on a 384-SpectroCHIP (Sequenom), followed by spectral acquisition on a MassARRAY Analyzer Compact MALDI-TOF MS (Sequenom). The resulting methylation calls were performed by the EpiTYPER software (Sequenom) to generate quantitative results for each CpG site or an aggregate of CpG sites. Three independent bisulphite-converted DNAs were analysed per sample. Quantification of methylation was performed in triplicate and the average of the two most concordant replicates was taken at each CpG site. The average methylation was calculated as a mean value of the CpG methylation values and expressed as percentage methylation.
statistical analysis.
Values are expressed as the arithmetic mean ± standard error of the mean (SEM). Two-way ANOVA was used to determine the main effects of diet [Standard (St and St/DDE) vs High-fat diet (HF and HF/DDE)], p,p’-DDE exposure [non-exposed (St and HF) vs exposed Rats (St/DDE and HF/DDE)] and their interaction (diet x p,p’-DDE exposure). Posteriorly, tukey’s multiple comparison post-hoc test was used to determine differences between all experimental groups and represented with corresponding symbols. Two-way ANOVA repeated measures followed by Tukey’s multiple comparison post-hoc test was used to evaluate the differences between experimental conditions throughout time. To analyse the differences between 2 groups, a Student’s t test was used: unpaired t test when comparing methylation profile between treatment groups (HF and HF/DDE); regarding p,p’-DDE concentrations and p,p’-DDE burden in AT, unpaired t test when comparing between treatment groups (St/DDE and HF/DDE) and paired t test when comparing between different ATs from the same treatment group. The association between various parameters were analysed computing Pearson’s corre-lation coefficients. All statistical analyses were performed using GraphPad Prism 6 statistical software (GraphPad Software Inc., La Jolla, USA). The differences were considered statistically significant when p< 0.05.References
1. Eckel, R. H., Grundy, S. M. & Zimmet, P. Z. The metabolic syndrome. Lancet365, 1415–1428, doi:10.1016/S0140-6736(05)66378-7 (2005).
2. Alberti, K. G. et al. Harmonizing the metabolic syndrome: a joint interim statement of the International Diabetes Federation Task Force on Epidemiology and Prevention; National Heart, Lung, and Blood Institute; American Heart Association; World Heart Federation; International Atherosclerosis Society; and International Association for the Study of Obesity. Circulation120, 1640–1645, doi:10.1161/CIRCULATIONAHA.109.192644 (2009).
3. Bluher, M. The distinction of metabolically ‘healthy’ from ‘unhealthy’ obese individuals. Current opinion in lipidology21, 38–43, doi:10.1097/MOL.0b013e3283346ccc (2010).
4. Wernstedt Asterholm, I. et al. Adipocyte inflammation is essential for healthy adipose tissue expansion and remodeling. Cell metabolism20, 103–118, doi:10.1016/j.cmet.2014.05.005 (2014).
5. Baillie-Hamilton, P. F. Chemical toxins: a hypothesis to explain the global obesity epidemic. J Altern Complement Med8, 185–192, doi:10.1089/107555302317371479 (2002).
6. Heindel, J. J., Newbold, R. & Schug, T. T. Endocrine disruptors and obesity. Nature reviews. Endocrinology. doi:10.1038/ nrendo.2015.163 (2015).
7. Pestana, D. et al. The Role of Endocrine Disruptors on Metabolic Dysfunction. Open Biotechnology Journal10, 108–121, doi:10.2174/1874070701610010108 (2016).
8. Neel, B. A. & Sargis, R. M. The paradox of progress: environmental disruption of metabolism and the diabetes epidemic. Diabetes
9. Lee, D. H., Porta, M., Jacobs, D. R. Jr. & Vandenberg, L. N. Chlorinated persistent organic pollutants, obesity, and type 2 diabetes.
Endocrine reviews35, 557–601, doi:10.1210/er.2013-1084 (2014).
10. Heindel, J. J. et al. Parma consensus statement on metabolic disruptors. Environmental health: a global access science source14, 54, doi:10.1186/s12940-015-0042-7 (2015).
11. Gore, A. C. et al. Executive Summary to EDC-2: The Endocrine Society’s Second Scientific Statement on Endocrine-Disrupting Chemicals. Endocrine reviews36, 593–602, doi:10.1210/er.2015-1093 (2015).
12. Porta, M. et al. Monitoring concentrations of persistent organic pollutants in the general population: the international experience.
Environ Int34, 546–561, doi:10.1016/j.envint.2007.10.004 (2008).
13. La Merrill, M. et al. Toxicological function of adipose tissue: focus on persistent organic pollutants. Environ Health Perspect121, 162–169, doi:10.1289/ehp.1205485 (2013).
14. Myre, M. & Imbeault, P. Persistent organic pollutants meet adipose tissue hypoxia: does cross-talk contribute to inflammation during obesity? Obesity reviews: an official journal of the International Association for the Study of Obesity15, 19–28, doi:10.1111/ obr.12086 (2014).
15. Schafer, K. S. & Kegley, S. E. Persistent toxic chemicals in the US food supply. J Epidemiol Community Health56, 813–817 (2002). 16. Darnerud, P. O. et al. Dietary intake estimations of organohalogen contaminants (dioxins, PCB, PBDE and chlorinated pesticides,
e.g. DDT) based on Swedish market basket data. Food Chem Toxicol44, 1597–1606, doi:10.1016/j.fct.2006.03.011 (2006). 17. Mantovani, A. Endocrine Disrupters and the Safety of Food Chains. Horm Res Paediatr86, 279–288, doi:10.1159/000441496 (2016). 18. Trasande, L. et al. Estimating burden and disease costs of exposure to endocrine-disrupting chemicals in the European union. The
Journal of clinical endocrinology and metabolism100, 1245–1255, doi:10.1210/jc.2014-4324 (2015).
19. Trasande, L. et al. Burden of disease and costs of exposure to endocrine disrupting chemicals in the European Union: an updated analysis. Andrology4, 565–572, doi:10.1111/andr.12178 (2016).
20. Attina, T. M. et al. Exposure to endocrine-disrupting chemicals in the USA: a population-based disease burden and cost analysis.
Lancet Diabetes Endocrinol4, 996–1003, doi:10.1016/S2213-8587(16)30275-3 (2016).
21. Sargis, R. M. The hijacking of cellular signaling and the diabetes epidemic: mechanisms of environmental disruption of insulin action and glucose homeostasis. Diabetes & metabolism journal38, 13–24, doi:10.4093/dmj.2014.38.1.13 (2014).
22. Kirkley, A. G. & Sargis, R. M. Environmental endocrine disruption of energy metabolism and cardiovascular risk. Current diabetes reports14, 494, doi:10.1007/s11892-014-0494-0 (2014).
23. Gore, A. C. et al. EDC-2: The Endocrine Society’s Second Scientific Statement on Endocrine-Disrupting Chemicals. Endocrine reviews36, E1–E150, doi:10.1210/er.2015-1010 (2015).
24. Regnier, S. M. & Sargis, R. M. Adipocytes under assault: environmental disruption of adipose physiology. Biochimica et biophysica acta1842, 520–533, doi:10.1016/j.bbadis.2013.05.028 (2014).
25. Ibrahim, M. M. et al. Chronic consumption of farmed salmon containing persistent organic pollutants causes insulin resistance and obesity in mice. PLoS One6, e25170, doi:10.1371/journal.pone.0025170 (2011).
26. Ruzzin, J. et al. Persistent organic pollutant exposure leads to insulin resistance syndrome. Environ Health Perspect118, 465–471, doi:10.1289/ehp.0901321 (2010).
27. Pestana, D. et al. Persistent organic pollutant levels in human visceral and subcutaneous adipose tissue in obese individuals-Depot differences and dysmetabolism implications. Environmental research133C, 170–177, doi:10.1016/j.envres.2014.05.026 (2014). 28. Heindel, J. J. et al. Metabolism disrupting chemicals and metabolic disorders. Reprod Toxicol68, 3–33, doi:10.1016/j.
reprotox.2016.10.001 (2017).
29. Howell, G. E. 3rd et al. Exposure to p,p’-dichlorodiphenyldichloroethylene (DDE) induces fasting hyperglycemia without insulin resistance in male C57BL/6H mice. Toxicology320, 6–14, doi:10.1016/j.tox.2014.02.004 (2014).
30. Arsenescu, V., Arsenescu, R. I., King, V., Swanson, H. & Cassis, L. A. Polychlorinated biphenyl-77 induces adipocyte differentiation and proinflammatory adipokines and promotes obesity and atherosclerosis. Environ Health Perspect116, 761–768, doi:10.1289/ ehp.10554 (2008).
31. Bo, E. et al. Adult exposure to tributyltin affects hypothalamic neuropeptide Y, Y1 receptor distribution, and circulating leptin in mice. Andrology4, 723–734, doi:10.1111/andr.12222 (2016).
32. Giatti, S. et al. Effects of Subchronic Finasteride Treatment and Withdrawal on Neuroactive Steroid Levels and Their Receptors in the Male Rat Brain. Neuroendocrinology103, 746–757, doi:10.1159/000442982 (2016).
33. Alonso-Magdalena, P., Quesada, I. & Nadal, A. Endocrine disruptors in the etiology of type 2 diabetes mellitus. Nature reviews. Endocrinology7, 346–353, doi:10.1038/nrendo.2011.56 (2011).
34. Wahlang, B. et al. Toxicant-associated steatohepatitis. Toxicol Pathol41, 343–360, doi:10.1177/0192623312468517 (2013). 35. Penell, J., Lind, L., Salihovic, S., van Bavel, B. & Lind, P. M. Persistent organic pollutants are related to the change in circulating lipid
levels during a 5 year follow-up. Environmental research134, 190–197, doi:10.1016/j.envres.2014.08.005 (2014).
36. Gauthier, M. S. et al. The metabolically healthy but obese phenotype is associated with lower plasma levels of persistent organic pollutants as compared to the metabolically abnormal obese phenotype. The Journal of clinical endocrinology and metabolism. jc20133935, doi:10.1210/jc.2013-3935 (2014).
37. Teixeira, D. et al. Inflammatory and Cardiometabolic Risk on Obesity: Role of Environmental Xenoestrogens. The Journal of clinical endocrinology and metabolism. jc20144136, doi:10.1210/jc.2014-4136 (2015).
38. Grun, F. & Blumberg, B. Endocrine disrupters as obesogens. Mol Cell Endocrinol304, 19–29, doi:10.1016/j.mce.2009.02.018 (2009). 39. Ukropec, J., Ukropcova, B., Kurdiova, T., Gasperikova, D. & Klimes, I. Adipose tissue and skeletal muscle plasticity modulates
metabolic health. Arch Physiol Biochem114, 357–368, doi:10.1080/13813450802535812 (2008).
40. Lee, H. Relationship between serum concentrations of persistent organic pollutants and the prevalence of metabolic syndrome among non-diabetic adults: results from the National Health and Nutrition Examination Survey 1999–2002. Diabetologia50, 1841–1851 (2007).
41. Lee, D. H. et al. A strong dose-response relation between serum concentrations of persistent organic pollutants and diabetes: results from the National Health and Examination Survey 1999–2002. Diabetes Care29, 1638–1644, doi:10.2337/dc06-0543 (2006). 42. Turyk, M., Anderson, H. A., Knobeloch, L., Imm, P. & Persky, V. W. Prevalence of diabetes and body burdens of polychlorinated
biphenyls, polybrominated diphenyl ethers, and p,p’-diphenyldichloroethene in Great Lakes sport fish consumers. Chemosphere75, 674–679, doi:10.1016/j.chemosphere.2008.12.035 (2009).
43. Marques, C. et al. High-fat diet-induced obesity Rat model: a comparison between Wistar and Sprague-Dawley Rat. Adipocyte5, 11–21, doi:10.1080/21623945.2015.1061723 (2016).
44. Lau, E. et al. The role of I-FABP as a biomarker of intestinal barrier dysfunction driven by gut microbiota changes in obesity. Nutr Metab (Lond)13, 31, doi:10.1186/s12986-016-0089-7 (2016).
45. Yoshimura, A. & Muto, G. TGF-beta function in immune suppression. Curr Top Microbiol Immunol350, 127–147, doi:10.1007/82_2010_87 (2011).
46. Bouchard, L. et al. Comprehensive genetic analysis of the dipeptidyl peptidase-4 gene and cardiovascular disease risk factors in obese individuals. Acta Diabetol46, 13–21, doi:10.1007/s00592-008-0049-4 (2009).
47. Turcot, V. et al. Comparison of the dipeptidyl peptidase-4 gene methylation levels between severely obese subjects with and without the metabolic syndrome. Diabetol Metab Syndr5, 4, doi:10.1186/1758-5996-5-4 (2013).
www.nature.com/scientificreports/
49. Zhong, J., Maiseyeu, A., Davis, S. N. & Rajagopalan, S. DPP4 in cardiometabolic disease: recent insights from the laboratory and clinical trials of DPP4 inhibition. Circ Res116, 1491–1504, doi:10.1161/CIRCRESAHA.116.305665 (2015).
50. Lamers, D. et al. Dipeptidyl peptidase 4 is a novel adipokine potentially linking obesity to the metabolic syndrome. Diabetes60, 1917–1925, doi:10.2337/db10-1707 (2011).
51. Despres, J. P. Abdominal obesity and cardiovascular disease: is inflammation the missing link? Can J Cardiol28, 642–652, doi:10.1016/j.cjca.2012.06.004 (2012).
52. Arrebola, J. P. et al. Historical exposure to persistent organic pollutants and risk of incident hypertension. Environmental research
138, 217–223, doi:10.1016/j.envres.2015.02.018 (2015).
53. Karpe, F., Dickmann, J. R. & Frayn, K. N. Fatty acids, obesity, and insulin resistance: time for a reevaluation. Diabetes60, 2441–2449, doi:10.2337/db11-0425 (2011).
54. Regnier, S. M. et al. Tributyltin differentially promotes development of a phenotypically distinct adipocyte. Obesity (Silver Spring)
23, 1864–1871, doi:10.1002/oby.21174 (2015).
55. Kloting, N. & Bluher, M. Adipocyte dysfunction, inflammation and metabolic syndrome. Rev Endocr Metab Disord15, 277–287, doi:10.1007/s11154-014-9301-0 (2014).
56. McLaughlin, T. et al. Enhanced proportion of small adipose cells in insulin-resistant vs insulin-sensitive obese individuals implicates impaired adipogenesis. Diabetologia50, 1707–1715, doi:10.1007/s00125-007-0708-y (2007).
57. Schwartz, J. H., Young, J. B. & Landsberg, L. Effect of dietary fat on sympathetic nervous system activity in the rat. J Clin Invest72, 361–370 (1983).
58. Zeng, W. et al. Sympathetic neuro-adipose connections mediate leptin-driven lipolysis. Cell163, 84–94, doi:10.1016/j. cell.2015.08.055 (2015).
59. Bartness, T. J., Liu, Y., Shrestha, Y. B. & Ryu, V. Neural innervation of white adipose tissue and the control of lipolysis. Front Neuroendocrinol35, 473–493, doi:10.1016/j.yfrne.2014.04.001 (2014).
60. Tshala-Katumbay, D., Mwanza, J. C., Rohlman, D. S., Maestre, G. & Oria, R. B. A global perspective on the influence of environmental exposures on the nervous system. Nature527, S187–192, doi:10.1038/nature16034 (2015).
61. Fonnum, F. & Mariussen, E. Mechanisms involved in the neurotoxic effects of environmental toxicants such as polychlorinated biphenyls and brominated flame retardants. J Neurochem111, 1327–1347, doi:10.1111/j.1471-4159.2009.06427.x (2009). 62. Das, U. N. Obesity: genes, brain, gut, and environment. Nutrition26, 459–473, doi:10.1016/j.nut.2009.09.020 (2010).
63. Kreier, F. et al. Tracing from fat tissue, liver, and pancreas: a neuroanatomical framework for the role of the brain in type 2 diabetes.
Endocrinology147, 1140–1147, doi:10.1210/en.2005-0667 (2006).
64. Leib, C., Katus, H. A. & Kaya, Z. Cholinergic control of inflammation in cardiovascular diseases. Trends Cardiovasc Med23, 46–51, doi:10.1016/j.tcm.2012.08.010 (2013).
65. Fang, P. et al. Galanin peptide family as a modulating target for contribution to metabolic syndrome. Gen Comp Endocrinol179, 115–120, doi:10.1016/j.ygcen.2012.07.029 (2012).
66. Kim, A. & Park, T. Diet-induced obesity regulates the galanin-mediated signaling cascade in the adipose tissue of mice. Mol Nutr Food Res54, 1361–1370, doi:10.1002/mnfr.200900317 (2010).
67. Fang, P. et al. Galanin and its receptors: a novel strategy for appetite control and obesity therapy. Peptides36, 331–339, doi:10.1016/j. peptides.2012.05.016 (2012).
68. Yun, R. et al. PVN galanin increases fat storage and promotes obesity by causing muscle to utilize carbohydrate more than fat.
Peptides26, 2265–2273, doi:10.1016/j.peptides.2005.04.005 (2005).
69. Sonnenschein, C. & Soto, A. M. An updated review of environmental estrogen and androgen mimics and antagonists. J Steroid Biochem Mol Biol65, 143–150 (1998).
70. Gay, F., Anglade, I., Gong, Z. & Salbert, G. The LIM/homeodomain protein islet-1 modulates estrogen receptor functions. Mol Endocrinol14, 1627–1648 (2000).
71. Stienstra, R., Tack, C. J., Kanneganti, T. D., Joosten, L. A. & Netea, M. G. The inflammasome puts obesity in the danger zone. Cell metabolism15, 10–18, doi:10.1016/j.cmet.2011.10.011 (2012).
72. Ehses, J. A., Boni-Schnetzler, M., Faulenbach, M. & Donath, M. Y. Macrophages, cytokines and beta-cell death in Type 2 diabetes.
Biochem Soc Trans36, 340–342, doi:10.1042/BST0360340 (2008).
73. Esser, N., Legrand-Poels, S., Piette, J., Scheen, A. J. & Paquot, N. Inflammation as a link between obesity, metabolic syndrome and type 2 diabetes. Diabetes research and clinical practice105, 141–150, doi:10.1016/j.diabres.2014.04.006 (2014).
74. Nov, O. et al. Interleukin-1beta regulates fat-liver crosstalk in obesity by auto-paracrine modulation of adipose tissue inflammation and expandability. PLoS One8, e53626, doi:10.1371/journal.pone.0053626 (2013).
75. Monnerat, G. et al. Macrophage-dependent IL-1beta production induces cardiac arrhythmias in diabetic mice. Nat Commun7, 13344, doi:10.1038/ncomms13344 (2016).
76. Rodriguez-Alcala, L. M. et al. Endocrine Disruptor DDE Associated with a High-Fat Diet Enhances the Impairment of Liver Fatty Acid Composition in Rats. J Agric Food Chem63, 9341–9348, doi:10.1021/acs.jafc.5b03274 (2015).
77. Guri, A. J. & Bassaganya-Riera, J. Systemic effects of white adipose tissue dysregulation and obesity-related inflammation. Obesity (Silver Spring)19, 689–700, doi:10.1038/oby.2010.230 (2011).
78. Crawford, S. O. et al. Association of blood lactate with type 2 diabetes: the Atherosclerosis Risk in Communities Carotid MRI Study.
Int J Epidemiol39, 1647–1655, doi:10.1093/ije/dyq126 (2010).
79. Gollisch, K. S. et al. Effects of exercise training on subcutaneous and visceral adipose tissue in normal- and high-fat diet-fed rats. Am J Physiol Endocrinol Metab297, E495–504, doi:10.1152/ajpendo.90424.2008 (2009).
80. Muniyappa, R. et al. Comparison between surrogate indexes of insulin sensitivity/resistance and hyperinsulinemic euglycemic clamp estimates in rats. Am J Physiol Endocrinol Metab297, E1023–1029, doi:10.1152/ajpendo.00397.2009 (2009).
81. Ibrahim, J., Berk, B. C. & Hughes, A. D. Comparison of simultaneous measurements of blood pressure by tail-cuff and carotid arterial methods in conscious spontaneously hypertensive and Wistar-Kyoto rats. Clin Exp Hypertens28, 57–72, doi:10.1080/10641960500386817 (2006).
82. Friedewald, W. T., Levy, R. I. & Fredrickson, D. S. Estimation of the concentration of low-density lipoprotein cholesterol in plasma, without use of the preparative ultracentrifuge. Clin Chem18, 499–502 (1972).
83. Rodbell, M. Metabolism of Isolated Fat Cells. I. Effects of Hormones on Glucose Metabolism and Lipolysis. J Biol Chem239, 375–380 (1964).
84. Fernandes, V. C. et al. Optimization and validation of organochlorine compounds in adipose tissue by SPE-gas chromatography.
Biomed Chromatogr26, 1494–1501, doi:10.1002/bmc.2723 (2012).
85. Scholzen, T. & Gerdes, J. The Ki-67 protein: from the known and the unknown. J Cell Physiol182, 311–322, doi: 10.1002/(SICI)1097-4652(200003)182:3<311::AID-JCP1>3.0.CO;2-9 (2000).
86. Tung, Y. C. et al. Novel leptin-regulated genes revealed by transcriptional profiling of the hypothalamic paraventricular nucleus. J Neurosci28, 12419–12426, doi:10.1523/JNEUROSCI.3412-08.2008 (2008).
Acknowledgements
The authors thank Giles Yeo (University of Cambridge, Metabolic Research Laboratories, MRC Metabolic Diseases Unit, Cambridge, United Kingdom) for the excellent mentoring support regarding the microarray data analysis and functional profiling. The excellent contribution of the technicians from the Department of Clinical Pathology (Hospital S. João, Porto, Portugal) with the determination of biochemical markers is also gratefully acknowledged. This article was supported by ERDF (European Regional Development Fund) through the operation POCI-01-0145-FEDER-007746 funded by the Programa Operacional Competitividade e Internacionalização – COMPETE2020 and by National Funds through FCT - Fundação para a Ciência e a Tecnologia within CINTESIS, R&D Unit (reference UID/IC/4255/2013); PEst-OE/SAU/UI0038/2011; SFRH/BPD/109158/2015; SFRH/BD/46640/2008, SFRH/BD/64691/2009, SFRH/BD/78367/2011, SFRH/ BD/93073/2013, SFRH/BPD/109153/2015, SFRH/BD/47200/2008, SFRH/BPD/75294/2010; and SFRH/ BPD/40110/2007.
Author Contributions
D.P. performed most of the experiments, interpreted data, and wrote the initial draft of the manuscript. D.T., M.M., S.N., C.M., A.F., C.S. were involved in animal treatment, performing experiments and data analysis. V.C.F., L.C.S., V.F.D. and C.D.M. performed p,p’-DDE measurements. L.G. and J.T.G. were responsible for animal treatment management and biochemical parameters analysis, respectively. M.C. provided facilities and expertise in some steps of the work, advised on the study concept and critically revised the manuscript. Along with W.N.C. and I.S., guided D.P. in microarray, qRT-PCR and Sequenom analysis. R.M. and C.C. were responsible for conception and design of the study, analysis and interpretation of data, manuscript revision, and approval of the final version of the manuscript. C.C. is the guarantor of this work and, as such, takes responsibility for the work as a whole, including the study design, access to data, and the decision to submit and publish the manuscript. All authors contributed to the data interpretation, to the preparation of the manuscript, and to the final version of the manuscript.
Additional Information
Supplementary information accompanies this paper at doi:10.1038/s41598-017-02885-9
Competing Interests: The authors declare that they have no competing interests.
Publisher's note: Springer Nature remains neutral with regard to jurisdictional claims in published maps and institutional affiliations.
Open Access This article is licensed under a Creative Commons Attribution 4.0 International License, which permits use, sharing, adaptation, distribution and reproduction in any medium or format, as long as you give appropriate credit to the original author(s) and the source, provide a link to the Cre-ative Commons license, and indicate if changes were made. The images or other third party material in this article are included in the article’s Creative Commons license, unless indicated otherwise in a credit line to the material. If material is not included in the article’s Creative Commons license and your intended use is not per-mitted by statutory regulation or exceeds the perper-mitted use, you will need to obtain permission directly from the copyright holder. To view a copy of this license, visit http://creativecommons.org/licenses/by/4.0/.