Efficient Allocation of Verification Resources
using
Revision History Information
Jose
Augusto
Nacif*, Thiago
Silva*,
Andrea Jabrudi Tavarest,
Antonio 0.
Fernandes*, Claudionor N. Coelho Jr.*,t
*Computer
Science DepartmentUniversidade Federal de Minas Gerais, BeloHorizonte, MG, Brazil Email: {jnacif,thiagosf,otavio,coelho} @dcc.ufmg.br
tJasper
Design Automation, Mountain View, CA, USA Email: {iabrudi}@jasper-da.comAbstract-Verifying large industrial designs is gettingharder undetected bugs? In which modules the verification team each day.The current verificationmethodologies are not able to should concentratetheir effort? The objective of this paper is to guarantee bug free designs. Some recurrent questions during use softwareengineering techniques to answer these questions.
a design verification are: Which modules are most likely to
contain undetected bugs? In which modules the verification The noveltyof
this
work Si topoitwhich
hardwaremodulesteam should concentrate their effort? This information is very are most likely to have design bugs using history information useful,because it is better to startverifying the mostbug-prone available in concurrentversioning systems [13], [14]. Mining modules. In this work we present a novel approach to answer softwarerepositories to track design history changes and bug
these questions. In order to identify these bug-prone modules
the revision history of the design is used. Using information of
re
isoa
widely
se te einsotre velon
t.an academic experiment, we demonstrate that there is a close The iformation available i these concurrent versionig sys-relationship between bugs/changes historyand futurebugs. Our tems are useful to
predict
futurebugs
and to modelbugs
results show that allocating modules for verification based on patterns that helps reducing future bugs.
bugs/changes leaded to the coverage of 91.67% of future bugs, This paper isoutlined as follows. Section 2 discusses related
while random based strategy covered only 37.5% of the future work mainly focused in software engineering techniques to
bugs. identify bug-prone modules. In Section 3 we present the
I.
INTRODUCTIONproposed methodology
forfinding bug-prone
modules. Section 4 presents the results andfinallyinSection 5 we concludeourThe capacity of packing transistors in a single chip is remarks andpresent future work. stillgrowing exponentially according toMoore's law [1]-[3].
Today's high-performanceprocessorsdesigns usehundreds of II. RELATED WORK
millions of transistors and clockfrequencies up toGigahertz. The strategy of using the revision history information to These complex processors should be designed and qualified predict bug-prone software modules is not new. There is a rich forproduction respecting tighttime-to-market constraints. literature available and nowadays many research groups are Unfortunately, the gap between design and verification working on this problem [15]. Althoughan active and promi-is getting larger. Current verification methodologies are not nent research area in software engineering, it was not found capable to validate complex industrial integrated circuits in previous works on the useof revision history information on
time, even consuming 60%-70% of all design cycle [4]- integrated circuit design. Thus, this Section will discuss the [6]. This scenario is illustrated by many buggy processors main works onpredicting bug-prone software modules. reports. Perhaps the most famous is the Pentium Floating In [16], it hasbeen proposed an algorithm to build a list of Point Bug [7], that costed to Intel 500 million dollars. In bug-prone modules. This list was built using 4 factors: most 1999, another bug, now in Pentium III [8], caused a drastic frequently modified, most recently modified, most frequently decrease in Intel's servers sales. In 2003, some Pentium IV fixed, mostrecently fixed. The 4 factors are used togenerate masks [9] presented malfunctioning in certain conditions and 4different liststhat are combined to produce the top-ten
bug-somebuggyItanium 2 [10]chipswererecalledbyIntel. Other prone list. This approach is very similar to a memory cache companies like AMD [11] and IBM [12] also had similar and it is used to assist managers to allocate their limited
problems. testing resources. A similar work is presented in [20], [21]. A
In traditional verification methodologies, the modules of a negative binomial regression model was developed and used system are not verified together. Each module is individually to predict expected number of bugs in each file on the next verified using functional and/or formal techniques. Even when release of a software. The model was applied to two large verifying individual modules of a system, some bugs are industrial systems and the 20% of files with highest expected not identified. So, which modules are most likely to contain bug densities contained 83% of the future bugs.
The works [17], [18] combine software complexity metrics is the module where the bug was identified. Students were like Lines of Code (LoC), number of unique operators, and instructed to report all modules that were affected by a bug. cyclomatic complexity, with revision history information, like
bug densities, to classify the modules that are more likely to Bug correction contain bugs. This is done using regression and calculating
weights for each factor. They were able to predict 10% of the
modules where 64% of all bugs, and 20% of the modules that Verification Bug detection
contain 82% of the
bugs.
.
-
Simulator.-
B ReportThe work presented in [22] uses change management data from a mature software system to predict the bugdistribution
over modules. The results show that if a module is, on the average, a year older than a similar other module, the older module will have a third fewer bugs. Their results also show that a good metric to predict bugs is the the sum of the
times a module was changed, with large and recent changes Fig. 1. Experimental Environment Architecture receiving the most weight. [23] is other work that explores the
amount and size of modifications topredict bugs. The results IV. RESULTS discussed indicate that relative code change measurements
(chaged-oG/oG) re ette topredct ugs hanabsoute The results presented in this Section were obtained from a
measurments(changed-Lo
G).oCare
bettertopredictbugsthanabsolteam
composed by
5 students. The finaldesign
contains 3079Lines
of Code(LoC).
Thedistribution
of the LoC among III. METHODOLOGY the modules ispresented
inFigure
2. The modules sizesare
generally
well balancedexcept
for module10,
whichThe first challenge of this work was to find bug and
represents
almostone third of the total LoC. revision history information of hardware designs. Even whenconsidering only bugreports, despitethe great number ofbugs
in large-scale projects, this information is poorly published. 1000 It is a common practice in industry to keep track of bugs,
but unfortunately this information is considered too critical 800
to be made public. Detailed bug reports could expose unde- 7O sired flaws during the chip development thus decreasing the O 600
credibility
of the company. 0The solution for this challenge is to use information of academic designs. This is a well established research prac- * tice [24], [25]. The experiment was conducted as the project
for a Computer Architecture course given at UFMG during 200 the winter of 2007. The participation of the students was not
mandatory,but extragrade was offered to the volunteers that 0
' ~~~~~~~~~~12 3 4 5 6 7 8 9 10 11
commit and fillbug reports often. Module
During the course the students should design, in Verilog Module
HDL, a dual core 32-bit RISC processor. The processor Fig. 2. Lines of code per module at the end of theproject
instruction set is MIPS32 compatible [26]. Each core has
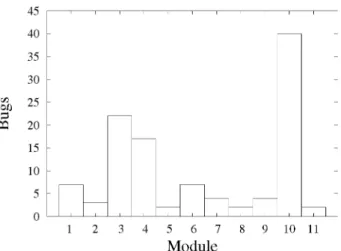
2 blocks of write-back cache: instruction with 128 Kb, and The total number of bugs is given in Figure 3. During the data with 256 Kb. The cache coherence protocol is write- modules development, 10 bugs were reported. It is easy to see update. Some instructions should not be implemented, like that the bug distribution does not follow a linearpattern. Some multiplication, multi-processing, synchronization,andprefetch modules were more bug-prone than others, which is already instructions. The pipeline is composed by 5 stages: Fetch, expected.
45 the modules; and the cost threshold is the maximum number
40 of
LoC.
35
Inthis experiment, the threshold of allocatable LoC is 1013.This number was arbitrated, and it is the size of the biggest
30 module. For the purpose of comparing the efficiency of the
; 25 allocation
strategies,
theoptimal
solutionfor this instance ofthe
problem
was found.Although
this is anNP-Complete
20
-problem,
for this instance (size
11),
the brute forcealgorithm
15 running time is satisfatory. The optimal solution for this
10 instance is able to include modules that covers 24 bugs out
5 - of 33 possible. So the efficiency of allocating strategies is
based on this
optimal
solution. Table II lists 3 metricsgen-0
erated
using
the
information retrieved
from CVS
repository.
1 2 3 4 5 6 7 8 9 10 11
Module
The revision history allocation strategies use information likechange densities of both partitions (first 75% and last 25%) Fig. 3. Bugs per module at the end of the project andbug densityof firstpartition topredict thebug density ofthe second partition.
0.08 Table III presents 5 allocation strategies. The first is the
optimal solution and is used as a reference. The second and
0.07 the third allocation strategies are based, respectively, on the
o 0.06
bug
andchange
densities of the firstpartition
(75%).
The2
algorithm
used to achieve this solution is verysimple.
Theo 0.05 modules are sorted by bug or change density in firstpartition
0.04 and then they are included in sequence. If the threshold is
exceeded,
the module is removed and the next module isQ 0.03 included. Both strategies include the same modules and are
0.02 abletopredict 87.5% of the bugs in the second partition. The
0.01 - fourth allocation
strategy
assumes thatrelationship
betweenbugs per change is constant in both partitions.
This
solution0 _ predicts the modules where 91.67 % of the possible bugs are
1 2 3 4 5 6 7 8 9 10 11 located. The last allocation strategy does not consider design
Module
history information. It is a random solution selected from aFig.
4.
BugDensityper modulea theendoftheprojectset
of average solutions. This set was built selecting everysolution thatmeet the average of all possible solutions. This strategypredicts only 37.5% of the future bugs.
correspondstothe first 75%days of development and partition 2tothe last 25%. The number of days of both partitions was
calculated based on the difference between the last and the V. CONCLUSIONS AND FUTURE WORK first change date of each module. This information is shown
inTable I. Traditional verification methodologies do not consider
de-sign revision history when allocating verification resources. A. Allocation
of
Verification
Resources This work demonstrated the relevance of this information The problem presented in this Section is the allocation of whiledefining bug-prone
modules. Results froman academicTABLEI
METRICSRETRIEVEDFROMREPOSITORYIN FIRST75%,LAST25%,AND TOTAL DEVELOPMENT CYCLE
Module Partition 1 (First 75%) Partition 2 (Last 25%) Final (100%)
ABugs AChanges ALoC ABugs AChanges ALoC Bugs Changes LoC
1 5 12 145 2 5 14 7 17 159
2 2 8 271 1 1 1 3 9 270
3 10 34 180 12 19 125 22 53 305
4 10 34 180 7 14 64 17 48 244
5 2 4 329 0 1 3 2 5 326
6 6 16 308 1 2 0 7 18 308
7 4 14 146 0 0 0 4 14 146
8 0 5 87 2 3 0 2 8 87
9 3 5 135 1 2 3 4 7 138
10 33 75 967 7 9 46 40 84 1013
11 2 6 83 0 1 0 2 7 83
Total 77 213 2831 33 57 256 110 270 3079
TABLE II
METRICS USED IN REVISION HISTORY BASED ALLOCATION STRATEGIES
Module LoC (75%)LoC Changes (75%)~LoC Cageshags2%Bugs (75%)xChanges(25%)
1 0.0345 0.0828 2.0833
2 0.0074 0.0295 0.2500
3 0.0556 0.1889 5.5882
4 0.0556 0.1889 4.1176
5 0.0061 0.0122 0.5000
6 0.0195 0.0519 0.7500
7 0.0274 0.0959 0.0000
8 0.0000 0.0575 0.0000
9 0.0222 0.0370 1.2000
10 0.0341 0.0776 3.9600
11 0.0241 0.0723 0.3333
TABLEIII
MODULESALLOCATION STRATEGIES AND RESULTS
AllocationStrategy Modules LoC (100%) Detected Bugs Efficiency
Optimal 1, 3, 4, 8,9 933 24 100%
BugDensity (75%) 1, 3, 4, 7, 11 937 21 87.50%
Change Density(75%) 1, 3, 4,7, 11 937 21 87.50%
Bugs/Changes(75%)* Changes(25%) 1, 3, 4, 9, 11 929 22 91.67%
Random 1, 4,5,7, 11 958 9 37.50%
ACKNOWLEDGMENT [3] Kolodny, "Networksonchips keeping upwithrentsrule and moores law", 2007.
This work is supported by CNPq/Brazil under grant PNM [4] Bob Bentley, Kurt Baty, Kevin Normoyle, Makoto Ishii, and Einat (#141201/2005-3). The authors would like to thank the stu- Yogev, "Verification: What Works and What Doesn't", in Proceedings dentswhich volunteered to take partin the
experiment,
espe- [5] Rolfof DesignDrechsler, Advanced FormalAutomation Conference,2004.Verification, Kluwer Academiccially Celina Gomes andThiago Coelho. Publishers, 2004.
[6] Harry Foster, Adam C. Krolnik, and David J. Lacey, Assertion-Based
REFERENCES Design, Kluwer Academic Publishers, 2004.
[7] B. Beizer, "The Pentium Bug - an Industry Watershed", Testing [1] Raja Mitra, "Efficient Computing and Advanced Visualization Accel- Techniques Newsletter, TTN, September 1995.
erates Electronic Design", EETimes - Global News for the Creators of [8] M. Hachman, "Boot-up bug discovered in Intel's desktop Coppermine Technology, April 2007. chips", http://www.my-esm.com, December 1999.
[10] M. Hachman, "Bug found in Intel's Itanium 2 could cause data loss", http://www.extremetech.com, May 2003.
[11] "AMD Opteron bug can cause incorrect results",
http://www.theinquirer.net, June2004.
[12] "IBM Power PC 1GHz chip only runs properly at 933 MHz",
http://www.theinquirer.net, August 2004.
[13] "Version Management with CVS", Available at http://ximbiot.com/cvs/manual/, 2007.
[14] Ben Collins-Sussman and Brian W. Fitzpatrick and C. Michael Pilato, "Version Control with Subversion", Available at
http://svnbook.red-bean.com/, 2007.
[15] Andreas Zeller, "Where do bugs come from?", Electron. Notes Theor Comput. Sci., vol. 174,no. 4, pp.55-59,2007.
[16] Ahmed E. Hassan and Richard C. Holt, "The top ten list: Dynamic fault prediction", in ICSM '05: Proceedings of the 21stIEEEInternational
Conference on Software Maintenance (ICSM'05), Washington, DC, USA, 2005,pp.263-272,IEEEComputer Society.
[17] Taghi M. Khoshgoftaar and Edward B. Allen, "Ordering fault-prone softwaremodules", Software Quality Control, vol. 11,no.1, pp. 19-37, 2003.
[18] T. Khoshgoftaar and E. Allen, "Predicting the order of fault-prone modules in legacy software", in ISSRE '98: Proceedings of the The Ninth International Symposium on Software Reliability Engineering, Washington, DC, USA, 1998, p. 344,IEEEComputer Society. [19] R. Kumar, S. Rai,, and J. L. Trahan, "Neural-network techniques
for software-quality evaluation", in Proc. of 1998 Reliability and Maintainability Symposium, 1998, pp. 155-161.
[20] Robert M. Bell, "Predicting the location and number of faults in large softwaresystems",IEEETrans.Softw. Eng., vol. 31,no.4, pp.340-355,
2005.
[21] Thomas J. Ostrand, Elaine J. Weyuker, and Robert M. Bell, "Where thebugs are", in ISSTA '04: Proceedings of the 2004 ACM SIGSOFT international symposiumon Software testing and analysis, New York, NY,USA, 2004, pp. 86-96, ACM.
[22] Todd L. Graves, Alan F. Karr, J. S. Marron, and Harvey Siy, "Predicting fault incidenceusing software change history",IEEETrans.Softw. Eng., vol. 26,no. 7, pp. 653-661,2000.
[23] Nachiappan Nagappan and Thomas Ball, "Use of relative code churn measures topredict system defect density", in ICSE '05: Proceedings of the 27thinternational conference onSoftware engineering, New York, NY,USA, 2005,pp.284-292, ACM.
[24] David Van Campenhout, Trevor Mudge, and John P. Hayes, "Collection andanalysisofmicroprocessors design errors", IEEEDesign & Testof Computers,vol. 17,no. 4,pp.51-60, 2000.
[25] Miroslav N.Velev, "Collection of high-level microprocessor bugs from formal verification ofpipelined and superscalar designs", in ITC'03:
InternationalTestConference, 2003, pp. 138-147.
[26] MIPS Technologies, "MIPS32 Architecture For Programmers Volume
II:TheMIPS32 InstructionSet", 2005.
[27] Michael Garey and David S. Johnson, Computers and Intractability: A Guidetothe Theory of NP-Completeness, W.H.Freeman, 1979. [28] Silvano Martello and Paolo Toth, Knapsack Problems: Algorithms and