Heron,
Egretta caerulea
, in Cananéia, Brazil
Moralez-Silva, E.
a,b*, Silva, FJL.
a,cand Monteiro-Filho, ELA.
b,d aPós-Graduação em Psicobiologia, Estudos do Comportamento,Universidade Federal do Rio Grande do Norte – UFRN, Natal, RN, Brazil
bInstituto de Pesquisas Cananéia – IPeC, Cananéia, SP, Brazil
cLaboratório de Sistemática e Ecologia Animal, Departamento de Ciências Biológicas, Universidade do Estado do Rio Grande do Norte – UFRN,
Mossoró, RN, Brazil
dSetor de Ciências Biológicas, Departamento de Zoologia, Centro Politécnico, Universidade Federal do Paraná – UFPR,
Curitiba, PR, Brazil *e-mail: manubioufpr@yahoo.com.br
Received July 22, 2008 – Accepted October 22, 2008 – Distributed May 31, 2010 (With 3 figures)
Abstract
Habitat use by the Little Blue Heron (Egretta caerulea) and discovery of feeding territoriality are discussed here.
The results showed the existence of a territorial individual defending an area (2,564.46 ± 943.56 m2) close to the
mangrove, and non-territorial individuals (9.17 ± 2.54) in the rest of a demarcated area (mean area for the non-ter-ritorial: 893.25 ± 676.72). A weak positive correlation (r = 0.47, df = 46, p < 0.05) was found between the over-lapping of territorial and non-territorial individuals (2.85 ± 3.07 m2) and the mean overlapped area for
territori-al individuterritori-als (171.41 ± 131.40 m2). Higher capture (1.52 ± 1.14 × 1.00 ± 1.37 catches/minutes) and success rates
(0.45 ± 0.31 × 0.21 ± 0.27) and lower energy expenditure rates (45.21 ± 14.96 × 51.22 ± 14.37 steps/minutes; and 3.65 ± 2.55 × 4.94 ± 3.28 stabs/minutes) were observed for individuals foraging in areas close to the mangrove. The results suggest that the observed territorial behaviour is more related to a number of food parameters than to intruder pressure, and also that the observed territoriality might be related to defense of areas with higher prey availability.
Keywords: used area, estuary, defense, foraging behaviour, territory.
Desvendando territorialidade alimentar na Garça-Azul,
Egretta caerulea
, em Cananéia, Brasil
Resumo
Uso do habitat pela garça-azul (Egretta caerulea) e a descoberta da territorialidae alimentar são discutidos aqui. Os
resultados apontaram para a existência de um indivíduo territorial defendendo uma área (2.564,46 ± 943,56 m2)
pró-xima ao manguezal e indivíduos não-territoriais (9,17 ± 2,54) no restante de uma área demarcada (média das áreas para os não-territoriais: 893,25 ± 676,72). Uma correlação positiva fraca (r = 0,47, df = 46, p < 0,05) foi encon-trada entre a sobreposição de indivíduos territoriais e não-territoriais (2,85 ± 3,07 m2) e a média de área
sobrepos-ta para indivíduos territoriais (171,41 ± 131,40 m2). Maiores taxas de captura (1,52 ± 1,14 × 1,00 ± 1,37 capturas
/minutos) e sucesso (0,45 ± 0,31 × 0,21 ± 0,27 capturas/tentativas de captura) e menores taxas de gasto energético (45,21 ± 14,96 × 51,22 ± 14,37 passos/min; e 3,65 ± 2,55 × 4,94 ± 3,28 tentativas de captura/min) foram registradas para indivíduos forrageando em áreas mais próximas do manguezal. Os resultados sugerem que o comportamento territorial ob-servado tem mais relação com alguns parâmetros alimentares do que com a pressão de intrusos. Assim como a territorialidade observada pode estar relacionada com a defesa de áreas que contém alta disponibilidade de presas.
1. Introduction
The Little Blue Heron (Egretta caerulea,Linnaeus,
1758) is a species found in all the Americas. It has a more coastal distribution in South America, and yet is often found in estuarine systems (Sick, 1997). Its behaviour and ecology have been well-studied in other parts of the continent (Recher and Recher, 1969; Kushlan, 1978a; Werschkul, 1979, 1982; Rodgers, 1980a,b, 1987; Erwin, 1983; Caldwell, 1986; Pyle and Howell, 2004; and oth-ers), but specific studies of its foraging behaviour, with respect to the dynamics and not foraging strategies per se (Kushlan, 1976, 1978b; Willard, 1977; Rodgers, 1983; Kelly et al., 2003) have not yet been well assessed.
Moreover, studies on this species in recent years have been few, especially in South America (Olmos et al., 2001; Olmos and Silva e Silva, 2002).
Use of the feeding site is related to its physical and biological features, in which the characteristics of the prey are a very important factor (Kushlan, 1981, Gawlik, 2002). According to Kushlan (1981), ciconiiforms aggregate in an area of high prey availability, and are somewhat attract-ed by other birds, especially white species (Kushlan, 1977, 1979; Caldwell, 1981; Smith, 1995). Thus, the relation-ships that an individual has with others (Ricklefs, 2001) are very important for the outcome of its behavioural suc-cess and consequent fitness, which, in turn, affects survival and reproduction rates (Alcock, 2005).
Defense of an important resource, be it nest material, food supply, mate, and so on, is an important factor in increasing the individual’s chances of success. According to Noble (1939), the defense of any area characterises it as a territory; further, it is in agreement with the definition that a territory is a fixed space from which an individual or group of mutually tolerant individuals excludes com-petitors from a specific resource or resources (Maher and Lott, 1995). To demonstrate the existence of a territory in a given species, three criteria must be simultaneously met (Brown and Orians, 1970): it must be (i) exclusive, (ii) fixed and (iii) actively or passively defended against intruders. These three factors have been found in the ter-ritorial behaviour of various species of vertebrates, and observed for different groups of birds (Maher and Lott, 2000).
It is well known that colonial breeding birds, includ-ing the ciconiiforms, defend the nest site and its immedi-ate surroundings (Nice, 1941). These territories have been observed in almost every species whose breeding biology has been studied. On the other hand, the feeding territori-ality of this group has been little documented. Two of the few species that have had their territorial behaviour stud-ied are the Grey Heron (Ardea cinerea Linnaeus, 1758) by Richner (1986) in Scotland and Marion (1989) in France, and the Little Egret (Egretta garzetta Linnaeus, 1766) by
Yamada (1994) and Nota (2003) in Japan. In this study, the following were investigated: (1) feeding territoriality, (2) territorial defense behaviour, and (3) habitat occupan-cy and use during foraging.
2. Material and Methods
2.1. Study area
The study was conducted in the Iguape-Cananéia estuarine lagoon system, a large system, approximately 110 km long, located on the south coast of São Paulo State in southeastern Brazil (25° 00’-25° 04’ S and 47° 54’-47° 56’ W). This system comprises three islands: Ilha de Cananéia, Ilha Comprida and Ilha do Cardoso, which form channels that are connected to the open sea (Figure 1a).
The predominant vegetation in the channels is man-grove, composed of three main species: black manman-grove,
Avicennia schaueriana (Stapf and Leechm); red
man-grove, Rhizophora mangle (Linnaeus); and white
man-grove, Laguncularia racemosa (Linnaeus)
(Schaeffer-Novelli et al., 1990). Mud banks are very common on the
channel margins. These are lined with a few species of the poaceae gender Spartina, which are adapted to live in estuarine regions (Schaeffer-Novelli et al., 1990). The
mud banks are under the influence of the tidal cycles, that is, exposed at low tide and covered at high tide.
A specific mud bank on Ilha de Cananéia, called Brocuanha mud bank, was used for this study. It is lo-cated at the south end of the island, near the city, and is approximately 1500 × 110 m (bold triangle, in Figure 1a). This area is used year-round as a feeding site by different species of herons and egrets.
2.2. Determination of the used areas
To determine the used areas of different individuals, an area of approximately 12,600 m2 of the Brocuanha mud
bank was demarcated with 24 wooden sticks –1.50 or 2.50 m long and 5 cm thick– painted with miniumfor durability. A small wooden plaque – 15 × 10 × 4 cm – also covered with minium and painted and numbered with ink was placed on top of each stick.
The sticks were placed on the mud bank, at high tide, in three lines parallel to the margin. For the first line, clos-est to the margin, 8 sticks measuring 1.50 m were placed 30 m apart. The second line (8 sticks measuring 2.50 m) was placed 30 m from the first and the third (8 sticks measuring 2.50 m) 30 m from the second, in the direction of the channel. As in the first line, the sticks were placed 30 m apart, forming 14 quadrants (30 × 30 m each), in two lines of 7 quadrants, side by side (e.g., Figure 1b). The observation point was on an existing pier, which was used as a reference for measuring the distance of the first two sticks; thus, it was located in the centre of the demarcated area. With this quadrant distribution it is possible to as-sess the distribution of individuals inside a specific area of the feeding site.
using the demarcated area for foraging (mean = 9.17, Lower 95% = 8.45, Upper 95% = 9.89) were followed, simultaneously and by the naked eye (during the whole time the individual stayed inside the area), and their tra-jectory was continuously recorded on a worksheet con-taining the quadrant layout. That is possible due to the foraging method of the species, which is by a continu-ously slow walking (locomotion of ≤ 1 step/seconds, cf. Rodgers 1983). At the beginning of the session, each indi-vidual inside the demarcated area received an identifica-tion number, for its identificaidentifica-tion on the worksheet, and its trajectory would be registered until the end of the ses-sion or until the individual left the demarcated area. When an individual left the demarcated area, it would no longer
be recorded, and when a new individual entered the de-marcated area (during the current observation session), recording would begin. It is important to establish that in-dividuals were not captured and marked artificially. These were only differentiated from each other, by the observer, by its location in the demarcated area. Combining the low number of individuals simultaneously foraging inside the demarcated area (mean = 9.17, Lower 95% = 8.45, Upper 95% = 9.89) with the slow walking method of foraging by the species, the accompaniment of individuals foraging simultaneously in the demarcated area and the register of their trajectories was possible. Since the individuals were not marked, it was impossible to distinguish one from an-other, so one individual might leave the demarcated area
a
b
and return during the same session and be recorded twice. This probably happened a few times during the study.
The area used by different individuals was determined using the minimum convex polygon method (MCP). The data from the polygons were than transferred to AutoCAD LT 2006 software to determine the size of the used areas of different individuals. It was then possible to calculate both the size of the overlapped areas between individuals and the overlapping percentage between them. For this quantification we used only the data from the individuals that spent more than 66.66%, or 20 minutes, of the session time (30 minutes) foraging inside the demarcated area, to have a significant quantity of data for each individual.
We opted for the non-parametric Wilcoxon test to com-pare the sizes of the overlapped areas of territorial and non-territorial individuals because the variances between the two groups were considered too large (Bartlett test, F = 176.47; p < 0.05) and because the n of the groups varied widely.
Pearson’s correlation was performed between the av-erage number of individuals in the demarcated area, the average overlapped area for territorial individuals and the amount of overlapping between territorial and non-territorial individuals. For all tests the significance level was set at α = 0.05.
2.3. Determination of foraging parameters
According to Kushlan (1978a), foraging effort, and con-sequently energy expenditure of foraging Little Blue Herons, can be assessed by the number of steps that an individual takes and by the number of stabs that it gives in one minute. Foraging success of an individual can be assessed by the number of catches in one minute and by the rate of catches per stabs. Following this method, we collected data for all these parameters from Little Blue Herons foraging in three different areas of the Brocuanha mud bank. The first, des-ignated sector 1, was the area between the first and second line of sticks in the demarcated area. The second sector was the area between the second and third line of sticks. Sector 3 was the area behind the third line of sticks. Sectors 1 and 2 covered around half of the mud bank width, and sector 3, the other half (e.g., Figure 1b).
Kruskal-Wallis one-way ANOVA test was performed for all four foraging tests to compare the three sectors and the significance level was set at α = 0.05.
2.4. Observation effort
The study had a total of 120 observation hours, from May 2005 to February 2006.
3. Results
3.1. Foraging parameters
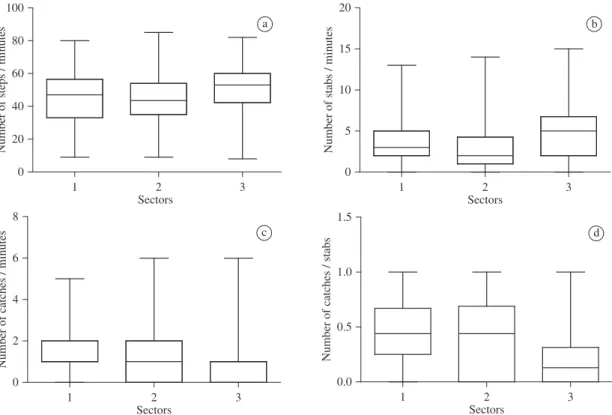
Individuals foraging in sector 1 and 2 made less ef-fort at capture. The number of steps per minute (sector 1 - 45.21 ± 14.96; sector 2 - 44.19 ± 13.63: Kruskal-Wallis test, H = 18.20; p < 0.05; N-number of observations = 335) and the number of stabs per minute ( sector 1 - 3.65 ± 2.55; sector 2 - 3.25 ± 2.93: N = 335; H = 21.19; p < 0.05) for
these individuals was significantly lower than that of indi-viduals foraging in sector 3 (51.22 ± 14.37 steps/ minutes; 4.94 ± 3.28 stabs/minutes) (Figure 2a and 2b). By contrast, individuals foraging in sector 3 had less foraging success. The number of catches per minute (N = 318; H = 21.95; p < 0.05) and the rate of catches per stabs (N = 318; H = 39.30; p < 0.05) for sector 3 (1.00 ± 1.37 catch-es/minutes; 0.21 ± 0.27 catches/stabs) individu-als was significantly lower than that of individuindividu-als foraging in sectors 1 (1.52 ± 1.14 catches/minutes; 0.45 ± 0.31 catches/stabs) and 2 (1.45 ± 1.37 catches/minutes; 0.44 ± 0.36 catches/stabs) (Figures 2c and 2d).
3.2. Territorial behaviour
Inside the demarcated area, one individual defend-ing a feeddefend-ing territory was observed every day. This in-dividual would arrive in the area at the beginning of the feeding period, when low tide had begun to expose the mud bank, and defend a particular area until the end of the feeding period, when high tide had already covered the mud bank.
All the other individuals in the demarcated area would not exhibit this behaviour, given that they were non-territorial. These individuals would also arrive at the beginning of the feeding period and stay until its end, oc-cupying the same areas simultaneously but not exhibiting defensive behaviour. The territorial individual expelled any others that would enter the patrolled area (Figure 3c), be they adults or immatures. Figures 3a and b show two of the 30 minutes observation periods. The dashed line represents territorial individuals and the continuous line, non-territorial individuals that used the area during these observational sessions. The area defended by territorial individuals occupied sector 1 and part of sector 2, the mud bank area closest to the mangrove.
Table 1 shows used area sizes of territorial and non-territorial individuals, as well as the sizes and percent-ages of overlapped areas between them and between non-territorial individuals themselves. It can be observed that the total area for territorial individuals is larger than that of non-territorial ones (Wilcoxon test, N = 1096; Z = –10.01; p < 0.05), and that the percentage of over-lapped area is smaller for territorial individuals than it is for non-territorial ones.
The total area patrolled by territorial individuals was approximately 8,800.56 m2. The defended area, from
which they kept others out entirely, was about 1,849.64 m2.
The area patrolled by territorial individuals corresponds to approximately 5.87% of the mud bank area (approximately 150,000 m2) (in Figure 3c there is a schematic
representa-tion of the areas, with their respective sizes). If we consider the average number of individuals feeding on the mud bank (137 individuals) from May to August (the months with the largest number of individuals), then the area per individual, excluding the 1,849.64 m2 defended by territorial
individu-als, is about 1,081.39 m2.
a b
c d
Figure 2. a) Number of steps taken by Little Blue Herons foraging in the three different sectors of the mud bank, in the Cananéia estuary; b) Number of stabs taken by Little Blue Herons foraging in the three different sectors of the mud bank; c) Number of catches obtained by Little Blue Herons foraging in the three different sectors of the mud bank; and d) Success rate (catches/stabs) of individuals foraging in the three different sectors of the mud bank. Values are given as median, with the whiskers representing minimum to maximum values.
Lower 95% = 8.45; Upper 95% = 9.89) and the aver-age overlapped area for territorial individuals (Table 1) was not significant (Pearson coefficient r = 0.03; df = 46; p > 0.05; N = 120); and between the average number of individuals in the demarcated area and the amount of over-lapping between territorial and non-territorial individuals (mean = 2.85; Lower 95% = 2.33; Upper 95% = 3.38), it was also not significant (N = 120; r = 0.14; df = 46; p > 0.05). A weak correlation between the amount of over-lapping between territorial and non-territorial individuals and the average overlapped area for territorial individuals was observed (N = 120; r = 0.47; df = 46; p < 0.05).
On 100% of the days from May to August, a territorial individual was present on the mud bank, always defend-ing the same area (Figures 3a, b and c). However, from September to December, a territorial individual was absent on 100% of the days, that is, no defense was observed.
4. Discussion
Territoriality is difficult to prove because of the tenu-ous difference between aggressive behaviour of a territori-al individuterritori-al and defense of individuterritori-al distances between individuals (Marion, 1989). However, to demonstrate territoriality in herons, one needs to follow identifiable individuals over a significant period using a marking sys-tem that can be located from a distance (Marion, 1989).
a
b
c
Figure 3. a/b) Results of two of the 120 30-min observation
With the method used here, we were able to demonstrate the territoriality of the Little Blue Heron without having to mark individual birds, and from a very close distance to the feeding site and the birds. This is likely because the species in the area is very docile, in the sense of al-lowing the presence of the observer, and also because of the consistent use of the same feeding area by territorial individuals.
The sticks method can give us an accurate territory size, since the points used to create the polygon are taken from the observation of the trajectory of one individu-al followed by an observer over a period of time. This method differs from that of territory and home range sizes based on spot observations of the male or the reproductive pair of a bird species or on the various capture points of a mammal (Odun and Kuenzler, 1955).
Our observations led us to define the territorial indi-viduals as such, given that their behaviour met the three simultaneous conditions proposed by Brown and Orians (1970) as being essential when attempting to show terri-toriality. The first states that a territory must show a slow change over time, or be fixed; which was clearly demon-strated for the Little Blue Herons studied here. The sec-ond concerns exclusivity, another csec-ondition verified here. And the third condition, which was also observed in our study, is the active or passive defense of the area against rivals.
Since the territorial behaviour of the Little Blue Heron was observed outside the reproductive season in the winter, it can be suggested that this territory is a kind of winter territory (or type E) used in the feeding ground (Nice, 1941; Wilson, 1975).
The concept of economic defendability proposed by Brown (1964) and its effect on evolution and adaptive sig-nificance of territoriality is a more accepted solution in ex-plaining the diversity of territorial systems in different spe-cies (as discussed by Verner, 1977). In light of Darwin’s natural selection theory, this concept shows the relevance of the individual’s behaviour in enhancing its survival and reproduction, as well as its contribution to the next gen-eration’s gene pool, or its inclusive fitness (Alcock, 2005). According to Davis and Houston (1984), “the concept of economic defendability states that we would only expect an animal to spend time and energy interacting with others to defend a territory when this yields greater net benefits
than an alternative behaviour, for example, ignoring others in the population and spending the whole time exploiting the resource”. If, other than the defended area (restricted use) of territorial individuals, the other individuals feed-ing in the mud bank have been left with approximately 1.081.39 m² per foraging individual, and if, as we ob-served, more territorial individuals could inhabit the mud bank, then these areas might be even smaller and almost totally overlapped (increase of overlapping in the use of resources among individuals). Thus, the territorial behav-iour of territorial individuals could actually be paying off, since they defend an area of exclusive use larger than the area available for each non-territorial individual, and in an area within the mud bank that could contain more prey (see discussion below).
Since we are still at the beginning of the study on ter-ritorial behaviour of the Little Blue Heron, it is premature to think that we have general and wide-ranginganswers to explain the adaptiveness or evolution of this system. But we can attempt to understand some of the reasons that might lead a Little Blue Heron to defend a particular mud bank area in a very productive estuary. Since we are deal-ing with a feeddeal-ing territory, what is bedeal-ing defended here is the food resource and access to it. According to Brown and Orians (1970), it is generally assumed that food is the resource defended when territories are established away from the breeding area. Davies and Houston (1984) point out that one of three factors favouring territoriality is re-source quality and distribution. One of the many reasons that can lead an animal to defend a certain part of a feed-ing site is the high availability of prey in this area, which can provide it with more prey at less energy expenditure (Davis, 1978). Varoli and Souza (1990), in a study of benthonic macro fauna on a series of mud banks in the Iguape-Cananéia estuarine lagoon system, found that the areas closest to the margin (the mangroves) had greater numbers of polychaetes, mollusks, isopods, decapods, among others. These organisms are a rich prey source for herons and other bird species. Our data on the foraging parameters show that sectors 1 and 2, corresponding to approximately half of the mud bank width, yields greater gains with less energy expenditure to individuals foraging inside it than those obtained by individuals foraging in the other half (sector 3). The territory of territorial individuals extends from sector 1 to a part of sector 2, which includes
Table 1. Values of the sizes of used areas for territorial and non-territorial individuals (average total area); average overlapped area between non-territorial and territorial individuals, and between non-territorial individuals themselves; as well as overlapping per-centage for territorial and non-territorial individuals for feeding Little Blue Herons in Cananéia, southeastern Brazil. N values refer to the 30 minutes data collection sessions.
n Average total area
(m²)
SD Lower 95%
Upper 95%
Average overlapped
area ( m²)
SD Lower 95%
Upper 95%
Overlapping percentage
(%)
SD Lower 95%
Upper 95%
territorial 120 2564.46 943.56 2375.71 2753.21 171.41* 131.40 144.78 198.03 8.48 5.90 7.30 9.66
non- territorial
976 893.25 676.72 830.99 957.51 633.98 560.67 580.58 687.37 66.80 22.71 64.65 68.96
precisely the area reported by Varoli and Souza (1990) as the area with greatest prey availability on the mud banks. This suggests that territorial herons defend patches of abundant food resources that might supply them with unique energetic benefits, as observed by Turpie (1995) and Tripp and Collazo (1997). This could be one of many possible explanations for why an individual defends an area on the Brocuanha mud bank.
The correlations do not signify a cause and effect re-lationship, but they can be considered. It is plausible to suppose that there could be some relation between the number of individuals inside the demarcated area and the number of overlaps between territorial and non-territorial individuals, and the mean size of the overlapping between them. Many more individuals present in the area, an in-crease in the density of individuals (potential competitors), would likely increase these relations, as observed by some researchers in studies of intruder’s pressure on territory size (Myers et al., 1979; Ewald et al., 1980; Norton et al., 1982; Dunk and Cooper, 1994; Tripp and Collazo, 1997; Wronski and Plath, 2006). However it does not seem to be the case here. On the other hand, the positive correlation found between the amount of overlapping and the mean size of the overlapped area for territorial individuals could be interpreted as meaning that a possible increase in the number of individuals in the area might increase the size of the total area that the intruders might occupy. These results suggest that the intruder density does not have such an important role in the territorial behaviour of the Little Blue Heron on the Brocuanha mud bank, and that some prey characteristics play a more significant role (see dis-cussion on this subject in Myers et al., 1979; Hixon, 1980;
Tripp and Collazo, 1997).
Territoriality in colonial birds is widely accepted (Nice, 1941), mainly during the reproductive period, with the area surrounding the nest considered the territory. But true feeding territories have been proven for the Little Egret (Yamada, 1994; Nota, 2003), Grey Heron (Richner, 1986; Marion, 1989), Reef Heron(Egretta sacra Gmelin,
1789) (Recher, 1972), and as we also found, for the Little Blue Heron. Hancock and Kushlan (1984) report that the Goliath Heron (Ardea goliath Cretzschmar,
1827), Black Heron (Egretta ardesiaca Wagler, 1827),
Tricolored Heron(Egretta tricolor Statius Muller, 1776),
and Black-crowned Night Heron(Nycticorax nycticorax
Linnaeus, 1758) also exhibit feeding territoriality. Lowe (1983) also observed the White-faced Heron (Egretta novaehollandiae Latham, 1790) defending feeding
ter-ritories in mudflat areas. However, the data confirming these observations are unclear. Kushlan et al. (1982)
sug-gest the possible aggressive defense of foraging patches (possible territories) by the Whistling Heron (Syrigma sibilatrix Temminck, 1824); as was also suggested for the
Snowy Egret (Egretta thula Molina, 1782) (Maccarone and Parsons, 1994; Brzoradet al., 2004). For the Little Blue Heron, Palmer (1962) reported that individuals vig-orously defend feeding territories outside the reproduc-tive period. As in the cases cited above, this was still too
little information to confirm the existence of feeding ter-ritories for the species. However, the results found here do confirm this existence.
Our observations showed that in one day of obser-vation, the individual defending the territory on the mud bank was always the same, since it arrived at the begin-ning of the feeding period and stayed until the end. Future studies should consider marking individual birds that visit the feeding site to assess possible area fidelity throughout an entire season.
Acknowledgements — We thank the Instituto de Pesquisas Cananéia (IPeC) for their material, logistical and material support. We thank Thelicia Silva for the support with the AutoCAD LT 2006 software. We also thank the anonymous reviewer for the insightful suggestions on the manuscript. We are grateful to the Coordenação de Aperfeiçoamento de Pessoal de Nível Superior (CAPES), which provided financial support in the form of a scholarship.
References
ALCOCK, J., 2005. Animal behavior: an evolutionary approach.
7 ed. Sunderland: Sinauer Associates Inc.BROWN, JL., 1964. The evolution of diversity in avian territorial systems. Wilson Bulletin, vol. 76, no. 2, p. 160-169.
BROWN, JL., 1964. The evolution of diversity in avian territorial systems. Wilson Bulletin, vol. 76, no.2, p. 160-169.
BROWN, JL. and ORIANS, GH., 1970. Spacing patterns in mobile animals. Annual Review of Ecological Syztematics, vol. 1, p. 239-262.
BRZORAD, JN., MACCARONE, D. and CONLEY, K., 2004. Foraging energetics of Great Egrets and Snowy Egrets. Journal of Field Ornithology,vol. 75, no. 3, p. 266-280.
CALDWELL, GS., 1981. Attraction to tropical mixed-species heron flocks: proximate mechanisms and consequences. Behavioural Ecology Sociobiology, vol. 8, no. 2, p. 99-103.
CALDWELL, GS., 1986. Predation as selective force on foraging herons: effect of plumage color and flocking. Auk, vol. 103, no. 3,
p. 494-505.
DAVIS, NB., 1978. Ecological questions about territorial behaviour.
In KREBS, JR. and DAVIS, NB. (Eds.). Behavioural ecology: an evolutionary approach. 1ed. Oxford: Blackwell Scientific Publications. p. 245-281.
DAVIS, NB. and HOUSTON, AI., 1984. Territory economics. In KREBS, JR. and DAVIS, NB. (Eds.). Behavioural ecology: an evolutionary approach. 2 ed. Oxford: Blackwell Scientific Publications. p. 148-169.
DUNK, JG. and COOPER, RJ., 1994. Territory-size regulation in Black-shouldered Kites. Auk, vol.111, no. 3, p. 588-595.
ERWIN, RM., 1983. Feeding habitats of nesting wading birds: spatial use and social influences. Auk, vol. 100, no. 4, p. 960-970.
EWALD, PW., HUNT Jr., GL. and WARNER, M., 1980. Territory size in Western Gulls: importance of intrusion pressure, defense investments, and vegetation structure. Ecology, vol. 61, no. 1,
p. 80-87.
GAWLIK, DE., 2002. The effects of prey availability on the numerical response of wading birds. Ecological Monographs, vol. 72, no. 3, p. 329-346.
KELLY, JF., GAWLIK, DF. and KIEEKBUSCH, DK., 2003. An updated account of wading bird foraging behavior. Wilson Bulletin, vol. 115, no. 1, p. 105-107.
KUSHLAN, JA., 1977. The significance of plumage colour in the formation of feeding aggregations of Ciconiiforms. Ibis, vol. 119, no. 3, p. 361-364.
KUSHLAN, JA., 1978a. Commensalisms in the Little Blue Heron.
Auk, vol. 95, no. 4, p. 677-681.
KUSHLAN, JA., 1978b. Feeding ecology of wading birds. In SPRUNT, A., OGDEN, JC., WINCKLER, S. (Eds.). Wading Birds.
New York: National Audubon Society. p. 249-297. (Report no. 7).
KUSHLAN, JA., 1979. Feeding ecology and prey selection in the With Ibis. Condor, vol. 81, no. 4, p. 376-389.
KUSHLAN, JA., 1981. Resource use strategies of wading birds.
Wilson Bulletin, vol. 93, no. 2, p. 145-163.
KUSHLAN, JA., HANCOCK, JA., PINOWSKI, J. and PINOWSKA, B., 1982. Behavior of Whistling and Capped Herons in the seasonal savannas of Venezuela and Argentina. Condor, vol. 84, no. 3, p. 255-260.
LOWE, KW., 1983. Feeding behaviour and diet of the White-faced Heron Ardea novaehollandiae in Westernport Bay, Victoria. Corella,
vol. 7, no. 5, p. 101-108.
MACCARONE, AD. and PARSONS, KC., 1994. Factors affecting the use of freshwater and estuarine foraging habitats by breeding wading birds in New York City. Colonial Waterbirds, vol. 17, no. 1,
p. 60-68.
MAHER, CR. and LOTT, DF., 1995. Definitions of territory used in the study of variation in vertebrate spacing system. Animal Behaviour, vol. 49, no. 6, p. 1581-1597.
MAHER, CR. and LOTT, DF., 2000. A review of ecological determinants of territoriality within vertebrate species. American Midland Naturalist, vol. 143, no. 1, p. 1-29.
MARION, L., 1989. Territorial feeding and colonial breeding are not mutually exclusive: the case of the Grey Heron (Ardea cinerea).
Journal of Animal Ecology, vol. 58, no. 2, p. 693-710.
MYERS, JP., CONNORS, PG. and PITELKA, FA., 1979. Territory size in wintering sanderlings: the effect of prey abundance and intruder pressure. Auk, vol. 96, no. 3, p. 551-561.
NICE, MM., 1941. The role of territory in bird life. American Midland Naturalist, vol. 26, no. 3, p. 441-487.
NOBLE, GK., 1939. The role of dominance in the life of birds. Auk, vol. 56, no. 3, p. 263-273.
NORTON, ME., ARCESE, P. and EWALD, PW., 1982. Effect of intrusion pressure on territory size in Black chinned Hummingbirds (Archilochus alexandri). Auk, vol. 99, no. 4, p. 761-764.
NOTA, Y., 2003. Effects of body size and sex on foraging territoriality of the Little Egret (Egretta garzeta) in Japan. Auk, vol. 120, no. 3,
p. 791-798.
ODUN, EP. and KUENZLER, EJ., 1955. Measurement of territory and home range size in birds. Auk, vol. 72, no. 2, p. 128-137.
OLMOS, F., SILVA e SILVA, R. and PRADO, A., 2001.Breeding season diet of Scarlet Ibises Eudocimus ruber and Little Blue Herons
Egretta caerulea in a Brazilian mangrove. Waterbirds, vol. 24, no. 1, p. 50-57.
OLMOS, F. and SILVA e SILVA, R., 2002. Breeding biology of the Little Blue Heron (Egretta caerulea) in southeastern Brazil.
Ornitologia Neotropical, vol. 13, no. 1, p. 17-30.
PALMER, RS., 1962. Handbook of North American Birds. New Haven: Yale University Press. (vol. 1, Loons through Flamingos).
PYLE, P. and HOWELL, SG., 2004. Ornamental plume development and the “prealternate molts” of herons and egrets. Wilson Bulletin,
vol. 116, no. 4, p. 287-292.
RECHER, HF., 1972. Territorial behaviour of the Reef Heron
Egretta sacra. Emu, vol. 72, no. 4, p. 126-130.
RECHER, HF. and RECHER, JA., 1969. Comparative foraging efficiency of adult and immature Little Blue Heron (Florida caerulea). Animal Behaviour, vol. 17, no. 1, p. 320-322.
RICHNER, H., 1986. Winter feeding strategies of individually marked herons. Animal Behaviour, vol. 34, no. 3, p. 881-886.
RICKLEFS, RE., 2001. The economy of nature. 5 ed. New York:
W. H. Freeman.RODGERS Jr., JA., 1980a. Breeding ecology of the Little Blue Heron on the west coast of Florida. Condor, vol. 82, no. 2, p. 164-169.
RODGERS Jr., JA., 1980b. Little blue heron breeding behavior. Auk,
vol. 97, no. 2, p. 371-384.
RODGERS Jr., JA., 1983. Foraging behavior of seven species of herons in Tampa Bay, Florida. Colonial Waterbirds, vol. 6, no. 1, p. 11-23.
RODGERS Jr., JA., 1987. Breeding chronology and reproductive success of Cattle Egrets and Little Blue Herons on the west coast of Florida, USA. Colonial Waterbirds, vol. 10, no. 1, p. 38-44.
SCHAEFFER-NOVELLI, Y., MESQUITA, HSL. and CINTURÓN-MOLERO, G., 1990. The Cananéia Lagoon Estuarine System, São Paulo, Brazil. Estuaries, vol. 13, no. 2, p. 193-203.
SICK, H., 1997. Ornitologia Brasileira: uma introdução. Rio de Janeiro: Nova fronteira. SMITH, JP., 1995. Foraging flights and habitat use of nesting wading birds (Ciconiiformes) at Lake Okeechobee, Florida.
Colonial Waterbirds, vol. 18, no. 2, p. 139-158.
TRIPP, KJ. and COLLAZO, JA., 1997. Non-breeding territoriality of semipalmated sandpipers. Wilson Bulletin, vol. 109, no. 4, p. 630-642.
TURPIE, JK., 1995. Non-breeding territoriality: causes and consequences of seasonal and individual variation in grey plover
Pluvialis squatarola behaviour. Journal of Animal Ecology, vol. 64, no. 4, p. 429-438.
VAROLI, FMF. and SOUSA, ECPM., 1990. Macrofauna e biomassa microfitobentônica da região estuarino-lagunar de Iguape-Cananéia (25º 00’ S - 48º 00’ W), São Paulo, Brasil. In Anais do II Simpósio de Ecossistemas da costa Sul e Sudeste Brasileira: estrutura, função e manejo. Águas de Lindóia: ACIESP. p. 95-107. (vol. 71, no. 2).
VERNER, J., 1977. On the adaptive significance of territoriality.
The American Naturalist, vol. 111, no. 980, p. 769-775.
WERSCHKUL, DF., 1979. Nestling mortality and the adaptive significance of early locomotion in the Little Blue Heron. Auk,
vol. 96, no. 1, p. 116-130.
WERSCHKUL, DF., 1982. Nesting ecology of the little blue heron: promiscuous behavior. Condor, vol. 82, no. 4, p. 381-384.
WILSON, EO., 1975. Sociobiology. Harvard: Belknap Press.
WILLARD, DE., 1977. The feeding ecology and behavior of five species of herons in southeastern New Jersey. Condor, vol. 79, no. 4, p. 462-470.
WRONSKI, T. and PLATH, M., 2006. Mate availability and intruder pressure as determinants of territory size in male bushbuck (Tragelaphus scriptus). Acta Ethologica, vol. 9, no. 1, p. 37-42.
YAMADA, K., 1994 Feeding behavior and territoriality according to the prey types and habitats in the Little Egret Egretta garzeta.