Psycho m e tric pro pe rtie s o f the
Po rtugue se ve rsio n o f the State -Trait
Anxie ty Inve nto ry
applie d to co lle ge
stude nts: facto r analysis and re latio n
to the Be ck D e pre ssio n Inve nto ry
1Instituto de Psiquiatria, Hospital das Clínicas and
Departamentos de 2Psiquiatria, Faculd ad e d e Me d icina, 3Farmacologia, Instituto de Ciências Biomédicas, and 4Estatística, Instituto de Matemática e Estatística, Universidade de São Paulo, São Paulo, SP, Brasil L. Andrade1,
C. Gorenstein3, A.H. Vieira Filho1, T.C. Tung2 and R. Artes4
Abstract
The psychometric properties of the Portuguese version of the trait form of the State-Trait Anxiety Inventory (STAI-T) and its relation to the Beck Depression Inventory (BDI) were evaluated in a large Brazilian college student sample containing 845 women and 235 men. STAI-T scores tended to be higher for women, singles, those who work, and subjects under 30 years. Factor analysis of the STAI-T for total sample and by gender yielded two factors: the first representing a mood dimension and the second being related to worrying or cognitive aspects of anxiety. In order to study the relation between anxiety and depression measures, factor analysis of the combination of the 21 BDI items and the 20 STAI-T items was also carried out. The analysis resulted in two factors that were analyzed according to the tripartite model of anxiety and depression. Most of the BDI items (measuring positive affectivity and nonspecific symptoms of depres-sion) were loaded on the first factor and four STAI-T items that measure positive affectivity. The remaining STAI-T items, all of them measuring negative affect, remained in the second factor. Thus, factor 1 represents a depression dimension and factor 2 measures a mood-worrying dimension. The findings of this study suggest that, although widely used as an anxiety scale, the STAI-T in fact measures mainly a general negative affect.
Co rre spo nde nce
L. Andrade
LIM-23, Departamento de Psiquiatria FM, USP
Caixa Postal 3671 01060-970 São Paulo, SP Brasil
Fax: + 55-11-3069-6958 E-mail: lhsgandr@ usp.br Research supported by FAPESP (No. 93/04997-4). C. Gorenstein is supported by CNPq, and T.C. Tung is supported by FAPESP (No. 96/00724-1).
Received April 10, 2000 Accepted January 29, 2001
Ke y wo rds
·Strait-Trait Anxiety Inventory ·Factor analysis
·Psychometric properties ·Beck Depression Inventory ·Students
Intro ductio n
The State-Trait Anxiety Inventory (STAI; 1) is probably among the most widely used self-report measures of anxiety in clinical and research settings (2). Spielberger (1) developed the STAI as a self-report scale
a wider range of situations as threatening. The profiles of the Portuguese versions of the Beck Depression Inventory (BDI) (3) and STAI and the validity of these question-naires have been recently assessed in differ-ent Brazilian patidiffer-ent and college studdiffer-ent populations (4-6). The results of these stud-ies supported the construct validity of the Portuguese version of both instruments.
The distinction between state and trait anxiety has been consistently shown in the literature by the factor analysis studies of STAI (e.g., 7-9). However, little attention has been given to the factor structure of each individual state and trait scale.
The objective of the present study was to investigate additional psychometric proper-ties, such as factorial analysis, of the Portu-guese version of the trait form of the STAI (STAI-T), considering gender differences, in a larger nonclinical sample. The STAI-T was used because it is a more stable measure than the state form, and unchangeable under different conditions (1). In addition, STAI-T scores were correlated with those of the BDI scale due to the strong relation between meas-ures of depression and anxiety (e.g., 10). Also, a factor analysis was carried out on the combination of the BDI and STAI-T items.
Mate rial and Me tho ds
Subje cts and pro ce dure
Subjects were 1,080 Brazilian college students (845 women, 235 men;mean age 24.1 years, SD = 6.4 year) from the city of São Paulo, the majority attending evening courses. Subjects were asked to voluntarily answer a set of questionnaires in their class-rooms at the beginning of their regular classes. We selected academic courses with a predominance of women and oversampled them, since the present study was associated with another one designed to assess physical and psychological symptoms during the last menstrual cycle.
Instrum e nts
STAI. The Portuguese version of the
STAI-T (1) was validated by Biaggio and Natalício (11). Subjects were classified as high and low on trait anxiety, using the group mean ± 1 SD, respectively.
BDI. The Portuguese version of the 21
items of the revised form of the BDI (12,13) was used. The scale consists of items includ-ing symptoms and attitudes with intensities ranging from neutral to a maximum level of severity, ranked from 0 to 3. We adopted the cut-off scores proposed by Kendall et al. (14) for nonclinical populations, i.e., scores higher than 15 as detecting dysphoria, and scores over 20 as indicative of depression
Statistical analysis
Comparison by sociodemographic char-acteristics was performed through F tests followed by the Tukey t-test. The internal
consistency for the STAI-T was calculated by Cronbachs alpha coefficient (15). Item-total correlations were evaluated in order to identify which items were more associated with the STAI-T total score. Individual item means were compared by the Student t-test
with Bonferroni adjustments of P = 0.05 for the 20 comparisons in order to protect for familywise error rate (individual significant values, P<0.003).
Multiple regression analysis was per-formed to relate STAI-T total score to sex, age and professional activity. STAI-T data were transformed into their fifth roots to minimize the effects of the departure from the assumptions of normality and homosce-dasticity of the models errors.
Spearman correlation coefficients were calculated for the comparison of BDI and STAI-T scores.
proce-dure was applied to the combination of the 41 items of the BDI and STAI-T scales.
Re sults
STAI-T scores according to sociodemo-graphic characteristics are given in Table 1. Differences by gender were significant, with women scoring higher than men (P<0.01). Subjects under 30 years had significantly higher scores than the other age groups (P<0.05). Singles had higher STAI-T scores than married subjects (P<0.05). Internal con-sistency estimated as coefficient alpha was 0.89 for the total sample. Subgroups accord-ing to demographic characteristics showed similar coefficients.
Mean STAI-T total scores for subgroups according to the cut-off scores using the group mean ± 1 SD were: <33: 28.6 ± 2.9 (15.9%), 33-49: 40.5 ± 5.4 (55.3%), and >49: 56.7 ± 6.1 (28.8%).
Multiple regression analysis showed that gender (0 if male, 1 if female), work (0 if no, 1 if yes) and age were statistically significant (P = 0.017, P = 0.086, and P<0.001, respec-tively) (r2 = 0.02). STAI-T scores tended to be higher for women, for those who work and for younger subjects. The final model of multiple regression analysis was: 5 STAI =
2.162 - 0.019 sex + 0.013 work - 0.002 age. Table 2 shows STAI-T individual item mean scores and SD and the item-total corre-lations for total sample and by gender. Women had significantly higher scores than men on items 3, 7, 12 and 20, while men had higher scores than women on item 10, ac-cording to Student t-test with Bonferroni
adjustment. When means according to sex were compared without Bonferroni adjust-ment women had higher scores than men in nine other items: 2, 6, 9, 11-13, 17-19.
On the basis of factor analysis, the first unrotated factor accounted for 34.2% of the variance. The second factor accounted for an additional variability of 8.5%. A small contribution to the STAI-T structure was
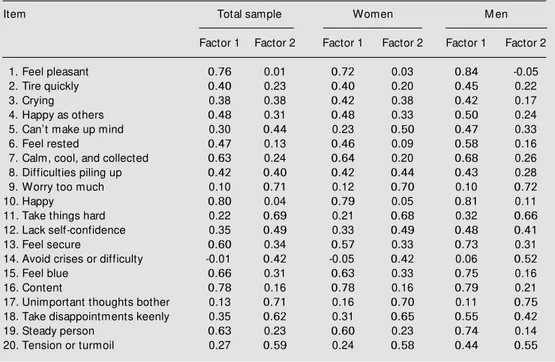
made by each of the remaining factors. Con-sidering loading greater than 0.40, principal component analysis with varimax rotation suggests that the two STAI-T factors that could be extracted are related to the follow-ing items: factor 1: items 1, 2, 4, 6-8, 10, 13, 15, 16 and 19; factor 2: items 5, 9, 11, 12, 14, 17, 18 and 20.
Cronbachs alpha coefficients for the sub-scales based on the items related to factors 1 and 2 were 0.84 and 0.81, respectively. Sub-scale 1 represents predominantly the mood dimension, while subscale 2 represents the worrying dimension (Table 3).
Also two factors were extracted from the factor analysis for the women sub-sample. The first unrotated factor accounted for 33.0% of the variance and the second factor accounted for an additional variability of 8.5%. Principal component analysis with varimax rotation suggested that the two STAI-T factors that could be extracted were related to the following items: factor 1: items 1-4, 6-8, 10, 13, 15, 16, 19; factor 2: items 5, 6-8, 9, 11, 12, 14, 17, 18, 20.
Table 1 - State-Trait Anxiety Inventory (trait form) (STAI-T) mean scores and standard deviation (SD) and a coefficients according to sociodemographic characteristics (N = 1,080).
* P<0.01 and * * P<0.001 for comparisons made among roll cat-egories (F test follow ed by Tukey t-test).
Sociodemographic % STAI-T characteristics
M ean SD a
Age (years)
<30 87.3 43.8* * 10.7 0.89
31-45 11.2 40.2 11.5 0.92
>45 1.5 37.5 9.7 0.87
M arital status
single 85.0 43.8* * 10.8 0.89
married 13.2 40.1 10.7 0.89
other 1.8 39.4 11.7 0.94
Gender
male 22.1 41.6 11.5 0.91
female 77.9 43.7* 10.7 0.89
Professional occupation
yes 74.2 43.3 11.0 0.89
no 25.8 42.9 10.7 0.89
Table 2 - State-Trait Anxiety Inventory (trait form) mean scores and standard deviations (SD) for individual items and item-total correlations for total sample and by gender.
M eans and SD w ere calculated considering only inventories w ithout missing values. * P<0.05 significantly different from men’s mean (Student t-test considering Bonferroni adjustment).
Item M ales Females Total Item-total correlation
M ean SD M ean SD M ean SD M ale Female Total
1 1.90 0.87 1.81 0.81 1.84 0.82 0.64 0.49 0.52
2 2.06 0.89 2.22 0.86 2.19 0.87 0.45 0.38 0.40
3 1.53 0.67 1.97* 0.78 1.87 0.77 0.40 0.49 0.47
4 1.98 1.04 1.93 1.03 1.94 1.04 0.50 0.51 0.50
5 1.95 0.98 1.88 0.96 1.91 0.96 0.52 0.45 0.46
6 2.60 0.99 2.76 0.97 2.74 0.98 0.52 0.34 0.39
7 2.26 1.00 2.48* 0.94 2.44 0.95 0.66 0.55 0.58
8 1.89 0.91 1.93 0.90 1.93 0.90 0.46 0.55 0.52
9 2.00 0.99 2.19 1.04 2.15 1.04 0.40 0.49 0.47
10 2.18 1.00 1.91* 0.91 1.97 0.93 0.69 0.56 0.57
11 2.44 0.98 2.63 1.00 2.60 0.99 0.57 0.54 0.55
12 1.83 0.90 2.05* 0.95 2.00 0.94 0.57 0.51 0.53
13 2.23 0.93 2.40 0.96 2.37 0.95 0.73 0.59 0.62
14 2.26 1.07 2.29 1.04 2.29 1.05 0.28 0.20 0.22
15 1.84 0.86 1.96 0.84 1.94 0.84 0.67 0.63 0.64
16 2.36 1.02 2.23 0.94 2.27 0.95 0.73 0.62 0.64
17 2.00 0.91 2.18 0.94 2.15 0.94 0.43 0.52 0.50
18 1.89 0.93 2.10 1.00 2.06 0.99 0.63 0.60 0.61
19 2.15 1.00 2.31 0.95 2.28 0.97 0.64 0.53 0.56
20 2.26 0.98 2.49* 0.95 2.46 0.96 0.61 0.50 0.53
Total 41.86 11.59 43.84 10.57 43.39 10.83
Table 3 - State-Trait Anxiety Inventory (trait form) item factor loadings after varimax rotation for the total sample and according to sex.
Only loadings above 0.40 (bold) w ere considered to significantly contribute to a factor.
Item Total sample Women M en
Factor 1 Factor 2 Factor 1 Factor 2 Factor 1 Factor 2
1. Feel pleasant 0.76 0.01 0.72 0.03 0.84 -0.05
2. Tire quickly 0.40 0.23 0.40 0.20 0.45 0.22
3. Crying 0.38 0.38 0.42 0.38 0.42 0.17
4. Happy as others 0.48 0.31 0.48 0.33 0.50 0.24
5. Can’t make up mind 0.30 0.44 0.23 0.50 0.47 0.33
6. Feel rested 0.47 0.13 0.46 0.09 0.58 0.16
7. Calm, cool, and collected 0.63 0.24 0.64 0.20 0.68 0.26 8. Difficulties piling up 0.42 0.40 0.42 0.44 0.43 0.28
9. Worry too much 0.10 0.71 0.12 0.70 0.10 0.72
10. Happy 0.80 0.04 0.79 0.05 0.81 0.11
11. Take things hard 0.22 0.69 0.21 0.68 0.32 0.66
12. Lack self-confidence 0.35 0.49 0.33 0.49 0.48 0.41
13. Feel secure 0.60 0.34 0.57 0.33 0.73 0.31
14. Avoid crises or difficulty -0.01 0.42 -0.05 0.42 0.06 0.52
15. Feel blue 0.66 0.31 0.63 0.33 0.75 0.16
16. Content 0.78 0.16 0.78 0.16 0.79 0.21
17. Unimportant thoughts bother 0.13 0.71 0.16 0.70 0.11 0.75 18. Take disappointments keenly 0.35 0.62 0.31 0.65 0.55 0.42
19. Steady person 0.63 0.23 0.60 0.23 0.74 0.14
Cronbachs alpha coefficients for the sub-scales based on the items related to factors 1 and 2 were 0.86 and 0.80, respectively. Fac-tor 1 represents predominantly the mood dimension and factor 2 represents the worry-ing dimension (Table 3).
According to the factor analysis for the mens sub-sample, the first unrotated factor accounted for 38.6% of the variance and the second factor accounted for an additional variability of 8.2%. Principal component analysis with varimax rotation suggested that the two STAI-T factors that could be extract-ed were relatextract-ed to the following items: factor 1: items 1-8, 10, 12, 13, 15, 16, 18-20; factor 2: items 9, 11, 12, 14, 17, 18, 20.
Cronbachs alpha coefficients for the sub-scales based on the items related to factors 1 and 2 were 0.91 and 0.78, respectively. Fac-tor 1 represents the mood-insecurity dimen-sion, while factor 2 represents the worrying dimension (Table 3).
Scores on the BDI and STAI-T were significantly correlated (r = 0.66, P<0.001). Correlation between subgroup scores on each test reached significance between low BDI scores (0-15) and low scores on the STAI-T (20-33) (r = 0.23; P = 0.002), low BDI scores and medium scores on the STAI-T (34-49) (r = 0.23; P<0.001), medium BDI scores (16-20) with high scores on the STAI-T (>49) (r = 0.17; P = 0.01), high scores on the BDI (³21) and high scores on the STAI-T (r = 0.35; P<0.001).
Table 4 shows the factor analysis for the combination of the 41items of the BDI and STAI-T scales. Two factors were extracted from this factor analysis. The first unrotated factor accounted for 26.0% of the variance and the second accounted for an additional variability of 5.5%. A small contribution to the STAI-T structure was made by each of the remaining factors. Principal component analysis with varimax rotation suggested that the two factors that could be extracted were related to the following items: factor 1: BDI items, 1-10, 12, 13, 15-18 and 20; STAI-T
items, 1, 10, 15 and 16; factor 2: BDI items, none; STAI-T items, 1, 3-5, 7-13, 15-20.
Cronbachs alpha coefficients for the sub-scales based on the items related to factors 1 and 2 were 0.89 in both cases. Factor 1 represents the depression dimension and fac-tor 2 represents the mood-worrying dimen-sion (Table 4).
Table 4 - Factor analysis for the combination of the 41items of the Beck Depression Inventory and State-Trait Anxiety Inventory (trait form) scales.
Only loadings above 0.40 (bold) w ere considered to significantly contribute to a factor.
Factor 1 Factor 2
1. Sadness 0.60 0.19
2. Pessimism 0.61 0.16 3. Sense of failure 0.57 0.31 4. Lack of satisfaction 0.60 0.25 5. Guilty feelings 0.52 0.21 6. Sense of punishment 0.49 0.12 7. Self-dislike 0.55 0.28 8. Self-accusations 0.44 0.28 9. Suicidal w ishes 0.56 0.15 10. Crying spells 0.45 0.19 11. Irritability 0.36 0.14 12. Social w ithdraw al 0.54 0.18 13. Indecisiveness 0.56 0.19 14. Distortion of body image 0.34 0.20 15. Work inhibition 0.59 0.22 16. Sleep disturbance 0.44 0.01 17. Fatigability 0.53 0.13 18. Loss of appetite 0.44 0.07 19. Weight loss 0.19 0.03 20. Somatic preoccupation 0.40 0.06 21. Loss of libido 0.32 0.05
1. Feel pleasant 0.41 0.42 2. Tire quickly 0.30 0.31
3. Crying 0.27 0.46
4. Happy as others 0.29 0.47 5. Can’t make up mind 0.18 0.49
6. Feel rested 0.31 0.30 7. Calm, cool, and collected 0.38 0.49
8. Difficulties piling up 0.29 0.49
9. Worry too much 0.01 0.62
10. Happy 0.42 0.47
11. Take things hard 0.10 0.65 12. Lack self-confidence 0.14 0.59
13. Feel secure 0.25 0.65
14. Avoid crises or difficulty -0.04 0.33 15. Feel blue 0.43 0.57
16. Content 0.40 0.55 17. Unimportant thoughts bother 0.01 0.64
18. Take disappointments keenly 0.21 0.65
D iscussio n
The highest anxiety scores were found among women, singles, those who work, and subjects under 30 years. This is in agreement with other STAI reports (e.g., 17,18). Also, epidemiological studies have shown higher anxiety complaints in younger samples com-pared to older ones (19,20).
Differences by gender, consisting of higher scores for women than men, are also in agreement with other studies (e.g., 1,10, 17,21-23). Individual item scores showed a trend towards higher scores for women in the majority of individual items, some of them reaching statistical significance. Item-total correlations were in the range of 0.40 and 0.60 for most items, with no consistent difference between men and women.
The reliability of the questionnaire, as-sessed by Cronbachs alpha coefficient and item-total correlation was high, indicating that the items of the Portuguese version of the STAI-T are highly homogenous.
In contrast to findings of gender differ-ences in the expression of depressive symp-toms in the factor analysis of BDI done on this sample (6), we found a closely similar pattern in the distribution of items in the STAI-T factor analysis for both men and women. However, in the first factor, men seemed to combine more items indicative of insecurity besides mood-related items, than women.
Our factor analysis of the STAI-T for total sample and by gender yielded two fac-tors. The first represented mainly a mood dimension and the second was closely re-lated to worrying or cognitive aspects of anxiety. The finding that most of the vari-ance of the scale is explained by a factor that measures a depression dimension was also reported by Bieling et al. (24). These inves-tigators found a two-factor solution: 10 out of their 13 items loading in the first factor (depression content) and 6 out of their 7 items loading in factor two (anxiety content)
agree with our results. In contrast, different results were reported by Pasquali et al. (25) for another Brazilian sample of 3449 indi-viduals (2266 men). According to a princi-pal component analysis, they found two com-ponents, called stress (13 items) and emo-tional stability (7 items). Their STAI-T first component was composed of items related to indecision and worrying, whereas second component items were related to well-being. The items associated with these components were not similar to those obtained in the present sample. The higher prevalence of men in Pasqualis sample (65.7%) and the stressful situation of data collection (indi-viduals answered the questionnaire while participating in a job selection procedure) might explain the lack of concordance be-tween the two studies.
The significant correlation between BDI and STAI-T total scores was expected (e.g., 10,26-32). This may be due to the psycho-metric weakness of the scales used rather than to a real comorbidity or weakness of the anxiety or depression constructs (33).
In order to clarify whether this correla-tion is due to a low STAI-T discriminant validity or to a nonspecific distress factor shared by both anxiety and depression (34), we conducted a factor analysis pooling to-gether the 21 BDI items and the 20 STAI-T items. This factor analysis resulted in two factors. The first included most of the BDI items (except for irritability, distortion of body image, weight loss, and loss of libido) and four STAI-T items (feel pleasant, happy, feel blue, and content). The second included 17 of the 20 STAI-T items, and no BDI item. The BDI items excluded from the first factor are those more related to physical symptoms of depression, whereas the STAI-T items included in this factor are clearly related to positive affectivity.
over-lapping component, called negative affect, represented by nonspecific symptoms, such as irritability and tension; and specific fea-tures of each construct - low levels of posi-tive affect for depression (symptoms such as anhedonia), and physiological hyperarousal for anxiety (e.g., sweating, tachycardia).
According to this approach, most BDI items loading in factor 1 are depression spe-cific (3 items) and nonspespe-cific (8 items) and the four STAI-T items are related to positive affect, indicating that factor 1 is associated with depression.
On the other hand, factor 2 (mood-wor-rying dimension) measures the nonspecific component of anxiety and depression. In fact, none of the 20 STAI-T items measures specific features of anxiety: 15 items corre-spond to the measure of general negative affect, and 5 measure positive affectivity.
These results apply to these Brazilian col-lege students and cannot be generalized to patient populations.
An important finding of the present study is that the STAI-T, which is widely used as an anxiety scale, in fact measures primarily a general negative affect. Although this can be viewed as a drawback when considering the anxiety specific construct, the STAI-T proved to be a good measure of general psychopa-thology. The importance of this construct has been consistently appearing in recent studies in the community as a marker that predicts high impairment and comorbidity in anxiety and depressive disorders (36,37). Whether the presence of general negative affectivity construct measured by the STAI-T could predict severity remains to be fur-ther investigated in clinical samples.
Re fe re nce s
1. Spielberger CD, Gorsuch RL & Lushene RE (1970). M anual for the State-Trait Anxi-ety Inventory. Consulting Psychologists Press, Palo Alto, CA.
2. Keedw ell P & Snaith RP (1996). What do anxiety scales measure? Acta Psychiatrica Scandinavica, 93: 177-180.
3. Beck AT, Ward CH, M endelson M , M ock J & Erbaugh G (1961). An inventory for measuring depression. Archives of Gen-eral Psychiatry, 4: 53-63.
4. Gorenstein C, Pompéia S & Andrade L (1995). Scores of Brazilian university stu-dents on the Beck Depression Inventory and the State-Trait Anxiety Inventory. Psy-chological Reports, 77: 635-641. 5. Gorenstein C & Andrade L (1996).
Valida-tion of a Portuguese version of the Beck Depression Inventory and the State-Trait Anxiety Inventory in Brazilian subjects.
Brazilian Journal of M edical and Biological Research, 29: 453-457.
6. Gorenstein C, Andrade L, Vieira Filho AHG, Tung TC & Artes R (1999). Psycho-metric properties of the Portuguese ver-sion of the Beck Depresver-sion Inventory on Brazilian college students. Journal of Clini-cal Psychology, 55: 553-562.
7. Barker BM , Barker HR & Wadsw orth AP (1977). Factor analysis of the items of the
state-trait anxiety inventory. Journal of Clinical Psychology, 33: 450-455. 8. Spielberger CD, Vagg PR, Barker LR,
Donham GW & Westberry LG (1980). Fac-tor structure of the State-Trait Anxiety In-ventory. In:Sarason IG & Spielberger CD (Editors), Stress and Anxiety. Vol. 7. Hemi-sphere, Washington, DC, 95-109. 9. Iw ata N, M ishima N, Shimizu T, M izoue T,
Fukuhara M , Hidano T & Spielberger CD (1998). Positive and negative affect in the factor structure of the State-Trait Anxiety Inventory for Japanese w orkers. Psycho-logical Reports, 82: 651-656.
10. Tanaka-M atsumi J & Kameoka VA (1986). Reliabilities and concurrent validities of popular self-report measures of depres-sion, anxiety, and social desirability. Jour-nal of Consulting and Clinical Psychology, 54: 328-333.
11. Biaggio AM B & Natalício L (1979). M anual para o Inventário de Ansiedade Traço-Estado (IDATE). Centro Editor de Psicolo-gia Aplicada-CEPA, Rio de Janeiro, RJ, Brazil.
12. Beck AT, Rush AJ, Shaw BF & Emery G (1979). Cognitive Therapy of Depression.
Guilford, New York.
13. Beck AT, Rush AJ, Shaw BF & Emery G (1982). Terapia Cognitiva da Depressão.
Zahar, Rio de Janeiro, RJ, Brazil. 14. Kendall PC, Hollon SD, Beck AT, Hammen
CL & Ingram RE (1987). Issues and rec-ommendations regarding use of the Beck Depression Inventory. Cognitive Therapy and Research, 11: 289-299.
15. Cronbach LJ (1951). Coefficient alpha and the internal structure of tests. Psychome-trika, 16: 297-335.
16. Johnson RA & Wichern DW (1992). Ap-plied M ultivariate Statistical Analysis. 3rd edn. Prentice Hall, New York.
17. Nakazato K & Shimonaka Y (1989). The Japanese State-Trait Anxiety Inventory: age and sex differences. Perceptual and M otor Skills, 69: 611-617.
18. Stanley M A, Beck JG & Zebb BJ (1996). Psychometric properties of four anxiety measures in older adults. Behaviour Re-search andTherapy, 34: 827-838. 19. Regier DA, Boyd JH, Burke Jr JD, Rae DS,
M yers JK, Kramer M , Robins LN, George LK, Karno M & Locke BZ (1988). One-month prevalence of mental disorders in the United States. Based on five Epide-miologic Catchment Area sites. Archives of General Psychiatry, 45: 977-986. 20. Andrade L, Lolio C, Gentil V & Laurenti R
cidade de São Paulo. Revista de Psiquia-tria Clínica, 26: 257-261.
21. Rodrigo G & Lusiardo M (1988). Note on the reliability and concurrent validity of the Spanish version of the State-Trait Anxiety Inventory. Perceptual and M otor Skills, 67: 926.
22. Oei TP, Evans L & Crook GM (1990). Util-ity and validUtil-ity of the STAI w ith anxiety disorder patients. British Journal of Clini-cal Psychology, 29: 429-432.
23. M cCleary R & Zucker EL (1991). Higher trait and state-anxiety in female law stu-dents than in male law stustu-dents. Psycho-logical Reports, 68: 1075-1078.
24. Bieling PJ, Antony M M & Sw inson RP (1998). The State-Trait Anxiety Inventory, Trait version: structure and content re-exam ined. Behaviour Research and Therapy, 36: 777-788.
25. Pasquali L, Pinelli Junior B & Solha AC (1994). Contribuição à validade e normati-zação da escala de ansiedade traço-estado do IDATE. Psicologia: Teoria e Pesquisa, 10: 411-420.
26. M endels J, Weinstein N & Cochrane C (1972). The relationship betw een depres-sion and anxiety. Archives of General
Psy-chiatry, 27: 649-653.
27. M athew RJ, Sw ihart AA & Weinman M L (1982). Vegetative symptoms in anxiety and depression. British Journal of Psy-chiatry, 141: 162-165.
28. Gotlib IH (1984). Depression and general psychopathology in university students.
Journal of Abnormal Psychology, 93: 19-30.
29. Barlow DH, DiNardo PA, Vermilyea BB, Vermilyea J & Blanchard EB (1986). Co-morbidity and depression among the anxi-ety disorders: issues in diagnosis and clas-sification. Journal of Nervous and M ental Disease, 174: 63-72.
30. Riskind JH, Beck AT, Brow n G & Steer RA (1987). Taking the measure of anxiety and depression. Validity of the reconstructed Hamilton Scales. Journal of Nervous and M ental Disease, 175: 474-479.
31. Beck AT, Steer RA & Garbin M G (1988). Psychometric properties of the Beck De-pression Inventory: tw enty-five years of evaluation. Clinical Psychology Review, 8: 77-100.
32. Beck AT, Epstein N, Brow n G & Steer RA (1988). An inventory for measuring clini-cal anxiety: psychometric properties.
Jour-nal of Consulting and Clinical Psychology, 56: 893-897.
33. Endler NS, Cox BJ, Parker JDA & Bagby RM (1992). Self-reports of depression and state-trait anxiety; evidence for differen-tial assessment. Journal of Personality and Social Psychology, 63: 832-838. 34. Clark LA & Watson D (1991). Tripartite
model of anxiety and depression: Psycho-metric evidence and taxonomic implica-tions. Journal of Abnormal Psychology, 3: 316-336.
35. Watson D & Clark LA (1984). Negative affectivity: the disposition to experience aversive emotional states. Psychology Bulletin, 96: 465-490.
36. Curt is GC, M agee W J, Eat on W W , Wittchen HU & Kessler RC (1998). Specif-ic fears and phobias. Epidemiology and classification. British Journal of Psychia-try, 173: 212-217.
37. Nestadt G, Bienvenu OJ, Cai G, Samuels J & Eaton WW (1998). Incidence of ob-sessive-compulsive disorder in adults.