Reaction of peach tree genotypes to bacterial leaf spot caused by
Xanthomonas arboricola
pv
. pruni
José Gilberto Sousa Medeiros
1; Idemir Citadin
2*; Idalmir dos Santos
2; André Paulo
Assmann
31
UTFPR – Programa de Pós-Graduação em Agronomia. 2
UTFPR –Depto. de Agronomia, C.P. 571 – 85503-390 – Pato Branco, PR – Brasil. 3
Agropantanal, R. Campo Grande, 1190 – 79560-000 – Chapadão do Sul, MS – Brasil. *Corresponding author <idemir@utfpr.edu.br>
ABSTRACT: Bacterial leaf spot (BLS), caused by Xanthomonas arboricola pv. pruni, is one of the most important diseases in Brazilian peach [Prunus persica (L.) Batsch] orchards and all over the world. The main objective of this study was to evaluate for BLS sensitivity of peach genotypes. Evaluations of thirty genotypes were carried out during the onset of the disease, for incidence, severity and defoliation, in field conditions. Pearson’s correlations between the percentage of defoliation and leaf severity rating were performed. Genotypes ‘Conserva 985’, ‘Conserva 871’, ‘Conserva 1129’, and ‘Tropic Snow’, as resistance sources, and ‘Conserva 1153’, ‘Bonão’, ‘Conserva 1125’, and ‘Atenas’, as susceptible to BLS, were submitted to detached-leaf bioassay and greenhouse evaluation. The peach genotypes showed different reactions to the BLS, and none was immune to the pathogen. ‘Conserva 985’ and ‘Conserva 1129’ confirmed resistance responsiveness while ‘Conserva 1153’, ‘Conserva 1125’ and ‘Atenas’ were found susceptible for the detached-leaf bioassay. Key words:disease resistance, disease severity
Reação de genótipos de pessegueiro a mancha foliar causada por
Xanthomonas arboricola
pv
. pruni
RESUMO: A bacteriose foliar causada por Xanthomonas arboricola pv. pruni é uma das mais importantes doenças do pessegueiro [Prunus persica (L.) Batsch] no Brasil e no mundo. Avaliou-se a sensibilidade de genótipos de pessegueiro a X. arboricola pv. pruni. Trinta genótipos foram avaliados em campo, quanto à incidência, severidade e desfolha causada pela bactéria. Calculou-se a correlação entre desfolha e severidade da doença. A partir dos resultados obtidos em campo, foram selecionados quatro genótipos resistentes (‘Conserva 985’, ‘Conserva 871’, ‘Conserva 1129’ e ‘Tropic Snow’) e quatro suscetíveis (‘Conserva 1153’, ‘Bonão’, ‘Conserva 1125’ e ‘Atenas’) para serem novamente avaliados pelo bioensáio com folhas destacadas e em casa de vegetação. Os genótipos diferiram quanto a reação ao patógeno, não sendo observada imunidade. Confirmou-se a resistência para ‘Conserva 985’ e ‘Conserva 1129’ e a suscetibilidade para ‘Conserva 1153’, ‘Conserva 1125’ e ‘Atenas’, pelo bioensáio com folhas destacadas.
Palavras-chave: resistência à doença, severidade de doença
Introduction
Bacterial leaf spot (BLS) caused by Xanthomonas arboricola pv. pruni (Smith) is a serious disease where peaches and nectarines [Prunus persica (L.) Batsch] are grown in warm, humid environments with strong winds (Werner et al., 1986). These conditions are typical in the main peach growing regions of Brazil (Nogueira and Rodrigues Neto, 1982) where chemical control is costly and often ineffective. The disease symptoms ap-pears on the lower surface on peach leaves as small, pale-green to yellow, circular or irregular areas with a light-tan center (EPPO, 2006). These spots soon come evident on the upper surface as they enlarge, be-coming angular and darkening to deep-purple, brown or black. The surrounding tissue may become yellow. Spots are usually concentrated towards the leaf tip. In Brazil, the greatest damage for peach plants is severe
defoliation, although the disease can also affect peach fruit, but it is not usually observed on peach twigs. Screening Prunus spp. for BLS resistance has already been initiated in North America (Scorza and Sherman, 1996) and Brazil (Raseira and Nakasu, 1998) and resis-tant cultivars are available (Keil and Fogle, 1974; Kretzschmar et al., 1998), but large variability in leaf and fruit resistance levels has been observed (Keil and Fogle, 1974; Rom and Moore, 1979; Werner et al., 1986). Moreover, many of the cultivars rated as highly resis-tant, become susceptible when submitted to favorable conditions for infection in different agroclimates (Werner et al., 1986).
Material and Methods
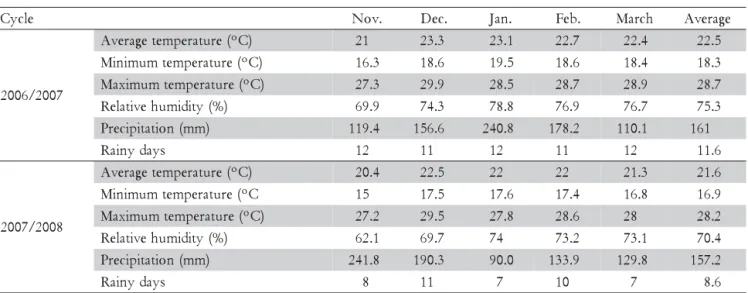
Three experiments were conducted from 2006 to 2008 at Pato Branco, Paraná State - Brazil, (26º10’ S; 52º41’ W, 764 m a.s.l.). The meteorological observations carried out during the evaluation period are summarized in Table 1.
Experiment I - Trees under field conditions: During the 2006/2007 growing season, 22 genotypes were evalu-ated (Table 2) and during 2007-2008 eight additional geno-types were included (Table 3). The trees were 3 and 4 years old in 2006 and 2007, respectively. Each genotype was represented by three plants on a completely ran-domized design. Five shoots around the canopy were se-lected for leaf analysis, in each plant. Monthly data on incidence (percent of leaves with BLS symptoms) and severity (percent of damaged leaf area) were recorded in both growing seasons. Data were collected five times between November and March. The evaluation of sever-ity was based on the scale proposed by Citadin et al. (2008). In March, after the last evaluation for disease in-cidence and severity, the shoots were excised and the percent of defoliation was also recorded. The orchard received standard fungicides and insecticides sprays, similar to what is used in commercial orchards. None of the used pesticides control BLS disease.
Based on the incidence and severity of BLS data col-lected from November to March of both years, a dis-ease progress curve was constructed, and the area under the disease progress curve (AUDPC) was calculated for each genotype (Campbell and Madden, 1990). AUDPC was estimated using the following equation:
(
i i)
n
i
i
i y t t
y
AUDPC ⎟ −
⎠ ⎞ ⎜ ⎝ ⎛ + = + − +
∑
1 1 1 2in which: n is the number of evaluations made, y is the disease measurement (severity or incidence) and t is time in days.
Table 1– Average, minimum and maximum monthly temperatures, average relative humidity, monthly precipitation,
and rainy days, during the disease evaluation period (November until March) in both growing season (2006/ 2007 and 2007/2008). Data registered in Pato Branco, state of Paraná, Brazil (26º07’ S, 51º41’ W, 700m a.s.l.).
e l c y
C Nov. Dec. Jan. Feb. March Average
7 0 0 2 / 6 0 0 2 ) C º ( e r u t a r e p m e t e g a r e v
A 21 23.3 23.1 22.7 22.4 22.5
) C º ( e r u t a r e p m e t m u m i n i
M 16.3 18.6 19.5 18.6 18.4 18.3
) C º ( e r u t a r e p m e t m u m i x a
M 27.3 29.9 28.5 28.7 28.9 28.7
) % ( y t i d i m u h e v i t a l e
R 69.9 74.3 78.8 76.9 76.7 75.3
) m m ( n o i t a t i p i c e r
P 119.4 156.6 240.8 178.2 110.1 161
s y a d y n i a
R 12 11 12 11 12 11.6
8 0 0 2 / 7 0 0 2 ) C º ( e r u t a r e p m e t e g a r e v
A 20.4 22.5 22 22 21.3 21.6
C º ( e r u t a r e p m e t m u m i n i
M 15 17.5 17.6 17.4 16.8 16.9
) C º ( e r u t a r e p m e t m u m i x a
M 27.2 29.5 27.8 28.6 28 28.2
) % ( y t i d i m u h e v i t a l e
R 62.1 69.7 74 73.2 73.1 70.4
) m m ( n o i t a t i p i c e r
P 241.8 190.3 90.0 133.9 129.8 157.2
s y a d y n i a
R 8 11 7 10 7 8.6
Table 2 – Area under the disease progress curve (AUDPC) for incidence, severity and percentage of
defoliation caused by Xanthomonas arboricola pv.
pruni in peach genotypes under natural conditions in 2006/2007.
*Means in the same column followed by different lowercase letters differ (p ≤ 0.05, Scott-Knott test).
s e p y t o n e
G AUDPC
e c n e d i c n I C P D U A y t i r e v e
S Defoliation
% 3 5 1 1 a v r e s n o
C 10,046.5*a 1276.7*a 92.9*a
0 7 0 1 a v r e s n o
C 7,339.3b 373.9c 82.5a
3 6 0 1 a t a c s a
C 9,290.4a 505.6c 81.7a
7 8 1 1 a v r e s n o
C 11,230.6a 883.7b 81.7a
3 2 2 1 a v r e s n o
C 9,380.8a 609.6b 77.9a
s a n e t
A 10,268.1a 709.6b 77.3a
4 4 8 a v r e s n o
C 8,834.5a 363.1c 77.0a
7 2 1 1 a v r e s n o
C 11,192.5a 910.6b 75.7a
y t u a e B c i p o r
T 10,144.5a 370.6c 72.5a
o ã n o
B 11,834.6a 538.4c 72.0a
a i p m í l
O 10,425.9a 397.6c 70.1a
5 2 1 1 a v r e s n o
C 11,454.9a 749.1b 65.8a
5 5 6 a v r e s n o
C 7,426.3b 437.0c 62.6a
5 0 2 1 a v r e s n o
C 9,970.2a 289.8c 57.8a
8 8 6 a v r e s n o
C 7,469.8b 427.0c 52.8a
7 7 9 a v r e s n o
C 4,024.6c 145.9c 48.3b
2 6 9 a v r e s n o
C 4,464.4c 106.5c 38.1b
l e m i b u
R 5,435.6c 140.9c 35.1b
9 2 1 1 a v r e s n o
C 5,655.7c 190.7c 27.4c
w o n S c i p o r
T 3,056.1c 68.7c 24.9c
1 7 8 a v r e s n o
C 4,330.7c 102.0c 18.5c
5 8 9 a v r e s n o
C 3,766.8c 98.1c 14.8c
n a e
M 8,047.4 440.7 59.4
) % ( . V
Experiment II - Detached-leaf Bioassay system: Leaves from four resistant rated (‘Conserva 985’, ‘Conserva 871’, ‘Conserva 1129’, ‘Tropic Snow’) and four susceptible (‘Conserva 1153’, ‘Bonão’, ‘Conserva 1125’, and ‘Atenas’) peaches based on former field experiment were collected and evaluated for their reaction to X. arboricola pv. pruni using a modified detached-leaf bioassay (Randhawa and Table 3 – Area under the disease progress curve (AUDPC) for incidence, severity and percentage of
defoliation caused by Xanthomonas arboricola pv.
pruni in peach genotypes under natural conditions in 2007/2008.
s e p y t o n e
G IAnUcidDenPCce ASeUvDerPtiyC Defoilation
% 7 2 1 1 a v r e s n o
C 6,397.3*a 391.4*a 77.8*a 5 2 1 1 a v r e s n o
C 4,546.6d 332.7b 72.4a
3 0 8 a v r e s n o
C 3,592.6f 127.9b 86.6a
l e m i b u
R 4,770.6c 96.6c 83.2a
3 2 2 1 a v r e s n o
C 3,499.4f 75.4c 43.6c
5 5 6 a v r e s n o
C 3,643.7f 69.1c 40.7c
0 7 0 1 a t a c s a
C 5,099.5b 65.7c 50.1b
3 5 1 1 a v r e s n o
C 3,055.3h 60.4c 66.2a
8 8 6 a v r e s n o
C 5,028.6b 56.4c 14.4d
7 8 1 1 a v r e s n o
C 4,835.8d 51.7c 37.6c
a e r u Á a t n a
S 2,600.7j 50.9c 39.3c
y t u a e B c i p o r
T 4,097.2e 50.6c 49.4b
1 8 6 a v r e s n o
C 2,573.4j 39.3d 58.2b
4 4 8 a v r e s n o
C 3,589.5f 36.6d 55.9b
2 6 9 a t a c s a
C 3,739.4f 33.5d 20.3c
6 8 1 1 a v r e s n o
C 2,811.4i 289.0d 41.5c
s a n e t
A 3,281.4g 28.7d 43.3c
5 5 0 1 a t a c s a
C 3,006.5h 28.5d 37.5c
o ã n o
B 3,606.2f 26.6d 36.6c
7 7 9 a v r e s n o
C 2,362.8k 19.4d 47.3b
7 6 9 a t a c s a
C 2,778.6i 17.9e 12.3d
w o n S c i p o r
T 3,027.6h 12.7e 18.7d
5 6 0 1 a t a c s a
C 1,542.8n 11.2e 20.7d
9 2 1 1 a v r e s n o
C 911.6p 10.8e 13.1d
a i p m íl
O 1,978.0l 10.3e 7.7d
5 0 2 1 a v r e s n o
C 1,450.9n 10.2e 27.6c
3 6 0 1 a t a c s a
C 2,313.2k 8.9e 11.6d
7 8 5 a t a c s a
C 2,047.1l 8.8e 24.0d
5 8 9 a v r e s n o
C 1,754.0m 7.2e 9.7d
1 7 8 a v r e s n o
C 1,175.6o 4.1e 15.1d
n a e
M 3,155.6 59.1 38.7
) % ( . V
C 15.4 16.0 30.5
*Means in the same column followed by different lowercase letters differ (p ≤ 0.05, Scott-Knott test).
Civerolo, 1985). The bacteria was isolated from diseased leaves and cultured, using a PDA medium (Potato Dex-trose Agar). Standard inoculum was prepared by wash-ing the X. arboricola pv. pruni from the nutrient agar plate with sterile distilled water. These suspensions were di-luted to a final 108 colony-forming units (CFU) mL–1. Fully expanded leaves from three plants per genotype were se-lected for inoculations. Bacterial suspensions were drawn into a 3-mL syringe without a needle. The syringe open-ing was placed firmly against the abaxial surface of the leaf, and the syringe plunger carefully pushed until a wa-ter-soaked area became visible. Care was taken not to in-jure the leaf with pressure from the syringe body. In all tests, each leaf was inoculated at eight sites with two leaves per replication and eight replications per genotype, resulting 128 inoculations per genotype. The control was inoculated with a 0.1% NaCl solution. Two inoculated leaves were placed in each plastic box (20 × 12 × 3 cm) containing agar-water 2% where petioles were stuck. The boxes were placed in individual clear plastic bags, sprayed periodically with distilled water to maintain high mois-ture conditions and submitted to a 12-h photoperiod (22.5
μmol m–2 s–1) at 27 ± 1ºC.
Inoculated sites were evaluated on the 6th, 8th, and 10th day after inoculation and rated according to the disease index proposed by Civerolo and Keil (1976) with modi-fications: 1 – immune (no symptoms); 2 - resistant (in-oculated area grey and dark vein); 3 – moderate resis-tance (inoculated area grey with dark vein, and water-soaking expanding beyond inoculation site); 4 – suscep-tible (inoculated area dark surrounded by yellow tissue); 5 – highly susceptible (necrosis spreading beyond the in-oculation site, with surrounding yellow tissue and dis-eased areas usually dropping out).
Experiment III – trees in containers: One-year-old peaches trees of the same genotypes described in the detached-leaf bioassay were potted in 0.02 m3 (20 L) con-tainers with two parts of solarized soil: one part of sand (by volume), and watered periodically with Hoagland’s modified nutrient solution. On August 28th, 2008, pot-ted trees were moved to a greenhouse, arranged as a completely randomized design with five replications, and kept in a high humidity environment using sprin-klers, at temperatures between 21 and 25ºC and natu-ral photoperiod (~11.5 h). On September 14th, 2008, a high level of natural infection of X. arboricola pv. pruni was observed, even without inoculation. Thus, three leaves were collected, at hazard, from the middle of each plant. Leaf and lesion areas were recorded with a leaf area meter (Licor-3100). The severity of bacterial infection was expressed as a percentage of leaf area with lesions.
Data on percentage was transformed as arc-sine x/100 whereas data of disease index was
be-tween the percentage of defoliation and leaf severity rat-ing were performed in both growrat-ing season (Exp. I).
Results and Discussion
Trees under field conditions: None of the peach geno-types were immune to X. arboricola pv. pruni; (Tables 2 and 3). However, susceptibility varied greatly (Tables 2 and 3), as observed by Layne (1966), Keil and Fogle (1974), Werner et al. (1986), Martins and Raseira (1996) and Kretzschmar et al. (1998). There was a significant corre-lation between disease severity and defoliation for both growing seasons, with r values equal to 0.79 (p d” 0.01), and 0.65 (p d” 0.01), for 2006/2007 and 2007/2008, respec-tively. Fruit infection was low and observed in only a few genotypes such as ‘Atenas’, ‘Conserva 1125’ and ‘Olimpia’ (data not shown). This observation agrees with those obtained by Werner et al. (1986), which observed low correlations between fruit infection with leaf sever-ity ratings and percentage of defoliation in North Caro-lina with r values equal to 0.30 (p = 0.01), and 0.54 (p d” 0.01), respectively. Different genes may control disease reaction in fruit and leaf tissue, as suggested by Layne (1966) and Werner et al. (1986). Both fruit and leaf infec-tion reacinfec-tion are of practical importance in peach because moderate to severely infected fruit are not marketable through normal commercial channels. Early defoliation in growing season may affect dormancy period through its negative influence on carbohydrate production and ac-cumulation (Alves et al., 2008). As the incidence of bacte-rial disease in fruits was only observed for genotypes Atenas, Conserva 1125 and Olímpia, in both growing sea-son, it is a strong indication that the other studied geno-types have good fruit resistance to X. arboricola pv. pruni. For the 2006/2007 growing season, the most resistant peach genotypes were ‘Tropic Snow’, ‘Conserva 871’, ‘Conserva 985’ and ‘Conserva 1129’, while the genotype ‘Conserva 1153’ showed the highest level of
susceptibil-ity (Table 2). Similar results were recorded during the 2007/2008 growing season, with ‘Tropic Snow’, ‘Conserva 871’, ‘Conserva 985’ and ‘Conserva 1129’ as the most resistant genotypes, while ‘Conserva 1127’, ‘Conserva 1125’, ‘Conserva 803’, ‘Rubimel’, and ‘Conserva 1153’ showed greater defoliation (Table 3).
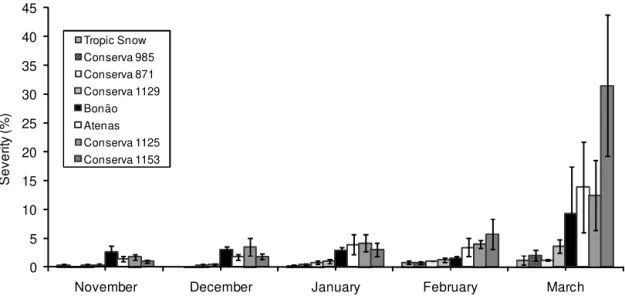
The BLS severity in the field increased throughout the growing season (Figure 1). BLS infection increased in susceptible genotypes from beginning of leafing to the last observation date. The AUDPC for disease incidence and severity, and the percent of defoliation caused by BLS were greater in 2006/2007 than in 2007/2008 grow-ing season (Tables 2 and 3) because the climatic condi-tions in 2006/2007 was more favorable for bacteria in-fection, with higher minimum, maximum and average temperature, higher relative humidity, and higher rainy days than in 2007/2008 (Table 1). Several studies have shown a relationship between the number of rainy days and disease occurrence. The pathogen is dependent on water for infection, colonization and dissemination. Dur-ing the 2007/2008 growDur-ing season, the long periods of drought, mainly during the 3rd observation (01.20.2008) may have contributed to a lower occurrence of BLS, re-sulting in a lower AUDPC for disease incidence and se-verity, as well as lower leaf defoliation.
Identification of resistant genotypes should be per-formed under optimum conditions for disease develop-ment in order to obtain a clear separation between sus-ceptible and resistant genotypes, as observed in the 2006/ 07 cycle. Even so, it is important to highlight how diffi-cult it is to screen genotypes for resistance to BLS using only field evaluations. Normally, high incidence and se-vere BLS were observed on shoots that were exposed to the action of prevailed winds. This is an indication of how important it is to protect the plants from the direct action of wind, especially in commercial orchards.
There were differences among genotypes in severity of BLS on the leaves, which ranged from 1.5 to around
0 5 10 15 20 25 30 35 40 45
November December January February March
Sever
ity
(
%
)
Tropic Snow Conserva 985 Conserva 871 Conserva 1129 Bonão Atenas Conserva 1125 Conserva 1153
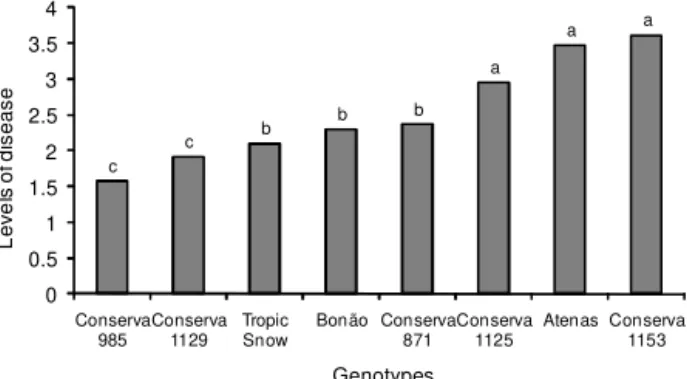
3.5. The genotypes that showed the lowest rates of dis-ease were ‘Conserva 985’ and ‘Conserva 1129’, while ‘Conserva 1153’, ‘Conserva 1125’ and ‘Atenas’ had the highest rates. ‘Tropic Snow’, ‘Bonão’ and ‘Conserva 871’ showed intermediate rates of infection. No immune geno-types (Figure 2) were detected, as observed by Kretzschmar et al. (1998) evaluating the response of peach varieties to X. arboricola pv. pruni under field conditions and after inoculation by infiltration. There were no dif-ferences among genotypes in relation to the severity of BLS under greenhouse conditions (p ≤ 0.01, Scott-Knott test). CV. = 58.6 %). The greenhouse environment, suit-able for canker development, together with a high con-centration of initial inoculum, may have resulted in wa-ter-soaked spots even in the most resistant genotypes.
On the resistant genotypes, small punctiform or small lesions, with reduced or no chlorotic spots, were observed in the leaf area with a shot hole in the center of the le-sion indicating a probably hypersensitive reaction (HR). This reaction is mainly determined by the metabolic ca-pacity of the plant and could lead to a high degree of dis-ease resistance (Pascholati and Leite, 1995). The mean temperature (21.5°C) during the evaluation periods is within the range of temperature for the multiplication of bacteria (16ºC to 33ºC) but below the critical level (28°C), over which prevents the appearance of HR.
The cv. ‘Tropic Snow’ had a hypersensitive reaction with lesions dropping out, without halo. The genotypes considered as susceptible showed large and angular le-sions with coalescence damaging vast areas, usually con-centrated towards the leaf tip, with presence of a chlo-rotic halo. Another observed factor is that in resistant genotypes the leaves remained green, photosynthetically active, unlike susceptible genotypes for which infected leaves turn yellow and drop off. The high number of clones that were resistant to BLS in a breeding program where this disease had not previously occurred led Sherman and Lyrene (1981) to suggest dominant genes for resistance. Even so, more study must be done to elu-cidate the mechanism of resistance and heritability of this trait.
As a conclusion, peach trees genotypes exhibited vari-able reactions to BLS. Peaches genotypes ‘Conserva 985’ and ‘Conserva 1129’ were identify as possible source of BLS resistance, while genotypes Conserva 1153, Conserva 1125 and ‘Atenas’ were susceptible.
Acknowledgements
This research was supported in part by the Embrapa Clima Temperado and CAPES (Fundação Coordenação de Aperfeiçoamento de Pessoal de Nível Superior).
References
Alves, G.; May De Mio, L.L.; Zanette, F.; Oliveira, M.C. 2008. Peach rust and its effect on the defoliation and carbohydrate concentration in branches and buds. Tropical Plant Pathology 33: 370-376. (in Portuguese, with abstract in English). Campbell, C.L.; Madden, L.V. 1990. Introduction to Plant Disease
Epidemiology. Willey, New York, NY, USA.
Citadin, I.; Assmann, A.P.; Mazaro, S.M.; Gouvêa, A.; Danner, M.A.; Malagi, G. 2008. Diagramatic scale to evaluate the severity of bacteriose in peach trees. Revista Brasileira de Fruticultura 30: 327-330. (in Portuguese, with abstract in English). Civerolo, E.L.; Keil, H.L. 1976. Evaluation of Prunus spp resistance
to Xanthomonas pruni by artificial inoculation. Fruit Varieties Journal 30: 17-18.
Cruz, C.D. 2001. GENES - Softwarefor Experimental Statistics in Genetics. UFV, Viçosa, MG, BR. (in Portuguese).
European and Mediterranean Plant Protection Organization [EPPO]. 2006. Xanthomonas arboricola pv. pruni. EPPO Bulletin 36: 129-133.
Keil, H.L.; Fogle, H.W. 1974. Orchard susceptibility of some apricot, peach and plum cultivars and selections to Xanthomonas pruni. Fruit Varieties Journal 28: 16-19.
Kretzschmar, A.A.; Rosseto, E.A.; Martins, O.M. 1998. Resistance of some peach cultivars to Xanthomonas campestris pv. pruni inoculated by infiltration of detached leaves. Revista Brasileira de Fruticultura 20: 213-219. (in Portuguese, with abstract in English).
Layne, R.E.C. 1966. Susceptibility of apricots to bacterial spot infection of foliage and fruit. Plant Disease Reporter 50: 112-115. Martins, O.M.; Raseira, M.C.B. 1996. Sources of bacterial spot resistance in plum cultivars. Fruits Varieties Journal 50: 156-159. Nogueira, E.M.C.; Rodrigues Neto, J. 1982. Xanthomonas campestris
pv. pruni in Prunus spp. in São Paulo State. O Biológico 48: 227-229. (in Portuguese, with abstract in English).
Pascholati, S.F.; Leite, B. 1995. Host: resistance mechanism. p. 417-454. In: Bergamin Filho, A.; Kimati, H.; Amorim, L., eds. Hand-book of phytopathology: origins and concepts. Agronômica Ceres, São Paulo, SP, Brazil. (in Portuguese). Randhawa, P.S.; Civerolo, E.L. 1985. A detached leaf bioassay for
Xanthomonas campestris pv. pruni.Phytopathology 75: 1060-1063. Raseira, M.C.B.; Nakasu, B.H. 1998. Cultivars: descriptions and recommendations. p. 29-99. In: Medeiros, C.A.B.; Raseira, M.C.B., eds. Peach culture. Embrapa-SPI, Brasília, DF, Brazil. (in Portuguese).
Rom, R.C.; Moore, J.N. 1979. Peach cultivar situation in the Midwest and Central South. Fruit Varieties Journal 33: 25-29. Scorza, R.; Sherman, W.B. 1996. Peaches. p. 325-440. In: Janick, J.;
Moore, J.N., eds. Fruit breeding: tree and tropical fruits 1. Wiley, New York, NY, USA.
Sherman, W.B.; Lyrene, P.M. 1981. Bacterial spot susceptibility in low chilling peaches. Fruit Varieties Journal 35: 74-77. Werner, D.J.; Ritchie, D.F.; Cain, D.W.; Zehr, E.I. 1986.
Susceptibility of peaches and nectarines, plant introductions, and other Prunus to bacterial spot. HortScience 21: 127-130. c
c b
b b
a
a a
0 0.5 1 1.5 2 2.5 3 3.5 4
Conserva 985
Conserva 1129
Tropic Snow
Bonão Conserva 871
Conserva 1125
Atenas Conserva 1153
L
ev
e
ls
of
di
s
eas
e
Genotypes
Figure 2 –Reactions of detached leaves from peach genotypes. Levels of disease are based on the scale proposed by Civerolo and Keil (1976). Means followed by same letter do not differ (p ≤ 0.01, Scott-Knott test).