Numerical modeling of actual evapotranspiration
of a coffee crop
Andrés Cesanelli, Luis Guarracino*
Universidad Nacional de La Plata/Facultad de Ciencias Astronómicas y Geofísicas/ CONICET, Paseo del Bosque s/n – B1900FWA – La Plata, Argentina.
*Corresponding author <[email protected]> Edited by: Klaus Reichardt
ABSTRACT:The evapotranspiration estimation has great importance to crop productivity and agricultural water management. In this study, evapotranspiration is analyzed in a coffee (Coffea arabica L.) crop located in Piracicaba, state of São Paulo (Brazil) using a numerical method based on the simulation of both water flow and crop activity in the unsaturated zone of the soil. Actual evapotranspiration is estimated from potential evapotranspiration using water stress functions, meteorological data, soil hydraulic parameters, crop coefficients and leaf area index values. Crop transpiration and soil evaporation are individually quantified improving the analysis of the evapotranspiration process. The numerical procedure can predict periods of crop water stress and becomes an attractive tool to analyze the effect of non-standard conditions on coffee crops and to design efficient irrigation schedules. Simulated evapotranspiration values are in good agreement with experimental values determined in the study site. Key words: soil evaporation, crop transpiration, unsaturated zone, mathematical models
Introduction
In recent years the quantification of evapotranspiration (ET) has received special attention in many agronomic ap-plications. ET plays a key role in the analysis of crop devel-opment under conditions of limited water resources (Rana and Katerji, 2000). The estimation of ET is also important to optimize irrigation scheduling since crop productivity de-pends on water availability in the soil profile during vegeta-tive and reproducvegeta-tive phases.
The aim of this study is to analyze the ET in an ex-perimental coffee crop grown in Piracicaba, state of São Paulo, Brazil, (22°43' S; 47°38' W) using a numerical method recently proposed by Cesanelli and Guarracino (2009). Several models exist in the literature to describe in-dividual components of the land-plant-atmosphere system but unfortunately only few methods for estimating ET ob-tain benefit from these models. The proposed method is based on the numerical simulation of water flow in the soil profile and uses several well-known models for describ-ing different components of this complex system. Al-though this method is an alternative to standard methods, it has only been tested and proven for a native green grass in La Plata (Argentina). In this context, the main contribu-tion of this work is to extend and verify the applicability of the method to a different crop and climatic conditions, such as the case of the coffee crop grown in Piracicaba (Bra-zil).
Coffee (Coffea arabica L.) farming is one of the most important agribusinesses in Brazil. A number of experimen-tal studies were conducted last years to investigate the effect of climatic and environmental conditions on coffee crop de-velopment (Carr, 2001; Villa Nova et al., 2002; DaMatta, 2004; Marin et al., 2005; Sentelhas et al., 2006; Lin, 2007; Sato et al., 2007). In this study we used numerical simulation tech-niques in conjunction with detailed information of soil and
crop properties to evaluate the ET process. An important advantage of the proposed method is the individual com-putation of soil evaporation (E) and crop transpiration (T). This type of analysis is especially useful in agricultural prac-tices where E is considered an unproductive loss of water (Wallace et al., 1999). Simulated values of ET are compared with experimental data (Silva et al., 2006) and reasonably good agreement between both series is found. The numeri-cal results illustrate the ability of the proposed method to estimate actual ET and to predict the effective water con-sumption of the coffee crop.
Materials and Methods
In this section, it is presented a brief description of the numerical method and the experimental data used to esti-mate the E, T and ET of the coffee crop. Further details of the proposed method and its numerical implementation can be found in Cesanelli and Guarracino (2009). The experimen-tal data are extensively described by Silva et al. (2006), Timm et al. (2006), Bruno et al. (2007), and Timm et al. (2011).
The numerical method proposed by Cesanelli and Guarracino (2009) estimates actual values of E, T and ET from their respective potential values using the following lin-ear relationships:
EA = kEEp
TA = kTTp
ETA = kETETp (1)
T P
( )
( ) ( ) ( ) ( )
h
K h h z h g z T
t z z
∂ − ∂ ⎛ ∂ + ⎞=
⎜ ⎟
∂ ∂ ⎝ ∂ ⎠
θ β
(2)
where h is the soil water matric potential head, t is the time, z is the vertical coordinate and the gravitational potential head,θ(h) is the water content, K(h) is the soil hydraulic con-ductivity, βT(h) is a water stress function for crop transpira-tion and g(z) is the root density function. Note that the right-hand side of Eq. (2) is a sink term that describes the root water uptake by plants.
The soil evaporation process is assumed to be limited to the soil surface (ztop) and it is modeled by the following boundary condition:
(
)
E P( ) P ( )E
K h h z h
z β
∂
− + = −
∂ (3)
where P is the rainfall intensity and βE(h) is a water stress function for soil evaporation. At the bottom edge of the domain (zbot) a Dirichlet type boundary condition is pre-scribed:
h(t) = zwt(t) – zbot (4)
where zwt(t) denotes the position of the water table as a func-tion of time.
The proposed method assumes that EP, TP and ETP val-ues are known. ETP can be expressed as (Allen et al., 1998):
ETp = kCET0 (5)
where: ET0 is the reference evapotranspiration, which can be estimated from meteorological data, and kC is the crop coef-ficient. The potential values of E and T are obtained using the Beer-Lambert law (Huygen et al.,1997):
Ep = ETp exp(–γ LAI)
Tp = ETp (1 –exp(–γ LAI)) (6)
where LAI is the leaf area index andγ is the extinction coef-ficient which accounts for the interception of the radiation by vegetation.
It can be shown by integrating Richards’ equation in time and space that the daily water stress coefficients kE and kT have the following expressions (Cesanelli and Guarracino, 2009):
( )
24
0
E E
24 0
1 t
t
k h dt
t t β
=
−
∫
( )
( )
top 24
0 root
T T
24 0
1 t z
t z
k g z h dz dt
t t β
=
−
∫ ∫
(7)where zroot is the limit of the root zone and (t0, t24) defines a time period of one day. Given that ETA is equal to the sum of EA and TA, the water stress coefficient kET can be expressed:
kET = kE exp(–γ LAI) + kT(1– exp(–γ LAI)) (8)
Based on the previous equations and definitions, the pro-posed method to estimate EA, TA and ETA can be stated as
follows: (i) compute ETP with a daily resolution using Eq. (5) and obtain the partition between EP and TP using Eq. (6); (ii) solve Richards’ equation (2) with the boundary con-ditions (3) and (4) using a finite element method; (iii) com-pute daily water stress coefficients kE, kT and kETfrom the numerical solutions of Richards’ equation using Eqs. (7) and (8); and (iv) compute daily EA, TA and ETA using Eq. (1).
The experimental data used in this study were obtained in an experimental coffee plot located in Piracicaba (Silva et al. 2006). The area of the plot has 0.2-ha and is divided into 15 subplots with 120 plants each. The climate of this region is mesothermic with a dry season from April to September, being July the driest month, and a wet season from Octo-ber to March. Annual average temperatures, rainfall and rela-tive humidity are 21.1ºC, 1257 mm and 74%, respecrela-tively. The soil is a Rhodic Kandiudalf, locally called “Nitossolo Vermelho Eutroférrico” and the variety of coffee plants
(Coffea arabica L.) is “Catuaí Vermelho”. The period of this
analysis is restricted to two years (from September 2003 to August 2005) in accordance with the available experimental data.
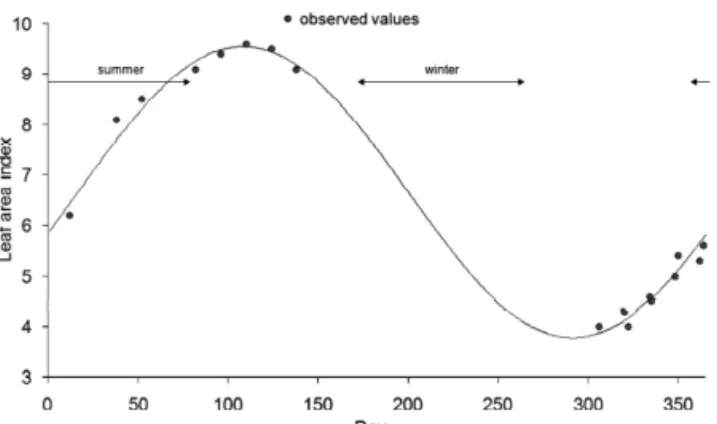
Reference ET (ET0) is computed with the FAO Penman-Monteith equation using the standard method presented in (Allen et al., 1998) with daily meteorological data obtained from an automatic weather station located about 200 m from the experimental plot. The FAO Penman-Monteith equation is a simplified representation of the classical Penman-Monteith model that uses standard climatological records of air temperature, relative humidity, wind speed and net radia-tion. The range of ET0 values varies from 0.27 to 7.35 mm per day for the study period. The daily values of ETP are calculated using Eq. (5) and experimental crop coefficients determined by Silva et al. (2006). The partition between EP and TP is obtained using Eq. (6). Due to the lack of a spe-cific estimate of extinction coefficient γ, this parameter is as-sumed to be 0.53, which is the value determined by Angelocci et al. (2008) for a similar coffee crop. On the other hand, and since only few values of LAI are available, the following expression is used to estimate daily values of LAI through the year (Sumner and Jacobs, 2005):
LAI(j) = c1 sin(2π j / 366 + c2) + c3 (9)
where: j is the day of year, c1 = 2.88402, c2 = -0.289465 and c3 = 6.6668. The values of model parameters c1, c2 and c3 are obtained by fitting expression (9) to the experimental values of LAI using an exhaustive search method. The choice of model (9) is motivated by the seasonal behavior of LAI data in the study region. Figure 1 shows the experimental values of LAI and the fitted curve for LAI evolution Eq. (9).
The hydraulic properties of the soil are described using the well-known Van Genuchten model (Van Genuchten, 1980):
θ(h) = (θs – θr) [1+(α⏐h⏐)n]–1+1/n + θ
r
K(h) = Ks [1 – (α⏐h⏐)n–1 (1 + (α⏐h⏐)n)–1+1/n]2 (1+ (α⏐h⏐)n)–(1/2–1/2n) (10)
and KS is the saturated soil hydraulic conductivity. The Van Genuchten parameters θr, θs,α and n are computed using the pedotransfer functions for Brazilian soils derived by Tomasella et al. (2000). Given a bulk density of 1530 kg m–3 (Timm et al., 2006) and considering the percentage of
sand (29%), silt (16%), clay (55%) and organic matter (2.5%) of the Nitossolo Vermelho Eutroférrico soil (Silva et al., 2006) the following values of Van Genuchten pa-rameters are obtained: θs = 0.4346, θr = 0.2275, α = 3.11 m–1 and n = 1.5492. The saturated soil hydraulic
conduc-tivity KS is estimated as 468.64 mm per day by Silva et al. (2007).
Water stress functions βE(h) and βT(h) are assumed to have the following expressions:
( )
(
0) (
1)
E E2 E2 E1 E1
1
1
h h h h h h
β =⎧⎪⎨ − − −
⎪⎩
E1
E1 E2
E2
h h
h h h
h h
< < <
>
( )
(
0) (
1)
T T2 T2 T1 T1
1
1
h h h h h h
β =⎧⎪⎨ − − −
⎪⎩
T1
T1 T2
T2
h h
h h h
h h
< < <
> (11)
where hE1 and hT1 are cut-off values for E and T processes; and hE2 and hT2 are cut-off values for E and T under stan-dard conditions, respectively. Based on previous studies (e.g. Li et al., 2001) hE1 = hT1 = - 150 m and hE2 = hT2 = - 1 m are considered. Since more than 98% of the root system is con-tained in a soil layer of 1 m (Silva et al., 2006) a constant density function g(z)=1/(ztop - zroot) and a root zone that ex-tends to this depth (zroot= ztop-1m) are assumed. The mean water table is estimated to be 1.75 m below ground level during the simulation period.
Numerical solutions of Richards’ equation are obtained using a mixed finite element method in space combined with a backward Euler scheme in time. A modified Picard itera-tion scheme is employed to deal with the non-linear terms of Richards’ equation (Celia et al., 1990). The simulation do-main consists of a homogeneous soil profile of 2.0 m wide, discretized with a non-uniform mesh of 280 nodes. A vari-able time step is used for temporal discretization.
Results and Discussion
Daily values of both potential (TP) and actual transpira-tion (TA) for the study period are shown in Figure 2. As ex-pected, the estimated values of TP show seasonal variations. During spring and summer TP is, on average, approximately 4 mm per day, while during autumn TP decreases and most of the values range between 1 mm per day and 3 mm per day. In particular, TP shows high variability during the sum-mer of 2004 (values range from 1.5 mm per day to 9.5 mm per day) and an important decrease at the beginning of the winter of 2004 (values are lower than 1.5 mm per day). The temporal pattern observed for TP satisfactorily agrees with the coffee crop activity under normal conditions in Brazil, which is maximum from October to March, moderate from April to June, and minimum from July to September (Sato et al., 2007).
It is possible to identify two soil-water situations from the analysis of TA. As expected, optimal soil-water condi-tions are mainly observed during the wet season (October to March), when the estimates of TA and TP are similar, es-pecially after each strong rainfall event. These optimal condi-tions are also observed during the first part of the dry sea-son (April to June) because the crop transpiration demand is low (i.e. low TP) and the water available in the soil can respond to this demand (e.g. from day 250 to day 280). Con-versely, the largest differences between TA and TP take place during the last part of the dry season (July to September) indicating that water availability in the unsaturated zone is very limited (e.g. from day 370 to day 400). However, TA can abruptly increase after a strong rain event, as observed at the end of the study period (day 727). Although these specific periods of crop water stress are required by coffee plants to blossom, an extended drought can damage the plant and may cause flower loss with a significant decrease in produc-tivity (Silva et al., 2006; Lin, 2007). The water deficit predicted by the model can be used to design irrigation management strategies so as to avoid a decline in productivity.
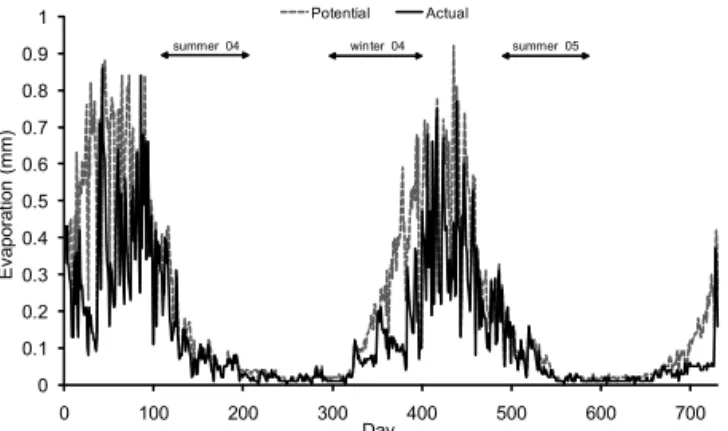
Simulated values of potential (EP) and actual evapora-tion (EA) are shown in Figure 3. EP values are very low com-pared to TP values and present a periodic pattern mainly de-termined by LAI evolution (Figure 1). The highest EP rates
Figure 2 – Daily values of potential and actual transpiration during the study period (day 1 = 01/09/2003).
0 1 2 3 4 5 6 7 8 9 10
0 100 200 300 400 500 600 700
T
rans
p
ir
at
io
n (
m
m
)
Day
Potential Actual
summer 04 winter 04 summer 05
Figure 1– Observed and fitted values of leaf area index for the experimental coffee crop during one year (day 1 = 1st
(between 0.8 mm per day and 0.9 mm per day) are observed during spring, when plants reach the minimum area covered by leaves after the period of crop water stress that takes place from July to September. From mid-summer to mid-winter, EA is approximately constant and has the lowest values (EA ≈ EP < 0.1 mm per day). During the rest of the simulation period, EA presents high variability with amplitudes lower than EP.
Daily values of potential (ETP) and actual evapotranspi-ration (ETA) for the study period (Figure 4) indicate that ac-cording to the previous analysis ETA is mainly determined by crop transpiration. In spring and summer ETA presents great variability with values ranging from 1 mm per day to 8 mm per day approximately. On the other hand, during au-tumn and winter ETA is less variable and has very low val-ues (ETA reaches rates higher than 3 mm per day only in a few cases). The comparison between ETA and ETP shows that water demand is satisfied over most of the simulated period, except for the last months of the dry season (July to September). Some researchers argue that, throughout these drought periods, water uptake decreases as a consequence of the small values of hydraulic conductivity in the soil profile. Note that this relation between root water uptake and soil hydraulic properties is explicitly considered in the numerical model.
Numerical estimates of ETA are validated with mental values determined by Silva et al. (2006). The experi-mental data set consists of 52 ETA values obtained every 14 days from a classical water balance experiment using the avail-able field data (measurements of rainfall, irrigation, runoff, soil water content and different meteorological variables). To compare numerical and experimental results, daily simulated values of ETA are integrated over periods of 14 days. The agreement between simulated and observed ETA values is shown in Figure 5. The root mean square difference (RMS) is 0.86 mm per day while the coefficient of determination R2 is 0.68. Silva et al. (2006) estimated that the variability of
ET values range between 27% and 470% through error propagation analysis. According to these results, simulated values can be considered within the range of the experimen-tal determination.
Finally, it is worth mentioning that the estimation of ac-tual ET is one of the most difficult tasks in soil and agricul-tural sciences due to the complex interactions amongst the components of the land-plant-atmosphere system. Although many models have been developed to characterize individual components, only a few methods for estimating ET take advantage of these models. In this sense, the proposed method integrates several of these specific models through a sink term and boundary conditions in Richards’ equation. For example, the Van Genuchten model is used for describ-ing the hydraulic properties of the soil, the FAO Penman-Monteith equation for computing reference ET, the Beer-Lambert law for partitioning E and T components, a sinu-soidal function for estimating LAI evolution, and the ex-pression (11) for modeling water stress functions. All these models are well-known and have been used in many applied studies. However, each of them can be easily replaced in the computational code by more adequate models for a particu-lar crop, soil or climatic condition.
In conclusion, a new method for estimating ET was ap-plied to an experimental data set of a coffee crop grown in Piracicaba. This method has been recently proposed by Cesanelli and Guarracino (2009) and is based on the numeri-cal simulation of both water flow and crop activity in the unsaturated zone of the soil profile. Soil evaporation and crop transpiration are individually estimated improving the
Figure 5 – Comparison between observed and estimated values of actual evapotranspiration (day 1 = 01/09/2003). Figure 3 – Daily values of potential and actual evaporation during
the study period (day 1 = 01/09/2003).
Figure 4 – Daily values of potential and actual evapotranspiration during the study period (day 1 = 01/09/2003).
0 10 20 30 40 50 60 70 80 90 100
0 100 200 300 400 500 600 700
A
c
tual ev
apot
rans
pir
a
ti
on
(m
m
)
Day
estimated values observed values summer 04 winter 04 summer 05
0 0.1 0.2 0.3 0.4 0.5 0.6 0.7 0.8 0.9 1
0 100 200 300 400 500 600 700
E
v
ap
or
at
io
n (
m
m
)
Day
Potential Actual
understanding of the ET process. Soil hydraulic properties and crop development are included explicitly in the numeri-cal modeling using both field data and parameter values from the literature. The proposed analysis shows that the effect of soil evaporation on ET is subtle and therefore wa-ter consumption in the experimental plot is mainly dewa-ter- deter-mined by crop transpiration. Two soil-water situations are identified from the comparison between potential and ac-tual values of ET. Optimal soil-water conditions are observed during most of the simulation period while non-standard conditions are observed during specific periods of crop wa-ter stress (July to September). Simulated values of ET are in reasonable good agreement with the available experimen-tal data. The proposed analysis illustrates the usefulness of the numerical method as a predictive and management tool in agricultural practices.
Acknowledgments
To Isabeli Pereira Bruno and Klaus Reichardt from CENA (USP) for providing data and bibliographic material, and for making helpful comments.
References
Allen, R.G.; Pereira, L.S.; Raes, D.; Smith, M. 1998. Crop Evapotranspiration: Guidelines for Computing Crop Water Requirements. FAO, Rome, Italy. (Irrigation and Drainage Paper, 56).
Angelocci, L.R.; Marin, F.R.; Pilau, F.G.; Righi, E.Z.; Favarin, J.L. 2008. Radiation balance of coffee hedgerows. Revista Brasileira de Engenharia Agrícola e Ambiental 12: 274-281.
Bruno, I.P.; Silva, A.L.; Reichardt, K.; Dourado-Neto, D.; Bacchi,O.O.S.; Volpe, C.A. 2007. Comparison between climatological and field water balances for a coffee crop. Scientia Agricola 64: 215-220. Carr, M.K.V. 2001. The water relations and irrigation requirements of
coffee. Experimental Agriculture 37: 1-36.
Ces anelli, A. ; Guarracino, L. 2009. Estimation of actual evapotranspiration by numerical modeling of water flow in the unsaturated zone: a case study in Buenos Aires, Argentina. Hydrogeology Journal 17: 299-306.
Celia, M.A.; Bouloutas, E.T.; Zarba, R.L. 1990. A general mass-conservative numerical solution for the unsaturated flow. Water Resources Research 26: 1483-1496.
DaMatta, F.M. 2004. Exploring drought tolerance in coffee: a physiological approach with some insights for plant breeding. Brazilian Journal of Plant Physiology 16: 1-6.
Huygen, J.; Van Dame, J.C.; Kroess, J.G.; Wesseling, J.G. 1997. SWAP 2.0: Input and Output Manual. Wageningen Agricultural University/ DLO-Staring Centrum. Wageningen, The Netherlands.
Li, K.Y.; De Jong, R.; Boisvert, J.B. 2001. An exponential root-water-uptake model with water stress compensation. Journal of Hydrology 252: 189-204.
Lin, B.B. 2007. Agroforestry management as an adaptive strategy against potential microclimate extremes in coffee agriculture. Agricultural and Forest Meteorology 144: 85-94.
Marin, F.R.; Angelocci, L.R.; Righi, E.Z.; Sentelhas, P.C. 2005. Evapotranspiration and irrigation requirements of a coffee plantation in Southern Brazil. Experimental Agriculture 41: 187-197.
Rana, G.; Katerji, N. 2000. Measurement and estimation of actual evapotranspiration in the field under Mediterranean climate: a review. European Journal of Agronomy 13: 125-153.
Richards, L. 1931. Capillary conduction of liquids through porous mediums. Physics 1: 318-333.
Sato, F.A.; Silva, A.M.; Coelho, G.; Silva, A.C.; Carvalho, L.G. 2007. Coffee crop coefficient (Kc) (Coffea arabica L.) during the autumn-winter period in Lavras-MG region. Engenharia Agrícola 27: 383-391. (in Portuguese).
Sentelhas, P.C.; Gillespie, T.J.; Gleason, M.L.; Monteiro, J.E.B.M.; Pezzopane, J.R.M.; Pedro, M.J. 2006. Evaluation of a Penman-Monteith approach to provide “reference” and crop canopy leaf wetness duration estimates. Agricultural and Forest Meteorology 141: 105-117.
Silva, A.L.; Roveratti, R.; Reichardt, K.; Santos Bacchi, O.O.; Timm, L.C.; Pereira Bruno, I.; Martins Oliveira, J.C.; Dourado-Neto, D. 2006. Variability of water balance components in a coffee crop in Brazil. Scientia Agricola 63: 105-114.
Silva, A.L.; Reichardt, K.; Roveratti, R.; Santos Bacchi, O.O.; Timm, L.C.; Martins Oliveira, J.C.; Dotado-Neto, D. 2007. On the use of soil hydraulic conductivity functions in the field. Soil and Tillage Research 93: 162-170.
Sumner, D.M.; Jacobs, J.M. 2005. Utility of Penman-Monteith, Priestley-Taylor, reference evapotranspiration, and pan evaporation methods to estimate pasture evapotranspiration. Journal of Hydrology 308: 81-104.
Timm, L.C.; Pires, L.F.; Roveratti, R.; Arthur, R.C.J.; Reichardt, K.; Oliveira, J.M.C.; Bacchi, O.O.S. 2006. Field spatial and temporal patterns of soil water content and bulk density changes. Scientia Agricola 63: 55-64.
Timm, L.C.; Dourado-Neto, D.; Bacchi, O.O.S.; Hu, W.; Bortolotto, R.P.; Silva, A.L.; Bruno, I.P.; Reichardt, K. 2011. Temporal variability of soil water storage evaluated for a coffee field. Australian Journal for Soil Research 49: 77- 86.
Tomasella, J.; Hodnett, M.G.; Rossato, L. 2000. Pedotransfer function for the estimation of soil water retention in Brazilian soils. Soil Science Society of America Journal 64: 327-338.
Van Genuchten, M.T. 1980. A closed-form equation for predicting the hydraulic conductivity of unsaturated soils. Soil Science Society of America Journal 44: 892-898.
Villa Nova, N.A.; Favarin, J.L.; Angelocci, L.R.; Dourado-Neto, D. 2002. Estimate of coffee crop coefficient as a function of climatic and phyto-technical variables. Bragantia 61: 81-88. (in Portuguese, with abstract in English).
Wallace, J.S.; Jackson, N.A.; Ong, C.K. 1999. Modelling soil evaporation in an agroforestry system in Kenya. Agricultural and Forest Meteorology 94: 189-202.