______________________________________________________
1 Doutorando em Eng. Agrícola do Programa de Pós-Graduação da Feagri/UNICAMP, Campinas-SP, rafageo2003@yahoo.com.br 2 Dr. em Eng. de Transportes, Pesquisador do Núcleo Interdisciplinar de Planejamento Energético - NIPE, Professor do Programa de
Pós-Graduação da Feagri/UNICAMP, Campinas-SP, rubens.lamparelli@gmail.com
3 Dr. em Sensoriamento Remoto, Prof. Associado, Programa de Pós-Graduação da Feagri/UNICAMP, Campinas-SP,
jansle.rocha@feagri.unicamp.br
Recebido pelo Conselho Editorial em: 28-5-2013
MAPPING
RAFAEL C. BISPO1, RUBENS A. C. LAMPARELLI2, JANSLE V. ROCHA3
ABSTRACT: Coffee production was closely linked to the economic development of Brazil and, even today, coffee is an important product of the national agriculture. The State of Minas Gerais currently accounts for 52% of the whole coffee area in Brazil. Remote sensing data can provide information for monitoring and mapping of coffee crops, faster and cheaper than conventional methods. In this context, the objective of this study was to assess the effectiveness of coffee crop mapping in Monte Santo de Minas municipality, Minas Gerais State, Brazil, from fraction images derived from MODIS data, in both dry and rainy seasons. The Spectral Linear Mixing Model was used to derive fraction images of soil, coffee, and water/shade. These fraction images served as input data for the supervised automatic classification using the SVM – Support Vector Machine approach. The best results concerning Overall Accuracy and Kappa Index were obtained in the classification of the dry season, with 67% and 0.41, respectively.
KEYWORDS: spectral linear mixing model; supervised classification; Overall Accuracy; Kappa Index.
UTILIZAÇÃO DE IMAGENS-FRAÇÃO DERIVADAS DO SENSOR MODIS PARA O MAPEAMENTO DE LAVOURAS DE CAFÉ
RESUMO: A produção de café esteve intimamente ligada ao desenvolvimento econômico do Brasil e ainda hoje o café é um importante produto da agricultura nacional. O Estado de Minas Gerais responde atualmente por 52% de toda a área de café do Brasil. Dados de sensoriamento remoto podem fornecer informações para o monitoramento e o mapeamento de café de maneira mais rápida e menos onerosa do que os métodos convencionais. Nesse contexto, o objetivo deste trabalho foi avaliar a eficácia do mapeamento de áreas de café do município de Monte Santo de Minas-MG, a partir de imagens-fração derivadas do sensor MODIS, nas estações de estiagem e de chuva. Através do Modelo Linear de Mistura Espectral, foram derivadas imagens-fração de solo, café e água/sombra. Estas imagens-fração serviram como dados de entrada para a classificação automática supervisionada com o método SVM –Support Vector Machine. Os melhores resultados
de Exatidão Global e Índice Kappa foram obtidos na classificação do período seco, sendo 67% e 0,41, respectivamente.
PALAVRAS-CHAVE: modelo linear de mistura espectral; classificação supervisionada; Exatidão Global; Índice Kappa.
INTRODUCTION
crop), showed that coffee plantations have been increasing. For crops of 2012, 2,329.4 million hectares (ha) were accounted, with the predominance of Arabica and Conillon species. This result
shows an increase of 2.25% over the existing areas in 2011.
In this context, the state of Minas Gerais is known for being the main producer in the country, represented by 70% of the national Arabica production. Given the economic and social importance
of the coffee industry in Minas Gerais, complementary specialized information is necessary for the economic and environmental development of its productive system, which is intrinsically linked to management practices and erosion control . However, data collection of the whole coffee complex through conventional methods such as field survey with producers, cooperatives, and official government agencies, is an activity that demands time, cost and labor. Thus, techniques of Remote Sensing and Geoprocessing add to other already existing monitoring techniques, since it is possible to obtain information that has characteristics of temporality and synoptic view.
There are several studies on Remote Sensing applied to coffee plantations. LAMPARELLI et al. (2012) obtained good results in distinguishing coffee crops under different conditions in Montes Claros, Minas Gerais State, when using data mining techniques and spectral curves from Hyperion/EO1 sensor, with the spatial resolution of 30 meters.
A study by MOREIRA et al. (2010) showed that several areas identified in Ikonos images, obtained from 2003 and 2004 Google Earth site, as coffee plantations could not be recognized in 2007 TM/Landsat-5 images. Among the difficulties, the authors cite crop pruning, what converts it into an aspect of bare soil; crop renovation; replacement by other crops, especially sugarcane in São Paulo State; and the shading effect in areas of rugged terrain.
SANTOS et al. (2012) mention that another difficulty in identifying coffee areas lies in the fact that this culture usually grows in mountainous regions, what causes shading and distortions in the spectral response. Classification and interpretation of shaded targets in the image is, thus, hampered, due to reduction or total loss of the spectral response. Moreover, coffee growing is not a seasonal activity and, therefore, there might be coffee crops of different ages in the same region, what also affects the observed spectral patterns.
As observed, one of the problems in mapping coffee crops lies in the spectral mixing. Among various remote sensing techniques to solve and/or minimize the issue of the spectral mixing of different targets within a single pixel, the Spectral Linear Mixing Model (SLMM) has proved crucial. Applying the SLMM, it is possible to decompose the spectral response, which generates fraction images representing the proportions of each component in the pixel formation (SHIMABUKURO & SMITH, 1991).
Examples of SLMM application in studies on agricultural crops are numerous. ALVES (2009), for instance, showed the possibility of mapping irrigated rice crops in Rio Grande do Sul State using segmentation and classification techniques on fraction images derived from SLMM in MODIS images, MOD13Q1 product. The author concluded that the use of fraction images is feasible in mapping, since these allow properly identification of soil, vegetation, and water areas.
Another successful example was described by AGUIAR (2007), who employed SLMM on daily reflectance images of the MODIS/Terra sensor to identify sugarcane harvesting practices, either pre-harvest burning or mechanized. In this study, three endmembers were chosen based on the reflectance values of bands 1, 2, 5, and 6, of MODIS/Terra sensor, MOD09GHK product: cane (for areas with growing sugarcane), straw (for areas of green harvest), and burning (for areas of pre-harvest burning).
in the period. These products of MODIS composition make it more advantageous towards other sensors when there is the problem of clouds during satellite transit.
Currently, regarding techniques of automatic classification, there is a variety of options from the simplest to the most complex ones, such as Support Vector Machine (SVM). In the case of coffee crops, SVM is promising because of its potential to classify heterogeneous areas with few training samples (MELGANI & BRUZZONE 2004).
SHAO & LUNETTA (2012) classified the land cover of the Albemarle-Pamlico Estuarine System located in the United States using MODIS time series data. The authors compared the performance of SVM with two conventional methods: neural networks and decision tree, considering the amount, variability and purity of training samples. The SVM presented higher accuracy and Kappa coefficient significant improvement for the entire range of training samples in comparison with other algorithms. The results indicate that SVM had greater ability to generalize, especially when using less training samples.
Also using MODIS time series, SENTHILNATH et al. (2012) combined classification and segmentation of images to map Krishna River in southern India and evaluate areas flooded by the river. SVM and Artificial Neural Networks classifiers were applied for the separation of classes in water and non-water. Statistically comparing both classifiers, SVM showed better performance in images taken before and after flood as well as during flood.
Given those examples on the potential of fraction images and SVM classifier on MODIS images, the objective of this study was to evaluate the effectiveness of coffee crop mapping on fraction images derived from MODIS sensor in Monte Santo de Minas, Minas Gerais State, in the dry and rainy seasons.
MATERIALS AND METHODS
Monte Santo de Minas municipality, located in the southern region of Minas Gerais (Figure 1) and with a total area of 592.5 km², presents fairly steep slope terrain with hills and elevated plateaus, what is a characteristic of Serra da Mantiqueira region. The climate regime is high-altitude subtropical (Köppen classification: Cwa), with an average annual temperature of 20.6 °C and average annual rainfall of 1,690 mm concentrated between December and February. The main soil types present in the municipality are Oxisol, Entisol, Alfisol, and Ultisol.
FIGURE1. Location of the study area: Monte Santo de Minas municipality, in Minas Gerais State, Brazil.
MonteSanto State Boundary Municipal Boundary
Key
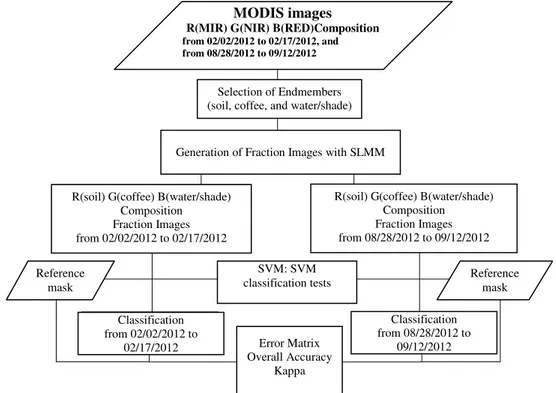
Figure 2 shows the flowchart of the steps taken for mapping coffee areas.
FIGURE 2. Flowchart of the methodology used for coffee crop mapping.
The MODIS images onboard Terra platform, MOD13Q1 product, red band (RED), near infrared (NIR) and mid infrared (MIR) from h13v11 tile, were used for this study. All of them had spatial resolution of about 250 meters (239.9 m x 249 m), and temporal, of 16 days using the Sinusoidal projection.
These images were converted from hdf format to tif format and redesigned to WGS 84 Geographic Projection System and Datum with MODIS Reprojection Tools (MRT) app, which is
available free of charge from NASA on the website
<https://lpdaac.usgs.gov/tools/MODIS_reprojection_tool>. It is worth noting that the images of MODIS product do not require any type of correction since they previously undergone atmospheric, geometric and radiometric corrections (SOARES et al. 2007).
As a terrestrial reference, masks of coffee and forest provided by Cooxupé were used, which were visually mapped from Spot 5 satellite imagery, with a spatial resolution of 5 meters. The coffee mask quality was performed after visual inspection of 5,000 points in the field, resulting in a Kappa Index of 0.979, considered excellent. Although this mapping dates from the second half of 2006, there was an update during fieldwork conducted in September 2012, due to the fact that changes in land use were identified in some areas. The mask Other Uses is the polygon of the resultant municipality after disregarding areas mapped with coffee and forest.
The starting point of coffee mapping was determined according to dates of MODIS images, which were chosen before the harvest (rainy) period and, also, after harvest (dry) period. The criteria that defined the image dates was that all pixels in the study area showed good radiometric quality. This information was obtained by the Pixel Reliability band, also available in MOD13Q1 product. The first MODIS composition corresponds to the rainy period from February 02 to February 17, 2012. For the dry season, the composition from August 28 to September 12, 2012 was used. For each composition, the R(MIR) G(NIR) B(RED) relation was used for SLMM application and generation of fraction images (soil, coffee, and water/shade). These images aim to highlight the targets via the contribution of these components in each pixel.
MODIS images
R(MIR) G(NIR) B(RED)Composition
from 02/02/2012 to 02/17/2012, and from 08/28/2012 to 09/12/2012
Selection of Endmembers (soil, coffee, and water/shade)
Generation of Fraction Images with SLMM
R(soil) G(coffee) B(water/shade) Composition Fraction Images from 02/02/2012 to 02/17/2012
R(soil) G(coffee) B(water/shade) Composition Fraction Images from 08/28/2012 to 09/12/2012
Reference mask Reference mask SVM: SVM classification tests Classification from 02/02/2012 to
02/17/2012
Classification from 08/28/2012 to
09/12/2012 Error Matrix
The SLMM can be described according to Equation (1) as follows:
ri = sum (aij xj) + ei (1)
where: ri is the mean spectral reflectance for the ith spectral band; aij is the spectral reflectance of
the jth component in the pixel for the ith spectral band; xj is the proportion value of the jth
component in the pixel; ei is the error for the ith spectral band; j = 1, 2, ..., n (n = number of
components assumed for the problem); and i = 1, 2, ...,m (m = number of spectral bands for the sensor system).
For the generation of fraction images, SLMM must select “pure pixels” of each target, which
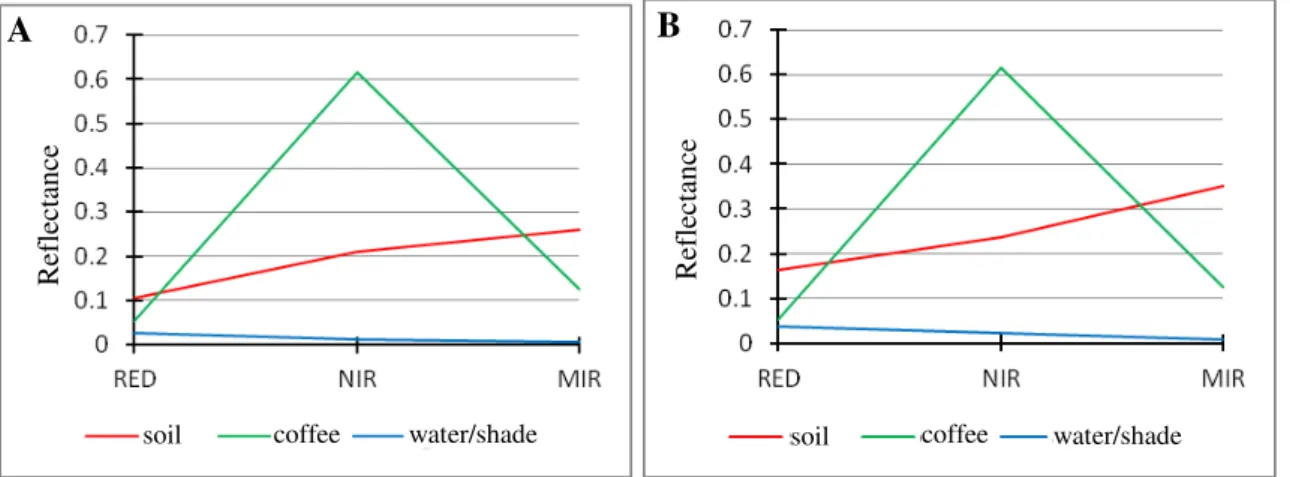
are also called endmembers, as they bring new information from the original spectral response. Thus, endmembers of soil and water/shade were chosen on the images themselves (during dry and rainy seasons). Soil pixels had higher spectral response in the MIR band while water/shade pixels presented the lowest values in all three bands. In order to choose the coffee endmember, it was necessary to use a composition obtained in another date (from January 01 to January 16, 2008) because the 2012 images do not show pure pixels with 100% coffee cover. Figure 3 shows spectral curves of the endmembers selected and used in SLMM.
FIGURE 3. Spectral curves of endmembers of soil, coffee, and water/shade. A. Rainy season; B. Dry season.
After generating fraction images for each period, the RGB color composition was performed for the images in accordance with R(soil fraction) G(coffee fraction) B(shade fraction). In these compositions, classification tests were carried out using the supervised automatic SVM classifier with different parameters. The Radial Basis Function (RBF) was chosen, testing different values of the penalty parameter to define the probability requested to the classifier for the classification of a given pixel. According to the tests, for both dry and rainy season images, in comparison with Cooxupé mask, the best probability level was 0.30 on a scale of 0 to 1; the closer to 1, the higher the number of non-classified pixels.
In the next step, classification accuracy was evaluated by Error Matrix, Overall Accuracy, and Kappa Index. Therefore, two error matrices were generated (rainy and dry) from crossing the obtained classifications (Coffee, Forest, and Other Uses) and terrestrial reference. It is important to highlight that crossing was not based on sample points, but throughout each referenced classification.
RESULTS AND DISCUSSION
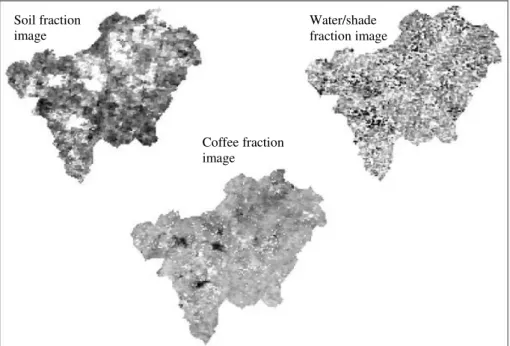
From SLMM application on R(MIR) G(NIR) B(RED) compositions for each season (rainy and dry), the fraction images of each period were obtained (Figures 4 and 5).
A B
R
ef
lecta
nce
R
ef
lecta
nce
FIGURE 4. Fraction images of soil, coffee, and water/shade during the rainy season (02/02 to 02/17/2012).
FIGURE 5. Fraction images of soil, coffee, and water/shade during the dry season (08/28 to 09/12/2012).
The soil fraction image highlights areas of bare soil; coffee fraction image highlights areas of coffee; and water/shade fraction image highlights areas with the presence of water and/or shade. In these synthetic images, pixel value ranges from 0 to 1; the closer to 1 (lighter), the higher the estimated value of the target proportion in its respective fraction image.
Figure 6 shows R(soil) G(coffee) B(water/shade) compositions of fraction images on which classification tests were applied with SVM.
Soil fraction image
Coffee fraction image
Water/shade fraction image
Soil fraction image
Coffee fraction image
FIGURE 6. RGB composition of fraction images.
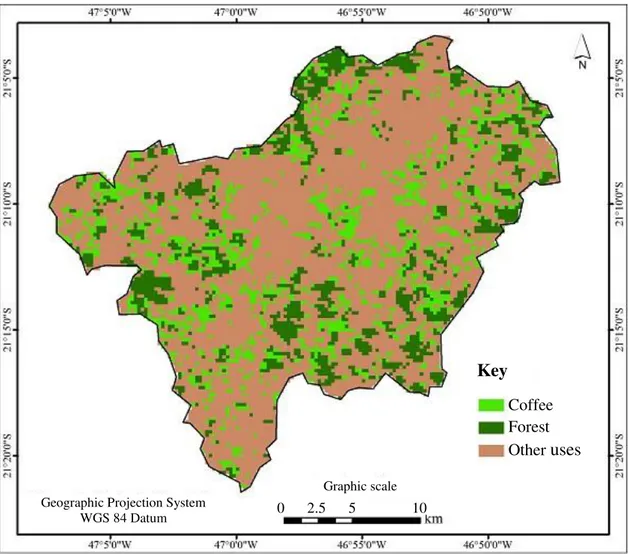
Results of the classification of fraction image compositions for each period are shown in Figures 7 and 8.
FIGURE 7. Image classification for the rainy season.
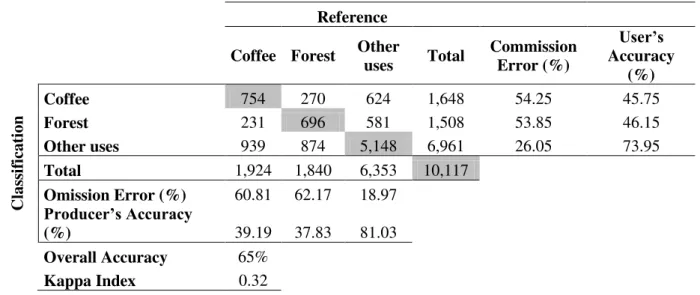
Accuracy evaluation of this classification is presented in the error matrix of Table 1. The highlighted diagonal shows the total of correctly classified pixels, which obtained 65% Overall Accuracy. Kappa Index was 0.32, reported as reasonable according to the range of values proposed by LANDIS & KOCH (1977). For the Coffee class, which is the interest target, the omission error
was of 60.81% and, producer’s accuracy, of 39.19%, i.e., 39.19% of the coffee pixels were correctly
classified, while 60.81% were assigned to Forest and Other Uses. The commission error was of 02/02 to 02/17/2012 – rainy season 08/28 to 09/12/2012 – dry season
Key Coffee Forest
Other uses
Geographic Projection System WGS 84 Datum
Graphic scale
54.25% and, user’s accuracy, of 45.75% for Coffee, what means that 54.25% of the pixels classified
as coffee actually belong to Forest and Other Uses, and 45.75% of those classified as coffee were accurate.
TABLE 1. Classification error matrix for the rainy season.
Reference
Coffee Forest Other uses Total Commission Error (%) Accuracy User’s (%)
C
lass
if
ica
ti
on
Coffee 754 270 624 1,648 54.25 45.75
Forest 231 696 581 1,508 53.85 46.15
Other uses 939 874 5,148 6,961 26.05 73.95
Total 1,924 1,840 6,353 10,117
Omission Error (%) 60.81 62.17 18.97 Producer’s Accuracy
(%) 39.19 37.83 81.03
Overall Accuracy 65%
Kappa Index 0.32
For the dry season classification (Table 2), the Overall Accuracy was of 67%, and
commission error and user’s accuracy for Coffee were of 52.06% and 47.94%, respectively. The omission error for Coffee was lower, 38.99%, then resulting in an increased producer’s accuracy of
61.01%. Kappa Index was 0.41, indicating good quality classification.
TABLE 2. Classification error matrix for the dry season.
Reference
Coffee Forest Other uses Total Commission Error (%)
User’s Accuracy
(%)
Classi
fic
at
ion
Coffee 1,324 477 961 2,762 52.06 47.94
Forest 237 670 384 1,291 48.10 51.90
Other uses 609 646 4,804 6,059 20.71 79.29
Total 2,170 1,793 6,149 10,112
Omission Error (%) 38.99 62.63 21.87
Producer’s Accuracy
(%) 61.01 37.37 78.13
Overall Accuracy 67%
FIGURE 8. Image classification for the dry season.
Considering the results of the error matrix, the best classification was performed for the dry season. This is consistent with results described by MOREIRA et al. (2004) that, despite the crop perennial characteristic, the best time for coffee crop mapping in multispectral images from satellite sensors is during the driest months.
CONCLUSIONS
It can be said that MODIS data are not the most suitable ones for coffee crop mapping, having as a downside, the non-appropriate spatial resolution, since coffee areas are usually small and, frequently, smaller than one pixel of MODIS. However, it is concluded that the use of fraction images for classification was more effective for the dry season, what was evidenced by the best accuracy results.
In short, this shows that the supervised automatic classification of coffee fraction images obtained from MODIS data presents that complexity belonging to the coffee cultivation itself; plant heterogeneity, different plant sizes, diverse management systems, and varied spacing end up hindering their automatic classification.
ACKNOWLEDGEMENTS
To Capes, for the Masters scholarship awarded to the first author; and to Cooxupé, for providing information and masks of coffee and forest.
Key
Coffee Forest
Other uses
Geographic Projection System WGS 84 Datum
Graphic scale
REFERENCES
AGUIAR, D. A. Monitoramento da área colhida de cana-de-açúcar por meio de imagens do sensor
MODIS. 99 f. Dissertação (Mestrado em Sensoriamento Remoto) – Istituto Nacional de Pesquisas
Espaciais, São José Dos Campos, 2007. Disponível em: <http://urlib.net/sid.inpe.br/mtc-m17@80/2007/05.11.18.56> Acesso em: 23 ago. 2010.
ALVES, G. M. Análise do modelo linear de mistura espectral aplicado a imagens MODIS para o mapeamento da cultura de arroz irrigado no estado do Rio Grande do Sul. 69 f. Dissertação
(Mestrado em Sensoriamento Remoto) - Universidade Federal do Rio Grande do Sul, Porto Alegre, 2009. Disponível em: < http://hdl.handle.net/10183/23937>. Acesso em: 25 maio 2011.
CONAB-Companhia Nacional de Abastecimento. Acompanhamento de safra brasileira: café, safra
2012. Quarta estimativa, dezembro/2012. Brasília/DF: Conab, 2012.
LANDIS, J. R.; KOCH, G. G. The measurement of observer agreement for categorical data.
Biometrics, Washington, v. 33, n. 1, p. 159-174, 1977.
MELGANI, F.; BRUZZONE, L. Classification of Hyperspectral Remote Sensing Images With Support Vector Machines. IEEE Transactions on Geoscience and Remote Sensing, New York, v.
42, n. 8, p. 1778 – 1790, 2004.
MOREIRA, M. A.; ADAMI, M.; RUDORFF, B. F. T. Análise espectral e temporal da cultura do café em imagens Landsat. Pesquisa Agropecuária Brasileira, Brasília/DF, v. 39, n. 3, p. 223-231,
mar. 2004.
MOREIRA, M. A.; RUDORFF, B. F. T; BARROS. A. M.; FARIA. V.G.C.; ADAMI, M.Geotecnologias para mapear lavouras de café nos estados de Minas Gerais e São Paulo.
Engenharia Agrícola, Jaboticabal, v.30, n.6, p. 1123-1135, 2010.
LAMPARELLI,R. A. C.; JOHANN, J. A.; SANTOS, E. R.; ESQUERDO,J. C. D. M.; ROCHA, J. V. Use of data mining and spectral profiles to differentiate condition after harvest of coffee plants.
Engenharia Agrícola, Jaboticabal, v.32, n.1, p. 184-196, 2012.
SANTOS, J. A. dos; GOSSELIN, P-H; PHILLIP-FOLIGUET, S; TORRES, R. da S.; FALCÃO, A. X. Multiscale Classification of Remote Sensing Images. IEEE Transactions on Geoscience and Remote Sensing, New York, v. 50, p. 3764 – 3775, 2012.
SENTHILNATH, J.; BAJPAI, S.; OMKAR, S. N.; DIWAKAR, P. G.; MANI, V. An approach to multi-temporal MODIS image analysis using image classification and segmentation. Advances in Space Research, Oxford, v. 50, p. 1274 – 1287, 2012.
SHAO, Y.; LUNETTA, R. S. Comparison of support vector machine, neural network, and CART algorithms for the land-cover classification using limited training data points. ISPRS Journal of Photogrammetry and Remote Sensing, Amsterdam, v. 70, p. 78 – 87, 2012.
SHIMABUKURO, Y. E.; SMITH. J. A. The least-squares mixing models to generate fraction images derived from remote sensíng multispectral data. IEEE Transactions on Geoscience and Remote Sensing, New York, v. 29, n. l, p. 16 - 20, 1991.
SOARES, J. V.; BATISTA, G. T.; SHIMABUKURO, Y. E. Histórico e Descrição. In: RUDORFF,
B. F. T.; SHIMABUKURO, Y. E.; CEBALLOS, J. C. (Orgs.). O sensor MODIS e suas aplicações