short communication
Length-weight and length-length relationships for rockpool fishes on the Brazilian coast
Fabiola Seabra Machado1*, Rory Romero de Sena Oliveira1, Arianderson Texeira Silva1 & Tommaso Giarrizzo1
1Universidade Federal do Pará, Grupo de Ecologia Aquática, Avenue Perimetral, 2651, Terra Firme, Belém, PA,
Brazil.
*Corresponding author: Fabiola Seabra Machado, e-mail: fabiola_seabra@hotmail.com
MACHADO, F. S., OLIVEIRA, R. R. S., SILVA, A. T., GIARRIZZO, T. Length-weight and length-length relationships for
rockpool fishes on the Brazilian coast. Biota Neotropica. 17(3): e20160251. http://dx.doi.org/10.1590/1676-0611-BN-2016-0251
Abstract: Fifty-nine length-weight (LWR) and length-length (LLR) relationships were estimated for 18 fish species,
belonging to 10 families. The fish specimens were captured in rockpools of 21 sites along a stretch of 4,900 km of the Brazilian coast, between latitudes 00° and 22°S, in 2012. This study represents the first reference available for five fish species (Gobiesox barbatulus, Bathygobius geminatus, Labrisomus nuchipinnis, Malacoctenus delalandii, Lutjanus alexandrei) in LLR and six (Gobiesox barbatulus, Bathygobius geminatus, Hypleurochilus fissicornis, Omobranchus punctatus, Entomacrodus vomerinus, Diplodus argenteus) in LWR.
Keywords: intertidal fish, tidepool, allometry.
Relações comprimento-peso e comprimento-comprimento para os peixes de poças de maré
na costa brasileira
Resumo: Cinquenta e nove relações peso-comprimento (RRC) e comprimento-comprimento (RCC) foram estimadas
para 18 espécies de peixes, distribuídos em 10 famílias. Os espécimes de peixes foram capturados em poças de maré de 21 locais amostrados, ao longo de um trecho de 4.900 km da costa brasileira, entre as latitudes 00° e 22°S, durante o ano de 2012. Este estudo apresenta a primeira referência disponível para 5 espécies de peixes (Gobiesox barbatulus, Bathygobius geminatus, Labrisomus nuchipinnis, Malacoctenus delalandii, Lutjanus alexandrei) em RCC e 6 (Gobiesox barbatulus, Bathygobius geminatus, Hypleurochilus fissicornis, Omobranchus punctatus, Entomacrodus vomerinus,
Diplodus argenteus) em RPC.
Palavras-Chave: peixes de entremarés, poças de maré, alometria.
Introduction
In most fishery studies length–weight relationship (LWR) equations have been extensively used to estimate the fish weight from length given the technical difficulties (e.g., bobbing motion of the boat) and the amount of time required to record weight in the field (Morato et al. 2001, Morey et al. 2003). However, the LWR of the same species could vary in space (e.g., habitats and regional variation), so the use of a
single equation throughout a large geographical area could introduce a bias in the estimates of weight (Morato et al. 2001, Mendes et al. 2004, Joyeux et al. 2008). Therefore, obtaining accurate local LWR parameter estimates is an important factor in the assessment of fish stocks and to subsidize the ecosystem modelling (Vaz-dos-Santos & Gris 2016). Additionally, length–length relationship (LLR) is very important for fisheries management and for comparative studies of population growth (e.g.,Moutopoulos & Stergiou 2002). In this study we report 59 LWR and
LLR for 18 fish species caught in rockpools of 21 sites along a stretch of 4,900 km of the Brazilian coast, between latitudes 00° and 22°S.
Material and Methods
A Brazilian coastal sector between the Amazon estuary (0° of latitude) and Rio de Janeiro (22° S) was sampled between March and December 2012, in 21 rockpool sites spaced in average ~210 km apart (Figure 1).
The rockpool fish fauna was caught at low tide using anesthetic clove oil (40 ml from anesthetic dissolved in 1000 ml of ethanol) and small hand-nets (length 150 mm; mouth 101.6 mm and mesh 3 mm). The specimens were fixed in 10% formalin, preserved in 70% alcohol and identified at the lowest taxonomic level possible (Figueiredo & Menezes 1978, 1980a, 1980b, Menezes & Figueiredo 1985, Carvalho-Filho 1999, Carpenter 2002a, 2002b, Eschmeyer et al. 2016). Specimens were measured (nearest 0.01 cm standard length, SL and total length, TL) using digital slide calipers and weighed (nearest 0.01 g total weight, TW) using a digital balance.
of the linear regression that sets the allometric growth (Froese 2006). Furthermore, length-length relationships (LLR) were estimated by the method of least squares to fit a simple linear regression model using the equation TL = a + bSL (Hossain et al. 2006). The association degree between variables (TW and TL for LWR and SL and TL for LLR), was measured by the coefficient of determination (r2). In order to verify if b was significantly different from the isometric value (i.e., b = 3 for LWR), the one-tailed Student’s t-test (H0: b = 3) with a confidence level of ± 95%
(α = 0.05) was employed (Sokal & Rohlf 1987, Froese et al. 2011).
Results and Discussion
Overall, 4,299 specimens representing 18 different fish species belonging to 10 families were analyzed. The family Blenniidae were the most richness with four species, followed by Gobiidae and Pomacentridae (tree species each one), and Labrisomidae (two species). The five remaining families (Gobiesocidae, Carangidae, Gerreidae, Haemulidae, Sparidae and Lutjanidae) were represented by only one species. Sample size ranged from 9 specimens for Labrisomus nuchipinnis (Quoy & Gaimard, 1824) in Pirangi
do Sul-RN (site 12), to 735 for Scartella cristata (Linnaeus, 1758) in Canoa
Quebrada-CE (site 10). The inclusion of species with small sample size (< 20 individuals) is justified by using individuals with a spread in length broad enough to obtain the relationships (Froese 2006, Froese et al. 2011).
A total of 59 LLR and LWR were computed for all 18 fish species caught in one or more sampling sites (Table 1 and 2). All regressions were highly significant (p < 0.001), with the coefficient of determination r2 ranging from 0.911 to 0.999.
The present study provides the first information on LLR and on LWR for five [Gobiesox barbatulus (Starks, 1913), Bathygobius geminatus (Tornabene, Baldwin & Pezold, 2010), Labrisomus nuchipinnis (Quoy & Gaimard, 1824), Malacoctenus delalandii (Valenciennes, 1836), Lutjanus alexandrei
(Moura & Lindeman, 2007)] and five [Gobiesox barbatulus, Bathygobius geminatus, Hypleurochilus fissicornis (Quoy & Gaimard, 1824), Entomacrodus vomerinus (Valenciennes, 1836), Diplodus argenteus (Valenciennes, 1830)]
native species (Table 1 and Table 2), respectively. It also presents the LWR
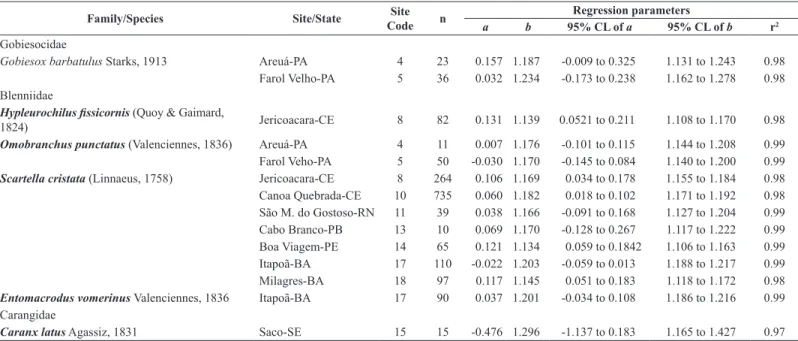
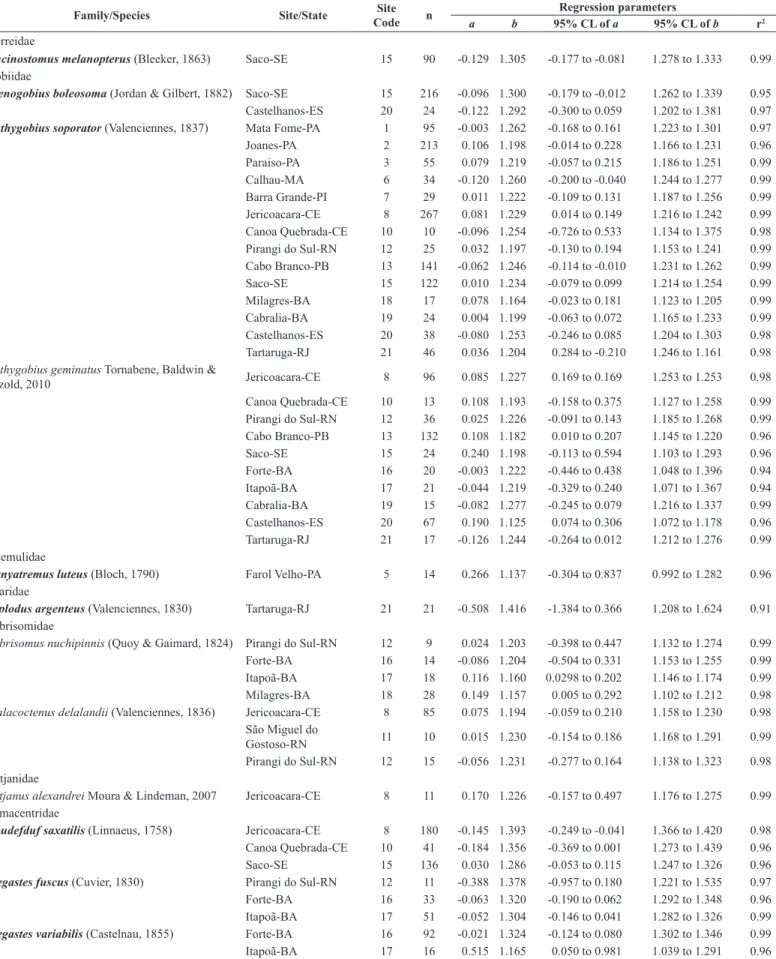
Table 1. Estimated parameters of length–length simple linear regression (LLR) to convert standard length (SL) to total length (TL) for 18 rockpool fish species in 21
sites along Brazilian coast.
Family/Species Site/State Site
Code n
Regression parameters
a b 95% CL of a 95% CL of b r2
Gobiesocidae
Gobiesox barbatulus Starks, 1913 Areuá-PA 4 23 0.157 1.187 -0.009 to 0.325 1.131 to 1.243 0.98
Farol Velho-PA 5 36 0.032 1.234 -0.173 to 0.238 1.162 to 1.278 0.98 Blenniidae
Hypleurochilus fissicornis (Quoy & Gaimard,
1824) Jericoacara-CE 8 82 0.131 1.139 0.0521 to 0.211 1.108 to 1.170 0.98
Omobranchus punctatus (Valenciennes, 1836) Areuá-PA 4 11 0.007 1.176 -0.101 to 0.115 1.144 to 1.208 0.99
Farol Veho-PA 5 50 -0.030 1.170 -0.145 to 0.084 1.140 to 1.200 0.99
Scartella cristata (Linnaeus, 1758) Jericoacara-CE 8 264 0.106 1.169 0.034 to 0.178 1.155 to 1.184 0.98
Canoa Quebrada-CE 10 735 0.060 1.182 0.018 to 0.102 1.171 to 1.192 0.98 São M. do Gostoso-RN 11 39 0.038 1.166 -0.091 to 0.168 1.127 to 1.204 0.99 Cabo Branco-PB 13 10 0.069 1.170 -0.128 to 0.267 1.117 to 1.222 0.99 Boa Viagem-PE 14 65 0.121 1.134 0.059 to 0.1842 1.106 to 1.163 0.99 Itapoã-BA 17 110 -0.022 1.203 -0.059 to 0.013 1.188 to 1.217 0.99
Milagres-BA 18 97 0.117 1.145 0.051 to 0.183 1.118 to 1.172 0.98
Entomacrodus vomerinus Valenciennes, 1836 Itapoã-BA 17 90 0.037 1.201 -0.034 to 0.108 1.186 to 1.216 0.99
Carangidae
Caranx latus Agassiz, 1831 Saco-SE 15 15 -0.476 1.296 -1.137 to 0.183 1.165 to 1.427 0.97
n, number of specimens; CL, confidence limits; Species in bold have length-length relationships estimates included in fishBase database (Froese & Pauly 2016) and
literature.
Family/Species Site/State Site
Code n
Regression parameters
a b 95% CL of a 95% CL of b r2
Gerreidae
Eucinostomus melanopterus (Bleeker, 1863) Saco-SE 15 90 -0.129 1.305 -0.177 to -0.081 1.278 to 1.333 0.99
Gobiidae
Ctenogobius boleosoma (Jordan & Gilbert, 1882) Saco-SE 15 216 -0.096 1.300 -0.179 to -0.012 1.262 to 1.339 0.95
Castelhanos-ES 20 24 -0.122 1.292 -0.300 to 0.059 1.202 to 1.381 0.97
Bathygobius soporator (Valenciennes, 1837) Mata Fome-PA 1 95 -0.003 1.262 -0.168 to 0.161 1.223 to 1.301 0.97
Joanes-PA 2 213 0.106 1.198 -0.014 to 0.228 1.166 to 1.231 0.96
Paraiso-PA 3 55 0.079 1.219 -0.057 to 0.215 1.186 to 1.251 0.99
Calhau-MA 6 34 -0.120 1.260 -0.200 to -0.040 1.244 to 1.277 0.99 Barra Grande-PI 7 29 0.011 1.222 -0.109 to 0.131 1.187 to 1.256 0.99 Jericoacara-CE 8 267 0.081 1.229 0.014 to 0.149 1.216 to 1.242 0.99
Canoa Quebrada-CE 10 10 -0.096 1.254 -0.726 to 0.533 1.134 to 1.375 0.98
Pirangi do Sul-RN 12 25 0.032 1.197 -0.130 to 0.194 1.153 to 1.241 0.99 Cabo Branco-PB 13 141 -0.062 1.246 -0.114 to -0.010 1.231 to 1.262 0.99
Saco-SE 15 122 0.010 1.234 -0.079 to 0.099 1.214 to 1.254 0.99
Milagres-BA 18 17 0.078 1.164 -0.023 to 0.181 1.123 to 1.205 0.99 Cabralia-BA 19 24 0.004 1.199 -0.063 to 0.072 1.165 to 1.233 0.99 Castelhanos-ES 20 38 -0.080 1.253 -0.246 to 0.085 1.204 to 1.303 0.98
Tartaruga-RJ 21 46 0.036 1.204 0.284 to -0.210 1.246 to 1.161 0.98
Bathygobius geminatus Tornabene, Baldwin &
Pezold, 2010 Jericoacara-CE 8 96 0.085 1.227 0.169 to 0.169 1.253 to 1.253 0.98
Canoa Quebrada-CE 10 13 0.108 1.193 -0.158 to 0.375 1.127 to 1.258 0.99
Pirangi do Sul-RN 12 36 0.025 1.226 -0.091 to 0.143 1.185 to 1.268 0.99 Cabo Branco-PB 13 132 0.108 1.182 0.010 to 0.207 1.145 to 1.220 0.96
Saco-SE 15 24 0.240 1.198 -0.113 to 0.594 1.103 to 1.293 0.96
Forte-BA 16 20 -0.003 1.222 -0.446 to 0.438 1.048 to 1.396 0.94
Itapoã-BA 17 21 -0.044 1.219 -0.329 to 0.240 1.071 to 1.367 0.94
Cabralia-BA 19 15 -0.082 1.277 -0.245 to 0.079 1.216 to 1.337 0.99 Castelhanos-ES 20 67 0.190 1.125 0.074 to 0.306 1.072 to 1.178 0.96
Tartaruga-RJ 21 17 -0.126 1.244 -0.264 to 0.012 1.212 to 1.276 0.99
Haemulidae
Genyatremus luteus (Bloch, 1790) Farol Velho-PA 5 14 0.266 1.137 -0.304 to 0.837 0.992 to 1.282 0.96
Sparidae
Diplodus argenteus (Valenciennes, 1830) Tartaruga-RJ 21 21 -0.508 1.416 -1.384 to 0.366 1.208 to 1.624 0.91
Labrisomidae
Labrisomus nuchipinnis (Quoy & Gaimard, 1824) Pirangi do Sul-RN 12 9 0.024 1.203 -0.398 to 0.447 1.132 to 1.274 0.99
Forte-BA 16 14 -0.086 1.204 -0.504 to 0.331 1.153 to 1.255 0.99
Itapoã-BA 17 18 0.116 1.160 0.0298 to 0.202 1.146 to 1.174 0.99
Milagres-BA 18 28 0.149 1.157 0.005 to 0.292 1.102 to 1.212 0.98
Malacoctenus delalandii (Valenciennes, 1836) Jericoacara-CE 8 85 0.075 1.194 -0.059 to 0.210 1.158 to 1.230 0.98
São Miguel do
Gostoso-RN 11 10 0.015 1.230 -0.154 to 0.186 1.168 to 1.291 0.99
Pirangi do Sul-RN 12 15 -0.056 1.231 -0.277 to 0.164 1.138 to 1.323 0.98
Lutjanidae
Lutjanus alexandrei Moura & Lindeman, 2007 Jericoacara-CE 8 11 0.170 1.226 -0.157 to 0.497 1.176 to 1.275 0.99
Pomacentridae
Abudefduf saxatilis (Linnaeus, 1758) Jericoacara-CE 8 180 -0.145 1.393 -0.249 to -0.041 1.366 to 1.420 0.98
Canoa Quebrada-CE 10 41 -0.184 1.356 -0.369 to 0.001 1.273 to 1.439 0.96
Saco-SE 15 136 0.030 1.286 -0.053 to 0.115 1.247 to 1.326 0.96
Stegastes fuscus (Cuvier, 1830) Pirangi do Sul-RN 12 11 -0.388 1.378 -0.957 to 0.180 1.221 to 1.535 0.97
Forte-BA 16 33 -0.063 1.320 -0.190 to 0.062 1.292 to 1.348 0.96
Itapoã-BA 17 51 -0.052 1.304 -0.146 to 0.041 1.282 to 1.326 0.99
Stegastes variabilis (Castelnau, 1855) Forte-BA 16 92 -0.021 1.324 -0.124 to 0.080 1.302 to 1.346 0.99
Itapoã-BA 17 16 0.515 1.165 0.050 to 0.981 1.039 to 1.291 0.96
n, number of specimens; CL, confidence limits; Species in bold have length-length relationships estimates included in fishBase database (Froese & Pauly 2016) and
literature.
Table 2. Estimated parameters of length-weight relationships (LWR) for 18 fish species in 21 rockpool sites along Brazilian coast.
Family/Species Site
code n
TL (cm) TW (g) Regression parameters
T-test
Min Max Min Max a b 95% CL of a 95% CL of b r2
Gobiesocidae
Gobiesox barbatulus Starks, 1913 4 23 1.9 6.0 0.08 3.64 0.013 2.912 0.010 to 0.017 2.681 to 3.143 0.97 0.22
5 36 1.6 5.9 0.06 2.80 0.012 2.994 0.011 to 0.012 2.870 to 3.118 0.99 0.46 Blenniidae
Hypleurochilus fissicornis (Quoy & Gaimard, 1824) 8 82 1.7 5.6 0.04 2.05 0.010 3.116 0.008 to 0.011 2.969 to 3.261 0.96 0.06
Omobranchus punctatus (Valenciennes, 1836) 4 11 1.8 5.5 0.03 0.9 0.005 3.086 0.003 to 0.007 2.753 to 3.418 0.98 0.28
5 50 1.8 6.8 0.02 1.61 0.005 3.064 0.004 to 0.006 2.949 to 3.178 0.98 0.13
Scartella cristata (Linnaeus, 1758) 8 264 2.3 10 0.15 13.19 0.012 3.002 0.011 to 0.013 2.935 to 3.069 0.97 0.47
10 735 1.5 8.6 0.03 8.0 0.010 3.135 0.009 to 0.010 3.101 to 3.169 0.97 0.00 11 39 1.2 6.5 0.02 3.42 0.009 3.099 0.007 to 0.011 2.960 to 3.238 0.98 0.07 13 10 2.4 6.3 0.12 2.33 0.009 2.988 0.007 to 0.013 2.775 to 3.202 0.99 0.45
14 65 1.0 8.3 0.01 5.85 0.009 3.037 0.008 to 0.010 2.890 to 3.185 0.96 0.30 17 110 1.1 7.8 0.01 5.61 0.009 3.082 0.008 to 0.010 2.952 to 3.206 0.96 0.09 18 97 1.1 6.4 0.02 2.53 0.009 3.019 0.008 to 0.010 2.911 to 3.127 0.97 0.35
Entomacrodus vomerinus Valenciennes, 1836 17 90 2.0 10 0.06 8.33 0.007 3.090 0.006 to 0.008 3.015 to 3.164 0.99 0.01
Carangidae
Caranx latus Agassiz, 1831 15 15 4.8 8.9 1.53 9.52 0.014 2.962 0.009 to 0.021 2.745 to 3.179 0.99 0.35
Gerreidae
Eucinostomus melanopterus (Bleeker, 1863) 15 90 1.1 4.4 0.01 0.79 0.009 2.812 0.009 to 0.010 2.693 to 2.931 0.96 0.01
Gobiidae
Ctenogobius boleosoma (Jordan & Gilbert,
1882) 15 216 1.1 4.2 0.01 0.39 0.006 2.878 0.005 to 0.006 2.803 to 2.952 0.96 0.01
20 24 1.1 4.0 0.01 0.35 0.006 2.901 0.006 to 0.008 2.724 to 3.077 0.98 0.13
Bathygobius soporator (Valenciennes, 1837) 1 95 1.4 9.3 0.02 9.46 0.010 3.046 0.008 to 0.012 2.956 to 3.135 0.98 0.15
2 213 2.6 7.8 0.22 6.62 0.009 3.151 0.008 to 0.011 3.072 to 3.230 0.97 <0.001 3 55 2 10.4 0.11 13.93 0.013 2.968 0.011 to 0.015 2.887 to 3.049 0.99 0.22 6 34 0.8 9.9 0.01 13.79 0.009 3.129 0.007 to 0.012 2.960 to 3.298 0.98 0.06 7 29 1.5 7.0 0.03 3.92 0.008 3.165 0.007 to 0.009 3.079 to 3.251 0.99 <0.001 8 267 1.5 10.5 0.05 15.8 0.009 3.169 0.008 to 0.010 3.114 to 3.225 0.98 <0.001 10 10 1.4 9.3 0.03 10.15 0.010 3.051 0.008 to 0.013 2.922 to 3.180 0.99 0.19 12 25 0.8 8.5 0.01 7.06 0.008 3.137 0.006 to 0.010 2.930 to 3.345 0.98 0.09 13 141 1.0 7.8 0.01 5.97 0.008 3.198 0.007 to 0.008 3.149 to 3.247 0.99 <0.001 15 122 1.0 10.6 0.01 15.78 0.008 3.155 0.008 to 0.009 3.114 to 3.195 0.99 <0.001 18 17 1.2 6.5 0.01 2.75 0.007 3.169 0.006 to 0.009 2.974 to 3.365 0.99 0.04 19 24 1.0 4.5 0.01 0.7 0.007 3.042 0.006 to 0.009 2.820 to 3.263 0.97 0.34 20 38 2.2 7.8 0.12 4.76 0.011 2.913 0.010 to 0.013 2.795 to 3.032 0.99 0.07 21 46 1.0 10.9 0.01 12.08 0.011 2.973 0.009 to 0.012 2.900 to 3.046 0.99 0.23
Bathygobius geminatus Tornabene, Baldwin &
Pezold, 2010 8 96 1.6 6.9 0.04 4 0.008 3.135 0.007 to 0.010 3.034 to 3.237 0.98 <0.001
10 13 1 7.8 0.01 4.25 0.010 3.008 0.008 to 0.013 2.844 to 3.173 0.99 0.45 12 36 1.5 6.1 0.03 1.64 0.008 3.002 0.007 to 0.011 2.829 to 3.175 0.97 0.49 13 132 1.6 4.7 0.04 1.06 0.009 3.055 0.008 to 0.010 2.969 to 3.141 0.97 0.10 15 24 1.8 8.6 0.06 7.69 0.008 3.142 0.007 to 0.009 3.040 to 3.244 0.99 0.49 16 20 1.8 3.4 0.05 0.46 0.010 3.066 0.008 to 0.012 2.854 to 3.278 0.98 0.26 17 21 1.2 3.8 0.01 0.47 0.007 3.096 0.006 to 0.009 2.846 to 3.346 0.97 0.21 19 15 1.7 4.5 0.04 0.83 0.007 3.084 0.005 to 0.010 2.819 to 3.350 0.98 0.25 20 67 1.1 4.2 0.01 0.66 0.009 3.008 0.008 to 0.010 2.878 to 3.138 0.97 0.45 21 17 2.7 7.5 0.22 4.63 0.010 2.997 0.009 to 0.011 2.925 to 3.070 0.99 0.47
Haemulidae
Genyatremus luteus (Bloch, 1790) 5 14 3.8 6.2 0.85 3.97 0.019 2.910 0.012 to 0.031 2.609 to 3.210 0.97 0.26
Sparidae
Diplodus argenteus (Valenciennes, 1830) 21 21 3.6 6.4 0.51 2.99 0.010 3.045 0.008 to 0.014 2.871 to 3.218 0.99 0.30
Labrisomidae
Labrisomus nuchipinnis (Quoy & Gaimard, 1824) 12 9 2.3 11.0 0.10 17.09 0.006 3.258 0.004 to 0.008 3.109 to 3.407 0.99 0.01
16 14 6.2 11.9 2.95 20.66 0.007 3.184 0.005 to 0.012 2.990 to 3.379 0.99 0.01 17 18 2.2 13 0.08 29.4 0.006 3.261 0.005 to 0.008 3.135 to 3.387 0.99 <0.001
n. number of specimens; TL. total length; TW. weight; CL. Confidence limits; Species in bold have length-weight relationships estimates included in FishBase
information of Omobranchus punctatus (Valenciennes, 1836), an exotic fish species from Indo-Pacific region widely introduced in the Western Atlantic Coast (Lasso-Alcalá et al. 2011).
Conversions among length measurements are given in Table 1. The parameter
b of the LLR ranged from 1.125 for Bathygobius geminatus from Castelhanos beach (site 20, Espírito Santo state), to 1.416 for Diplodus argenteus from Tartaruga beach (site 21, Rio de Janeiro state). The slope (b) of LWR ranged from 2.81 for Eucinostomus melanopterus (Bleeker, 1863) from Saco
beach (site 15, Sergipe state), to 3.26 for Labrisomus nuchipinnis from Itapuã beach (site 17, Bahia state), thus within the expected range of 2.50–3.50, as suggested by Froese (2006). The calculated mean value of all 59 estimations of b (± SE) was 3.06 (± 0.09), thus indicating a tendency
towards positive allometry, which is in agreement with the majority of fish species (Froese 2006). Concerning the type of growth, 39 estimations (66.1% of the overall 59 estimations species × sites) evidenced isometric growth (b = 3), 17 estimations (28.8%) showed positive allometry (b > 3), and three estimations (5.1%) negative allometry (Figure 2). The most represented families in terms of species richness did not show a consistent tendency in type of growth among species.
Almost 90% of all fish collected were juveniles of larger species or adults of small species. Samples of three species [i.e. Caranx latus (Agassiz, 1831),
Diplodus argentus and Abdefduf saxatilis (Linnaeus, 1758)] were represented
by small length ranges due to the nursery function of the sampled tidalpools. Therefore, LWRs biased by inclusion of small specimens, should be used with caution (Giarrizzo et al. 2006). As pointed out by Petrakis and Stergiou (1995), the application of these LWRs should be limited to the size ranges used to estimate the parameters. Geographical differences in type of growth were observed for nine fish species. Seven species presented isometry or positive allometry, depending on the geographic site sampled [Scartella cristata, Bathygobius geminatus, Labrisomus nuchipinnis, Malacoctenus delalandii (Valenciennes, 1836), Abudefduf saxatilis, Stegastes fuscus
(Cuvier, 1830) and Stegaste variabilis (Castelnau, 1855)]. One species
presented isometry or negative allometry [Ctenogobius boleosoma (Jordan & Gilbert, 1882)] and the Bathygobius soporator species showed isometry and negative and positive allometry. The observed differences among localities could be explained by a number of factors including temperature, salinity, food availability, gonadal development, number of specimens, and the variations in the range of length of the sample populations (Pauly 1984, Weatherley & Gill 1987, Giarrizzo et al. 2006, Joyeux et al. 2008, Macieira & Joyeux 2008).
In conclusion, this study has provided baseline information on the LWR and LLR of rockpool fish fauna sampled along a wide coastal sector of Brazil. The results obtained from this study will be useful to fishery biologists to employ adequate estimations for specific geographic areas.
Acknowledgements
The authors acknowledge Alfredo Carvalho Filho for assistance in identification of fish species and Instituto Brasileiro do Meio Ambiente e dos Recursos Naturais Renováveis (IBAMA) for licensing n° 24917 for Biological material collected. First and second author acknowledge financial support by the CAPES and CNPQ-PPGEAP, respectively. The last author, Tommaso Giarrizzo, receives a productivity grant from the Conselho Nacional de Desenvolvimento Científico e Tecnológico [National Council for Scientific and Technological Development (CNPq; process CNPq # 310299/2016-0)].
Author Contributions
Fabiola Seabra Machado: Substantial contribution in the concept and design of the study; contribution to data collection; contribution to data analysis and interpretation; contribution to manuscript preparation; contribution to critical revision, adding intelectual content.
Figure 2. Frequency distribution of b values of 59 LWR estimations computed for
18 fish species caught in tidepool along the Brazilian coast.
Table 2. Continued...
Family/Species Site
code n
TL (cm) TW (g) Regression parameters
T-test
Min Max Min Max a b 95% CL of a 95% CL of b r2
18 28 2 7.3 0.04 2.41 0.004 3.196 0.003 to 0.005 2.935 to 3.457 0.96 0.06
Malacoctenus delalandii (Valenciennes, 1836) 8 85 3 6.5 0.31 3.16 0.012 2.987 0.010 to 0.013 2.898 to 3.076 0.98 0.39
11 10 2 5.1 0.06 1.32 0.006 3.175 0.005 to 0.009 2.936 to 3.414 0.99 0.03 12 15 1.7 4.2 0.04 0.65 0.008 3.028 0.006 to 0.010 2.792 to 3.263 0.98 0.40
Lutjanidae
Lutjanus alexandrei Moura & Lindeman, 2007 8 11 4.4 11.3 1.25 19.76 0.015 2.955 0.007 to 0.030 2.625 to 3.285 0.98 0.38
Pomacentridae
Abudefduf saxatilis (Linnaeus, 1758) 8 180 1.6 11.3 0.07 32.64 0.020 2.973 0.018 to 0.022 2.904 to 3.041 0.98 0.22
10 41 1.7 5 0.08 1.96 0.015 3.016 0.014 to 0.018 2.892 to 3.139 0.98 0.39 15 136 1.3 4.9 0.05 2.15 0.013 3.135 0.012 to 0.015 3.018 to 3.252 0.95 0.01
Stegastes fuscus (Cuvier, 1830) 12 11 2.3 7.2 0.02 7.16 0.017 3.040 0.011 to 0.025 2.769 to 3.310 0.99 0.37
16 33 1.6 9.9 0.08 23.76 0.016 3.087 0.014 to 0.018 3.005 to 3.168 0.99 0.01 17 51 1.4 12.0 0.07 41.63 0.014 3.135 0.012 to 0.017 3.039 to 3.230 0.99 <0.01
Stegastes variabilis (Castelnau, 1855) 16 92 1.5 10.4 0.08 26.18 0.016 3.083 0.014 to 0.018 3.0213 to 3.145 0.99 <0.01
17 16 2.6 6.7 0.36 5.68 0.016 3.069 0.011 to 0.023 2.8287 to 3.310 0.99 0.27
n. number of specimens; TL. total length; TW. weight; CL. Confidence limits; Species in bold have length-weight relationships estimates included in FishBase
Rory Romero de Sena Oliveira: Contribution to data collection; contribution to data analysis and interpretation; contribution to manuscript preparation; contribution to critical revision, adding intelectual content.
Arianderson Texeira Silva: Contribution to data collection; contribution to data analysis and interpretation; contribution to manuscript preparation.
Tommaso Giarrizzo: Substantial contribution in the concept and design of the study; contribution to data collection; contribution to manuscript preparation; contribution to critical revision, adding intelectual content.
Conflicts of Interest
The authors declare that they have no conflict of interest related to the publication of this manuscript.
References
CARPENTER, K.E. 2002a. The living marine resources of the western central
Atlantic. FAO - Species Identification Guide for Fishery Purposes 2.
CARPENTER, K.E. 2002b. The living marine resources of the western central
Atlantic. FAO - Species Identification Guide for Fishery Purposes 3.
CARVALHO FILHO, A. 1999. Peixes: costa brasileira. São Paulo: Melro 1. ESCHMEYER, W.N., FRICKE, R. & VAN R. D. L. (EDS). 2016. Catalog of fishes:
genera, species, references. World Wide Web electronic publication, www. calacademy.org, version accessed (11/2016).
FIGUEIREDO, J.L. & MENEZES, N. 1978. Manual dos peixes marinhos do sudeste
do Brasil. Museu de Zoologia da USP, São Paulo, II Teleostei 1.
FIGUEIREDO, J.L. & MENEZES, N. 1980a Manual dos peixes marinhos do sudeste
do Brasil. Museu de Zoologia da USP, São Paulo, III Teleostei 2.
FIGUEIREDO, J.L. & MENEZES, N. 1980b. Manual dos peixes marinhos do
sudeste do Brasil. Museu de Zoologia da USP, São Paulo, IV Teleostei 3.
FROESE, R. 2006. Cube law, condition factor and weight-length relationships:
history, meta-analysis and recommendations. J. Appl. Ichthyol. 22:241-253.
FROESE, R, TSIKLIRAS, A.C. & STERGIOU, K.I. 2011. Editorial note on weight–
length relations of fishes. Acta Ichtyol. Pisc. 41(4):261-263.
FROESE, R. & PAULY, D. 2016. FishBase. World Wide Web electronic publication, www.fishbase.org, version (01/2016).
GIARRIZZO, T., JESUS, A.J.S., LAMEIRA, E.C., ALMEIDA, J.B.A., ISSAC, V.J. & SAINT-PAUL, U. 2006. Weight-length relationships for intertidal fish
fauna in a mangrove estuary in Northern Brazil. J. Appl. Ichthyol. 22:325-327.
HOSSAIN, M.Y., AHMED, Z.F., LEUNDA, P.M., JASMINE, S., OSCOZ, J., MIRANDA, R. & OHTOMI, J. 2006. Condition, length–weight and length–
(Siluriformes: Bagridae) in the Mathabhanga River, southwestern Bangladesh. J. Appl. Ichthyol. 22: 304-307.
JOYEUX, J.C., GIARRIZZO, T., MACIEIRA, R.M., SPACH, H.L. & VASKE T.,
Jr. 2008. Length–weight relationships for Brazilian estuarine fishes along a latitudinal gradient. J. Appl. Ichthyol. 25(3):350-355.
LASSO-ALCALÁ, O NUNES, J.L.S., LASSO, C., POSADA, J., ROBERTSON, R., PIORSKI, N.M., TASSELL, J.V., GIARRIZZO, T. & GONDOLO, G. 2011.
Invasion of the indo-pacific blenny Omobranchus punctatus (Perciformes:
Blenniidae) on the Atlantic coast of central and south America. Neotrop.
Ichthyol. 9(3):571-578.
MACIEIRA, R.M. & JOYEUX, J.C. 2008. Length–weight relationships for rockpool fishes in Brazil. J. Appl. Ichthyol. 25(3):358-359.
MENDES, B., FONSECA, P. & CAMPOS, A. 2004. Weight–length relationships for
46 fish species of the Portuguese west coast. J. Appl. Ichthyol. 20(5):355-361.
MENEZES, N.A. & FIGUEIREDO, J.L. 1985. Manual de peixes marinhos do
sudeste do Brasil. Museu de Zoologia da USP, São Paulo, Teleostei 4.
MOUTOPOULOS, D.K. & STERGIOU, K.I. 2002. Length-weight and length-length relationships of fish species from the Aegean Sea (Greece). J. Appl. Ichthyol. 18(3):200-203.
MORATO. T., AFONSO, P., LOURINHO, P., BARREIROS, J.P., SANTOSA, R.S. & NASHC, R.D.M. 2001. Length-weight relationships for 21 coastal fish species of the Azores, north-eastern Atlantic. Fish. Res. 50:297-302.
MOREY, G., MORANTA, J., MASSUTÍ, E., GRAU, A., LINDE, M., RIERA, F. & MORALES-NIN, N. 2003. Weight-length relationships of littoral to lower slope fishes from the western Mediterranean. Fish. Res. 62(1):89-96.
PAULY, D. 1984. Fish population dynamics in tropical waters: a manual for use
with programmable calculators. ICLARM Stud. Rev. 8.
SOKAL, R.R. & ROHLF, F.J. 1987. Introduction to Biostatistics. Freeman, New
York, USA.
WEATHERLEY, A.H. & GILL, H.S. 1987. The biology of fish growth. Academic Press, London.
VAZ-DOS-SANTOS, A.M. & GRIS, B. 2016. Length-weight relationships of the
ichthyofauna from a coastal subtropical system: a tool for biomass estimates
and ecosystem modelling. Biota Neotrop. 16(3): e20160192.