A comparative study about mobile learning with
gamification and augmented reality in high education
instituitions across South Europe, South America, and
Asia countries
Natércia Durão1, Fernando Moreira1,2, Maria João Ferreira1,3, Carla Santos Pereira1
1REMIT, IJP, Universidade Portucalense, Portugal 2IEETA, Universidade de Aveiro, Aveiro, Portugal 3ISTTOS, Algoritmi, Universidade do Minho, Portugal
{natercia; fmoreira; mjoao; carlasantos}@upt.pt
Nagaletchimee Annamalai
School of Distance Education University Sains Malaysia
Malaysia [email protected]
Abstract — In current context, the society is being transforming
itself in what genetically is named as digital society. The digital is taking over the organizations that perceive in technology an advancement/added value for their business. In the context of higher education as part of society, it is thus "forced" to change its operant mode in general and in particular in the teaching- learning process making it more digital, and at the same time more motivating for students. The aim of this study is to investigate the perception that higher education professors in the area of technology, across South Europe, South America, and Asia countries have about the use of mobile technologies such as gamification and augmented reality and how they can be used to promote student’s engagement inside and outside of the classroom.
Keywords - Mobile Learning; Gamification; Augmented Reality; Professors; Higher Education.
I. INTRODUCTION
According to [1], for the next generation, education will evolve towards integrating knowledge with practice, which occurs in contexts and communities that are important to students, and provides connections with their own experiences. This assertion is supported in [2], since learning is seen as included within a physical and psychosocial context and distributed between a person and the tools he or she is using and interacting. To complement in [3] it is shown that knowing, doing and the context must be seen as compliments of each other.
The proliferation and use of mobile devices in society in general and in particular the new generation of students, highly experienced in technology and interested in social media, mobile technologies and strategy games, contributes to changes in society where education is included [4]. In this context, according to [5] the correct use of most technologies stimulates learning environments and promotes student motivation, being these determining factors in learning.
Removing time and location limits is an important factor in providing lifelong learning. Thus, [6] considers mobile learning
technology as an alternative teaching resource because users have easy real-time access to information. Likewise, [7] considers that mobile learning (m_learning) is a type of e_learning without time and space restrictions and this technology improves the quality of classic learning environments, but does not replace them. Due to the increasing popularity of mobile devices, m_learning [8] is used as a promising teaching innovation approach.
The intensive use of mobile devices and mobile applications for a variety of activities (gamming, working, among others) led to the emergence of new mobile services and new opportunities to improve the teaching-learning process (TLP) through ubiquitous wireless learning system. With this type of systems students can use the study materials through mobile devices [9], and they can use them easily whenever they want and where they want, maximizing the idea “always there always on”.
The capabilities of mobile devices led to the emergence of new applications and technologies. In this myriad of solutions the Augmented Reality (AR) and Gamification appear to have a high potential due to their characteristics to increase the engagement, effectiveness and the quality of student learning contents. However, studies [10, 11] show that the use of technology without an adequate pedagogical structure may not produce the desired result and may even to have a negative impact on student learning.
Today, learning management systems, learning platforms, and other educational tools are widely used in classrooms. According to [12], students' motivation and engagement can be achieved through “always-on, socially interactive,
technologically mediated communication artifacts”.
The aim of this study is to investigate if higher education professors in the area of technology, in South Europe (SE), South America (SA), and Asia (AS) countries to prepare their students for using mobile technologies, such as, for example gamification and augmented reality apps. The paper is organized as follows. In section 2 the background of mobile learning as
well as augmented realty and gamification is presented and discussed. The research methodology is presented in section 3. In section 4 is presented the analysis and discussion of results. Finally, section 5 presents the final conclusions and some directions for future work.
II. BACKGROUND
A. Mobile learning
Educational institutions have shown great interest in incorporating m_learning into their TLP [13, 14, 15]. However, there must be increased concern on the part of decision-makers in the adoption of technology in the TLP, because it is not enough to apply and use the technology alone, but to develop methodologies that allow the proper integration of these technologies. Among the various definitions of m_learning, in [16] it is defined as a form of e_learning that specifically uses mobile devices to provide learning and support content, anywhere, anytime [17]. These technologies also allow students to benefit from a customized curriculum tailored to their learning needs [18].
B. Gamification
The first documented that use gamification was in 2008. Gamification is defined as the use of game design elements in non-play contexts; gamification is a relatively new area, but with rapid growth [19].
In the education sector the principles of gamification can help to improve some aspects of the TLP and are applied with “the intention to be more than entertainment” [20]. The main reason for this improvement is directly related to the mechanisms that allow to increase the involvement with the contents of learning and, essentially, to give feedback on the evolution of student learning through the use of tools. The application of gamification can, according to [21], improve learning, overcoming some learning barriers, such as lack of attention, involvement and interest, by introducing the pleasure factor in the accomplishment of learning activities.
C. Augmented Reality
The Augmented Reality (AR) can be used in different devices (computers, tablets, smartphones, and wearable components) [22]. It is defined as combining virtual and real objects in a real environment through mobile devices, working intuitively and in real time; there is a combination of virtual and real objects in the same environment [23].
AR, according to Antonioli, et. al [24], has great potential to be used as a new technology in education. The TLP benefits from the characteristics of AR, because professors realized that the incorporation of this technology enables students to learn effectively [25]. Some authors [26, 27] list a set of advantages in the use of AR in the TLP: (i) To provide easy communication between real and virtual environments; (ii) To give professors an approach to strengthen students' understanding in the classroom by increasing physical supports with virtual explanations and outlines; (iii) To incorporate into formal class the possibility of students to learn outside of class time and outside the school boundaries; (iv) To allow visualization of interactions between 2D / 3D still images and 3D dynamic images.
In addition to the advantages listed above, AR offers another type of intuitiveness between the physical and virtual world and improves user's perception of the current world. AR empowers students to create essential practices and has become one of the key emerging technologies in education [28, 29].
III. RESEARCH METHODOLOGY
This section presents the procedures used in data collection which constitute the basis of the research / study presented. The research carried out used the quantitative methodology, which can be generically defined as a method of social research that uses statistical techniques for the collection and analysis of data. This approach aims essentially to find relationships between variables, to make descriptions using the statistical treatment of collected data, to test theories and to draw conclusions [30]. The selection of the quantitative methodology is justified by the need to collect the opinions and attitudes of the respondents. Data collection was carried out with the use of a questionnaire.
The use of questionnaires requires special care, since it is not enough to collect the answers on the issues of interest, it is also important to perform a statistical analysis for the validation of the results. Aspects such as sample size, questionnaire formulation, data analysis, among others, are important and should be taken into account in research [31]. Before applied, the questionnaire was submitted to the evaluation of four experts in the area.
The quantitative study was based on an online questionnaire with 41 questions (Q1-Q41) relating to 6 sections (Demographic information, Prior knowledge, Participation/Engagement, Use of Mobile Devices (MD), Mobile use in the classroom and Self-efficacy). The first section consists of 6 questions, which include, for example, the age and gender. The second section consists of a question (Q7) with 11 items about professor’s knowledge concerning MD (in particular, the items 10 and 11, with regard to whether they know how to download augmented reality and gamification apps on a MD). The third section contains 18 questions, 15 of which relate to professor’s opinions about students Participation/Engagement (inside and outside) class activity if they uses their MD and 3 questions about the incorporation of MD, augmented reality and gamification in classes. The fourth section concerns a question with 15 items about how to use MD to perform educational tasks inside or outside the classroom (in particular the last 2 items regarding if students play an educational game on their MD or use their MD with augmented reality as a learning tool). In fifth section, we have 12 questions (Q27-Q38) about the use of the MD in the classroom (that is, what professors think about incorporating mobile learning in their classes and the ability of students to use them appropriately), two of these questions specifically refer to whether professors believe that students can be taught how to use MD with augmented reality apps and with gamification apps for learning. Finally, in the last section we have 3 questions (Q39-Q41) about self-efficacy. Almost all questions were close-ended type (Q38 and Q40 are the exceptions). Sections 2 and 4 use nominal scale (Yes (1)/ No (0)). Section 3 use five-point Likert scale ranging from “Strongly Disagree” (1) “Disagree” (2), “Neutral” (3), “Agree” (4) and “Strongly Agree” (5) and section 5 in the first 10 questions (Q27-Q36). Additionally, in
question Q37 of section 5 we use a nominal scale (incorporate MD/ incorporate MD with training/ not incorporate).
The questionnaire has been online for 90 days and 212 valid responses were received. Data collected were treated by using the IBM SPSS Statistics 24.0 software. Statistical analyses used for the data analysis were Descriptive Analysis: frequency analysis, descriptive measures and graphical representations and Inferential Analysis: Kolmogorov-Smirnov test, Kruskal-Wallis test and multiple comparisons with Dunn´s test), correlation analysis and reliability analysis (Cronbach´s Alpha).
IV. ANALYSIS AND RESULTS DISCUSSION
The study sample consists of 212 professors from leading Universities, 80 from South Europe (SE), 61 from South America (SA) and 71 from Asia (AS). 55,2% of the professors in the sample are male and 44,8% female: in SE and SA the majority were male (70% in SE and 60,7% in SA) but in Asia 66,2% were female. Relatively to age, in SE professor´s majority were between 41-50 years (52,5%), in SA between 31-40 years and in AS between 31-40 although less prominent (36,1%). Only 6,6% of the professors have more than 60 years and only 6,6% of the professors have less than 30 years. Relatively to the levels of teaching degrees, we can conclude that in all continents professors teach in a high proportion in PhD, followed by MSc and Degree.
To verify if the variability of the answers resulted from differences in professor’s opinions, we performed a Reliability Analysis using Cronbach´s Alpha for the four dimensions (corresponding to sections 2 to 5), which are “Prior Knowledge” (Dimension 1), “Participation/Engagement” (Dimension 2), “Use of Mobile Devices” (Dimension 3) and “Mobile use in the
classroom” (Dimension 4). The values obtained were 0,844 (11
items), 0,939 (18 items), 0,860 (15 items) and 0,929 (10 items) respectively. Since this measure varies between 0 and 1 and higher values are more desirable, we can consider that all dimensions are reliable. According with these results it makes sense to present the descriptive results (percentages, mean and standard deviation (Sd), according to measurement scale) for each question/item. The results of the analysis can be found in Table I (Dimension 1), Table II (Dimension 2), Table III (Dimension 3), and Table IV (Dimension 4).
Table I presents the percentages of “Yes” responses from 11 items of “Prior Knowledge” (Dimension 1), by continent.
We note, for items 1 to 8, that the majority of these professors have excellent knowledge (with percentages at least 76%) on how to perform the most trivial tasks. The great exception is “Access college resources such as LMS, payroll,
etc., on a MD” where in AS there is a large decrease relative to
SE and SA (about half percentage). Moreover, despite being new technologies for digital transformation, we denoted that although still high for SE and SA (>50%), we found a decrease when the prior knowledge is related to download Augmented Reality applications and Mobile App Gamification on a MD (items 10 and 11), for professors of all continents and in AS this percentages are below 50%. To confirm if there are significant differences in the percentages associated with each continent, for items 10 and 11 we used Kruskal-Wallis test and obtained p-value=0,07 and p-value=0,010, respectively. The application of
this same test for continents SE and SA show that professor’s opinions is independent of the continent to which they belong. So we can conclude that in AS are significant differences in the percentages associated to items 10 and 11 compared to the other continents, in the sense that in AS this percentages are lower. These points to the fact that Asia is still lagging behind other continents in terms of knowledge about new technologies.
TABLE I. PERCENTAGES OF YES RESPONSES OF THE 11 ITEMS OF
“PRI OR KNO WLEDGE” BY CONTINENT
I know how to…on a MD (SE/SA/AS) (%) 1 Connect to and access the internet from 97,5%/96,7%/9 2 Download music and video files 85%/93,4%/83,1% 3 Find the definition of a word or concept 92,5%/93,4%/90,1% 4 Download a mobile application 92,5%/95,1%/91,5% 5 Interface or connect my calendar/alarm 85%/85,2%/81,7% 6 Translate a sentence into another language 90%/90,2%/76,1% 7 Access and participate in a social network site 87,5%/95,1%/87,3% 8 Send and receive emails/text messages 96,3%/96,7%/91,5% 9 Access college resources such as LMS,
payroll, etc. 72,5%/70,5%/35,2%
10 Download AR applications 66,3%/55,7%/40,8% 11 Download Mobile App Gamification 62,5%/54,1%/38%
In terms of “Participation/Engagement” (Dimension 2) the mean values for each continent, are close to the value 4 (agree position), which suggested that professors think that students will have greater involvement and participation in activities if they use their MD. The overall mean was 3.93, 4.17 and 3.9, respectively. These opinions are also consistent (variation coefficient <20%). It can also be seen in Table II that, in general, these values are higher in SA. More, in some questions it is interesting to verify that AS and SE has an identical behavior relatively to continent SA (for example Q16, Q17, and Q25).
TABLE II. MEAN AND STANDARD DEVIATION (SD) FOR QUESTIONS OF
“PARTI CI PATI ON/ENGAGEMENT” BY CONTINENT
Questions (SE/SA/AS) Mean (SE/SA/AS) Sd
... ... …
Q15 – My students would be more likely to ask for help if they could communicate through their MD
3,66/ 4,11/ 4,04 1,09/ 0,97/ 0,85 Q16 – Mobile learning could be
incorporated into classes 4,01/ 4,30/ 4,01 0,92/ 0,92/ 0,85 Q17 – Augmented reality could be
incorporated into ML classes 3,89/ 4,02/ 3,70 1,08/ 1,03/ 0,89 Q18 - Gamification could be
incorporated into ML classes 3,96/ 4,11/ 3,69 0,99/ 0,97/ 0,92
... … ...
Q25 – It would be easy for students to engage in discussions using mobile application or website in mobile format
4,01/ 4,38/ 4,01 1,00/ 0,93/ 0,90
In regard to “Use of MD” (Dimension 3), in the sense, of what educational tasks professors ask students to do (inside or outside the classroom), opinions about the use of MD´s are identical (Table III) in all the continents. Chi-square test confirm there are no significant differences in the percentages associated with each continent (all p-values>0,05). For items 3 and 15 there is a reversal in the opinions. For item 3, “No” is predominant (60%) in SE and for SA professors and AS professors no.
Perhaps SE professors do not view social networks as a suitable study tool in the context of digital transformation. For item 15 “Yes” is predominant in AS (53,5%) but “No” is predominant in SE and SA although, as already mentioned, there are no significant differences. It is interesting to note that all items that refer to “Text a classmate…” (items 6 to 9) predominate the “No” response in all continents, perhaps because it is considered, by the professors, a disturb element, in the context of classroom. TABLE III. PERCENTAGES OF YES RESPONSES OF THE 15 ITEMS OF “USE
OF MD”(Q26) BY CONTINENT
I would ask students to… (%)
(SE/SA/AS) 1 Download applications that help them learn
new subjects 68,8%/ 77%/ 83,1%
2 Use MD to look up something that they didn´t know or understanding during class 70%/ 67,2%/ 83,1% 3 Engage in social networking on their MD 40%/ 52,5%/ 52,1% 4 Write notes on their MD to remind
themselves of an assignment 67,5%/ 63,9%/ 57,7% 5 Set alarms or reminders on their MD to help them remember an assignment or a test 65%/ 63,9%/ 62% 6 Text a classmate during class 21,3%/ 34,4%/ 23,9% 7 Text a classmate about the contents of the
class 40%/ 42,6%/ 33,8%
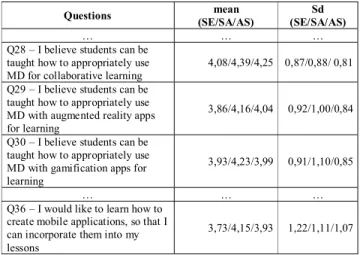
8 Text a classmate about the professor´s ability 17,5%/ 24,6%/ 18,3% 9 Text a classmate about the level of engagement in the class 18,8%/ 29,5%/ 16,9% 10 Take a picture or video with their MD that they could be used for an assignment 65%/ 67,2%/ 64,8% 11 Access an LMS (e.g. Moodle) on their MD 77,5%/ 83,6%/70,4% 12 Read a paper or assignment on their MD 62,5%/ 72,1%/ 73,2% 13 Use their MD as a study tool 60,8%/ 70,5%/ 76,1% 14 Play an educational game on their MD 51,3%/ 57,4%/ 62% 15 Use their MD with augmented reality as a learning tool 48,8%/47,5%/53,5% Table IV shows the results only 5 questions of “Mobile use
in the classroom” (Dimension 4). All the mean values are close
to the value 4 (agree position) and opinions are homogeneous for professors in all continents (variation coefficient<20%). As can be seen in Table IV these values seems higher in SA and AS although professors of all the continents agree about students using MD in classroom. The overall mean was 3.85, 4.24 and 4.09 respectively.
SA and AS have more confidence in their students than SE in the sense that professors believe that students can be taught and that students are motivated to appropriately use MD in their classes. It is also important to highlight the lower availability of SE professors in learning m_learning and mobile applications in order to incorporate into their lessons.
Despite this, it should be noted that the dispersion of the responses in AS is less than the dispersion of the responses in the other continents, which reveals greater consistency in the responses in the AS continent.
Concerning Q37, in order to incorporate mobile learning in classroom, we found that the majority (62,3%) of SA and (64,8%) of AS professors said will be able to effectively incorporate this with training against 45% of SE professors. It should also be noted that the low percentage of professors from all continents (11,3% in SE, 4,9% in SA and 7% in AS) not think will be able to effectively incorporate mobile learning.
TABLE IV. MEAN AND STANDARD DEVIATION (SD) FOR QUESTIONS OF
“MOBILE USE IN THE CLASSROOM” BY CONTINENT
Questions (SE/SA/AS) mean (SE/SA/AS) Sd
… … …
Q28 – I believe students can be taught how to appropriately use MD for collaborative learning
4,08/4,39/4,25 0,87/0,88/ 0,81 Q29 – I believe students can be
taught how to appropriately use MD with augmented reality apps for learning
3,86/4,16/4,04 0,92/1,00/0,84 Q30 – I believe students can be
taught how to appropriately use MD with gamification apps for learning
3,93/4,23/3,99 0,91/1,10/0,85
… … …
Q36 – I would like to learn how to create mobile applications, so that I can incorporate them into my lessons
3,73/4,15/3,93 1,22/1,11/1,07
In order to assess professor´s global opinion about the questions in Dimensions 2 and 4 (“Participation/Engagement” and “Mobile use in the classroom”) we constructed 2 indices, Index_D2 and Index_D4, calculating the arithmetic mean of the variables that integrate each dimensions. To identify if these 2 indices were associated we calculate Pearson correlation coefficient, by continent. Correlation analysis confirms the significant relation at the 0,01 level (see Table V). The results show that exists strong positive correlation (r > 0,8), whatever the continent, that is, the professors that most agree in Dimension 2 (“Participation/Engagement”) are those who most agree in Dimension 4 (“Mobile use in the classroom”).
TABLE V. PEARSON CORRELATION BETWEEN INDEX_D2 AND
INDEX_D4, BY CONTINENT
Continent
SE SA AS
Index_D2 Index_D2 Index_D2
P S P S P S
Index_D4 ,848 ,000 79 ,884 ,000 61 ,832 ,000 71 S – Sig. (2-tailed); P – Pearson
We build boxplot clusters (Figure 1) to verify if there exists some differences in Index_D2 or/and in Index_D4 by continent. We can conclude immediately that, professor’s opinion relatively to variables that compose Index_D2 and Index_D4 is more favorable for SA continent. In a preliminary analysis it also seems quite similar the professor’s opinion of SE and AS, regarding the variables that compose Index_D2 and that compose Index_D4. So, we verified that are more SA professors who think that students will have a higher involvement and participation in the activities if they use their MD just as there are more SA professors that believe that students can be taught to appropriately use MD, compared with the professors of other continents. Also noteworthy is the existence of some moderate and severe outliers, predominantly male (very unfavorable opinion´s).
To verify if we can perform tests of parametric hypotheses, we start by evaluating whether the two Indices (Index_D2 and Index_D4) follow a Normal distribution (Kolmogorov-Smirnov test with Lilliefors correction) with a significance of 5% (Table VI). This hypothesis was not verified in both cases, for at least
one continent. As the assumption of normality is rejected we opted by use a non-parametric test (Kruskal-Wallis test) to know if the continent to which professor belongs influences his opinion about the two indices.
Figure 1. Distribution of Index_D2 and Index_D4 for each continent TABLE VI. RESULTS OFKOLMOGOROV-SMIRNOV, BY CONTINENT
One-Sample Kolmogorov-Smirnov Test
Continent Index_D2 Index_D4
SE N 80 79
Asymp. Sig. (2-tailed) ,200c ,200c
SA N 60 60
Asymp. Sig. (2-tailed) ,046c ,000c
AS N 71 71
Asymp. Sig. (2-tailed) ,200c ,025c
c. Lilliefors Significance Correction.
As we can in Table VII the p-values (Sig.) < 0,05 (p-value = 7% and p-value = 0%) so we can conclude that there are at least two continents that differ significantly from each other regarding professors' opinions about Participation/Engagement and Mobile use in the classroom.
TABLE VII. RESULTS OF KRUSKAL-WALLIS TEST
Null Hypothesis Sig. Decision
1 The distribution of Index_D2 is the same across categories of Continent 7,000 Reject the null hypothesis 2 The distribution of Index_D4 is the same across categories of Continent ,000 Reject the null hypothesis
Asymptotic significances are displayed. The significance level is ,05. However, the Kruskal-Wallis test does not indicate which continents for which professors' opinions are significantly different. Therefore, to perform this identification we will proceed to the multiple comparison of the order means using the Dunn test statistic [32] for Index_D2 and Index_D4.
TABLE VIII. RESULTS OF DUNN´S MULTIPLE COMPARISONS FOR
INDEX_D2 Samples 1-Sample2 Test Statistic Std. Error Std. Test Statistic Sig. Adj. Sig. SE-AS -7,698 9,949 -,774 ,439 1,000 SE-SA -32,102 10,421 -3,080 ,002 ,006 AS-SA 24,404 10,701 2,281 ,023 ,060
TABLE IX. RESULTS OF DUNN´S MULTIPLE COMPARISONS FOR
INDEX_D4 Sample1-Sample2 Test Statistic Std. Error Std. Test Statistic Sig. Adj. Sig. SE-AS -21,916 9,911 -2,211 ,027 ,081 SE-SA -43,600 10,379 -4,201 ,000 ,000 AS-SA 21,684 10,628 2,040 ,041 ,124
Using the unadjusted asymptotic p-value (Sig.), we can conclude that the significant differences occur between continents SE-SA and AS-SA for Index_D2 and between all continents with respect to Index_D4. If we use Adj. Sig. the differences between some continents become marginally significant. Since we have only three continents (groups) we chose the results provided by test Sig.
These conclusions confirm our preliminary analysis (using the box-plot) and can also be validated by the graphical representations of the continents with sample average rank of each continent (see Figure 2). In these representations the continents that differ significantly are identified, with a yellow line. Note that relatively to Index_D2 there isn´t a line connecting SE and AS.
Figure 2. Pairwise comparisons of Index_D2 and Index_D4 for each continent
V. CONCLUSIONS
This new digital age leads to the need for professors in general, and higher education professors in particular, to explore and experience their educational efforts, once again, taking activities, methodologies and technologies far beyond the traditional blackboard and textbook approach, namely mobile learning with gamification and augmented reality.
So, as general conclusions we can say that the majority of professors have excellent knowledge on how to perform the most trivial tasks. Exception to “Access college resources such
as LMS, payroll, etc.”, “Download augmented reality applications” and “Download Mobile App Gamification on a
MD” in continent Asia. In terms of
“Participation/Engagement” the mean values are identical for all continents and are close to the value 4 (agree position), which suggested that professors think that students will have greater involvement and participation in activities if they use their MD. In regard to “Use of MD” in the sense of what educational tasks professors ask students to do, opinions about the use of MD´s are identical in all the continents. Relatively to, “Mobile use in the classroom”, all the mean values are close to the value 4 and opinions are homogeneous for professors in all continents. These values seems higher in SA and AS, although, the professors of three continents agree about students using MD in classroom. Also relevant is the large percentage of
professors from the continents SA and AS who think that they are able to effectively incorporate m_learning in their classes, with training. In Asia, this percentage is no longer predominant although it can be considered moderately high (45%). In order to conclude whether or not these higher education professors, in the area of technology, prepare and/or are committed to having their students use mobiles technologies for better and more effective performance in their classes, we consider that professors' opinions about the dimensions "Students
Participation/Engagement if they use their MD" and
"Incorporating ML in their classroom" are relevant. Thus, when carrying out a detailed study of these two dimensions we find that: on the three continents under review, professors that most agree that their students will be more participatory and engaged in/out of the classroom if they use their MDs are those professors who most agree on that it is possible to incorporate successfully into their classes with/without training ML (strong positive correlation). So, the results of the study point to a similar situation in the different countries with small differences, particularly with regard to students’ participation, engagements and mobile use in the classroom.
Unfortunately, the small sample size did not allow to definitively understand how teachers prepare their students for using mobile technologies with gamification and augmented reality and how they can be used to promote student engagement inside and outside the classroom. As future work it will be explored by collecting data with a larger sample in order to obtain greater statistical significance. The research also intends, on the one hand to accompany the evolution of teachers towards digital higher education and on the other hand to have the perception of the students’ needs of a more digital teaching.
REFERENCES
[1] National Research Council, “A framework for K-12 science education: Practices, crosscutting concepts, and core ideas,” Committee on a Conceptual Framework for New K-12 Science Education Standards. Board on Science Education, Division of Behavioral and Social Sciences and Education. Washington, DC: The National Academies Press, 2011. [2] R. Sternberg, J. Pretz, “Cognition & intelligence: Identifying the
mechanisms of the mind,” New York: Cambridge University Press, 2005. [3] C. Dede, “Theoretical perspectives influencing the use of information technology in teaching and learning,” In J. Voogt, & G. Knezek (Eds.), International handbook of information technology in primary and secondary education, 2008, pp. 43–62.
[4] J. Friedrich, A. Katherine, S. Sellers, “9: Thawing the Chilly Climate: Inclusive Teaching Resources for Science, Technology, Engineering, and Math,” To Improv. Acad., vol. 26, no. 1, pp. 133–141, 2008.
[5] K. Kapp, “The Gamification of Learning and Instruction: Game-Based Methods and Strategies for Training and Education,” John Wiley & Sons, 2012.
[6] S. Jamali, M. Shiratuddin, K. Wong and C. Oskam, "Utilising Mobile-Augmented Reality for Learning Human Anatomy", Procedia - Social and Behavioral Sciences - 7th World Conference on Educational Sciences, vol. 197, Athens, Greece, 2015, pp. 659-668.
[7] T. Roffmann, T. Friese, "Mobile Augmented Reality for Learning," Seminar:Mobile Learning winter semester 2011/2012 Computer-Supported Learning Research Group, 2012.
[8] E. Georgieva, “A comparison analysis of mobile learning systems.” Communication & Cognition, vol. 40, no. 3-4, pp. 193–202, 2007. [9] M. Ally, “Mobile learning: transforming the delivery of education and
training,” 2009
[10] J. E. Cristia, P. Ibarrarán, S. Cueto, A. Santiago, “Technology and child development: Evidence from the One Laptop per Child Program,” Am. Econ. J. Appl. Econ., vol. 9, no. 3, pp. 295–320, 2017.
[11] L. Echeverría, A. Améstica, F. Gil, M. Nussbaum, E. Barrios, “Exploring different technological platforms for supporting co-located collaborative games in the classroom,” Comput. Human Behav., vol. 28, no. 4, pp. 1170–1177, 2012.
[12] D. Le Roux, D. Parry, “In-Lecture Media Use and Academic Perfor-mance: Does Subject Area Matter?” Comp. in Human Behav., vol. 77,pp. 86–94, 2017
[13] F. Moreira, M. J. Ferreira, “Teaching and Learning Modelling and Specification based on Mobile Devices and Cloud,” International Journal of Technology and Human Interaction, vol. 13, no. 4, pp. 33-49, 2017. [14] F. Moreira, M. J. Ferreira, C. S. Pereira, N. Durão, “Evolution and use of
mobile devices in higher education: A case study in Portuguese Higher Education Institutions between 2009/2010 and 2014/2015,” Telematics and Informatics, vol. 34, no. 6, pp. 838-852, 2016.
[15] Ö. Delialioğlu, Y. Alioon, “The effect of students’ subject discipline on their m-learning application preferences,” Interactive Learning Environments, vol. 24, no. 8, pp. 1957-1966, 2016.
[16] Y.-M. Cheng, “Towards an understanding of the factors affecting m-learning acceptance: Roles of technological characteristics and compatibility”, Asia Pacific Management Review, no. 20, pp 109-119, 2015.
[17] C.-C. Chen, T.-C. Huang, “Learning in a u-Museum: developing a contextaware ubiquitous learning environment,” Comp. and Education, vol. 59, no. 3, pp. 873-883, 2012.
[18] G.-J. Hwang, H.-F. Chang, “A formative assessment-based mobile learning approach to improving the learning attitudes and achievements of students,” Comp. and Education, vol. 56, no. 4, pp. 1023-1031, 2011. [19] S. Deterding, D. Dixon, R. Khaled, L. Nacke, “From game design
elements to gamefulness: Defining “gamification.” In A. Lugmayr, H. Franssila, C. Safran, & I. Hammouda (Eds.), MindTrek, pp. 9–15, 2011. [20] R. J. Baxter, D. Kip Holderness, D. A. Wood, “Applying Basic
Gamification Techniques to IT Compliance Training: Evidence from the Lab and Field,” Journal of Information Systems, vol. 30, no. 3, pp. 119– 133, 2016.
[21] U. Ritterfield, M. Cody, P. Vorderer, “Serious Games: Mechanisms and Effects,” London, U.K.: Routledge, 2009.
[22] H. Swensen, “Potential of augmented reality in sciences education a literature review,” November, pp. 2540–2547, 2016.
[23] B. M. Azuma, Y. B. Ronald, B. Reinhold, F. Steven, J. Simon, “Recent advances in augmented reality,” IEEE Comput. Graph. Appl., vol. 21, no. 6, pp. 34–47, 2001.
[24] B. M. Antonioli, C. Blake, K. Sparks, “Augmented Reality Applications in Education,” no. 2009, pp. 96–107, 2013.
[25] N. F. Saidin, N. D. A. Halim, N. Yahaya, “A review of research on augmented reality in education: Advantages and applications,” Int. Educ. Stud., vol. 8, no. 13, p. 1, 2015.
[26] M. Al-Azawi, R. Shakkah, “Embedding augmented and virtual reality in educational learning method: Present and future,” in In Information and Communication Systems (ICICS), 9th International Conference on, 2018, pp. 218–222.
[27] S. Singhal, S. Bagga, P. Goyal, V. Saxena, “Augmented chemistry: Interactive education system,” Int. J. Comput. Appl., vol. 49, no. 15, 2012. [28] J.-C. Wu. H.-K, Lee, S. W.-Y., Chang, H.-Y., Liang, “Currents status,
opportunities and challenges of augmented reality in education,” Comput. Education, vol. 62, pp. 41-49, 2013
[29] Y. Hsu, Y. Lin, B. Yang, “Impact of augmented reality lessons on student’ STEM interest,” Res. Pract. Technolo. Enhanc. Learn., 2017.
[30] M. J. Goertzen, "Introduction to Quantitative Research and Data," Lib. Tech. Rep., vol. 53, pp. 12–18, 2017.
[31] L.-V. Campenhoudt, R. Quivy, "Manual de Investigação em Ciências Sociais," G. Publicações, 2008.
[32] J. Maroco, "Análise Estatística com o SPSS," 7a edição, ReportNumber, Lda, 2018.