Ethnicity and glutathione S-transferase
(GSTM1/GSTT1) polymorphisms in a
Brazilian population
Departamentos de 1Medicina Legal, Ética Médica e Medicina Social e do Trabalho,
and 2Clínica Médica, Faculdade de Medicina, Universidade de São Paulo,
São Paulo, SP, Brasil
3FUNDACENTRO-CRBA, Salvador, BA, Brasil
4Departamento de Medicina Preventiva, Faculdade de Medicina,
Universidade Federal da Bahia, Salvador, BA, Brasil
5Department of Epidemiology, School of Public Health,
University of North Carolina (UNC-CH), Chapel Hill, NC, USA G.J.F. Gattás1,
M. Kato3,5,
J.A. Soares-Vieira1,
M.S. Siraque1,
P. Kohler1,
L. Gomes1,
M.A.V. Rego4
and S.P. Bydlowski2
Abstract
The distribution of polymorphisms related to glutathione S-trans-ferases (GST) has been described in different populations, mainly for white individuals. We evaluated the distribution of GST mu (GSTM1) and theta (GSTT1) genotypes in 594 individuals, by multiplex PCR-based methods, using amplification of the exon 7 of CYP1A1 gene as an internal control. In São Paulo, 233 whites, 87 mulattos, and 137 blacks, all healthy blood-donor volunteers, were tested. In Bahia, where black and mulatto populations are more numerous, 137 subjects were evaluated. The frequency of the GSTM1 null genotype was significantly higher among whites (55.4%) than among mulattos (41.4%; P = 0.03) and blacks (32.8%; P < 0.0001) from São Paulo, or Bahian subjects in general (35.7%; P = 0.0003). There was no statis-tically different distribution among any non-white groups. The distri-bution of GSTT1 null genotype among groups did not differ signifi-cantly. The agreement between self-reported and interviewer classifi-cation of skin color in the Bahian group was low. The interviewer classification indicated a gradient of distribution of the GSTM1 null genotype from whites (55.6%) to light mulattos (40.4%), dark mulat-tos (32.0%) and blacks (28.6%). However, any information about race or ethnicity should be considered with caution regarding the bias introduced by different data collection techniques, specially in coun-tries where racial admixture is intense, and ethnic definition bound-aries are loose. Because homozygous deletions of GST gene might be associated with cancer risk, a better understanding of chemical me-tabolizing gene distribution can contribute to risk assessment of humans exposed to environmental carcinogens.
Correspondence
G.J.F. Gattás Instituto Oscar Freire Rua Teodoro Sampaio, 115 05405-000 São Paulo, SP Brasil
Fax: +55-11-3085-9677 E-mail: [email protected] The study of the São Paulo population was supported by FAPESP and LIM-HC-FMUSP and the study of the Bahia population was partially supported by the Bahia-Carolina Fellowship/Fogarty International.
Received May 30, 2003 Accepted February 5, 2004
Key words
•Glutathione S-transferase mu (GSTM1)
•Glutathione S-transferase theta (GSTT1)
•Enzyme polymorphism •Population frequency •Ethnicity
Introduction
The glutathione S-transferases (GST) are an important enzymatic system of the cellu-lar mechanism of detoxification that pro-tects cells against reactive oxygen metabo-lites due to the conjugation of glutathione with electrophilic compounds. GST enzymes are involved in the metabolism of xeno-biotics that include environmental carcino-gens, reactive oxygen species and chemo-therapeutic agents (1). The great majority of catalyzing reactions between glutathione and electrophilic compounds results in detoxifi-cation products, although in a few cases the metabolic product can be more reactive than the original one. Due to the detoxifying ac-tion, it has been suggested that these en-zymes play an important role in cancer sus-ceptibility (2-5).
At least seven distinct classes of soluble GST that are highly expressed in the mam-malian liver have been already identified (6): alpha, mu, pi, sigma, theta, kappa, and zeta. The GSTM1 locus has been mapped on chromosome 1p13.3. Three different alleles have been identified in the same locus, in-cluding gene deletion, and two other muta-tions (GSTM1a and GSTM1b) that differ by C to G substitution at base position 534 (7). The human GSTT1 gene is 8.1 kb in length and it has been mapped on chromosome 22q11.2 (8,9). For GSTT1 two different
alle-les have been identified that confer func-tional properties to the gene. Subjects with at least one functional allele for GSTM1 and GSTT1 are grouped into the positive conju-gator types, and called GSTM1-positive and GSTT1-positive, respectively (4). The de-leted genotypes that lead to the inactive form of the enzymes were named “GSTM1-null” and “GSTT1-null”.
Associations of GSTM1 and/or GSTT1 null genotypes with bladder, lung, and colo-rectal cancer, as well as head and neck squa-mous cell carcinoma have been reported and represent an area of intensive research (10-14). The relevance of the polymorphism of these enzymes regarding DNA adduct levels or urinary metabolites of xenobiotics has also been widely discussed (15-18).
The variability in the distribution of the null phenotypes of GSTM1 and GSTT1, due to total or partial gene deletion resulting in the lack of the active enzyme, has been reported in different populations, especially in ethnically well-defined groups (19-21). However, Brazil, as most of Latin American and Caribbean countries, is a multiracial society with no clearly defined differences among races, especially between blacks and whites. Brazilian history shows that since the mid-colonial era the population of mulat-tos was already numerous (22). However, differences between geographical regions can be observed (Table 1).
Table 1. Distribution of the population according to skin color in Brazil and in the States of São Paulo and Bahia, according to 2000 census data.
Total White Black Pardos Asian Amerindian
Brazil 169,799,170 90,647,461 10,402,450 66,016,783 866,972 701,462
(53.4%) (6.1%) (38.9%) (0.51%) (0.41%)
São Paulo 37,032,403 26,067,368 1,667,745 8,480,871 518,278 62,018
(21.8% of total) (70.4%) (4.5%) (22.9%) (1.40%) (0.16%)
Bahia 13,070,250 3,067,786 1,700,531 8,095,318 23,868 60,329
(7.7% of total) (23.5%) (13.0%) (61.9%) (0.18%) (0.46%)
In a recent cross-sectional study con-ducted in the interior of Bahia, a State in the northeast of Brazil, we investigated rural workers mainly exposed to wood smoke and diesel exhaust while cutting wood or execut-ing their tasks in charcoal factories. Some enzyme polymorphisms were assessed in the study, as they were considered to be possible modulating factors of the biomarker levels among workers and also useful to identify higher susceptibility to potentially hazard-ous substances.
Therefore, we evaluated the distribution of GSTM1 and GSTT1 genotypes within the Bahian rural worker group and compared it to GST polymorphism frequency in groups of whites, mulattos, and blacks living in São Paulo city, located in southern Brazil.
Material and Methods
The GSTM1 and GSTT1 gene frequency was assessed in 594 individuals divided into four subgroups. The first group comprised 233 unrelated white individuals (mean age = 36.6 ± 13 years), the second group included 87 mulattos (mean age = 33.5 ± 10 years) and the third, 137 blacks (mean age = 37.5 ± 10 years) selected by personal interview in the city of São Paulo. Unrelated healthy blood donor volunteers for the study were selected at the Pró-Sangue Hemocentro of São Paulo Foundation.
Subjects were interviewed and asked about their ethnic group and also about their parents’ and grandparents’ groups, accord-ing to their own definition. Phenotype anal-ysis (skin pigmentation in the inner part of the arm, face and hair characteristics) was performed by the interviewer. Subjects were classified as black when they defined them-selves and their parents and all the grandpar-ents as blacks and presented the characteris-tic phenotype.
The last group consisted of 137 male indi-viduals (mean age = 34.1 ± 10 years) who worked in the rural area of Bahia State, Brazil.
They worked in seven different companies located in the northeastern counties, 100 to 150 km from the capital of the state. They were all born in Bahia or in the neighboring states of Alagoas and Sergipe. Socio-demographic data were obtained by interview by properly trained personnel. To verify ethnicity, the interview-ees answered the question “what is your color?”, structured as in the census question-naire (23,24), and the interviewers classified volunteers according to phenotype.
The present studies were approved by the Research Ethics Committee, and all partici-pating subjects signed a term of consent after being informed about the objectives of the study.
Genomic DNA for genotyping was iso-lated from 5 ml peripheral blood lympho-cytes by a non-organic DNA extraction pro-cedure (25). A single assay using a multiplex PCR was performed for simultaneous gene amplification (26). Briefly, 50 ng of DNA was amplified in a 50-µl multiplex reaction mixture containing 30 pmol of each of the following GSTM1 primers (G1 - 5' GAA CTC CCT GAA AAG CTA AAG C 3' and G2 - 5' GTT GGG CTC AAA TAT ACG GTG G 3'), and of the following GSTT1 primers (T1 - 5' TTC CTT ACT GGT CCT CAC ATC TC 3' and T2 - 5' TCA CCG GAT CAT GGC CAG CA 3'). As an internal control, the exon 7 of the CYP1A1 gene was also amplified (5' GAA CTG CCA CTT CAG CTG TCT 3' and 5' CAG CTG CAT TTG GAA GTG CTC 3') in a medium consisting of 1.5 mM MgCl2,
bro-mide-stained 2.0% agarose gel.
The subjects were classified as either positive (when at least one copy of the gene was present) or null genotypes. Heterozy-gous and homozyHeterozy-gous individuals for GSTM1 (GSTM1 +/0 and GSTM1 +/+) or GSTT1 (GSTT1 +/0 and GSTT1 +/+) have been reported to present similar enzyme ex-pression levels (27) and were considered together for statistical analysis. The Mantel-Haenzel test or Fisher exact test was used to determine the differences between groups and the kappa statistic was used to assess the agreement between racial classifications.
Results and Discussion
The distribution of the GSTM1 null geno-type (Table 2) was more frequent among white individuals (55.4%) than among mul-attos (41.4%) and blacks (32.8%) from São Paulo, or Bahian rural workers in general (35.7%). The frequency of the GSTM1 null genotype observed in all four groups were statistically different when whites were com-pared to mulattos (P = 0.03), to blacks (P < 0.0001), or to Bahian rural workers (P = 0.0003). For GSTT1 null type, blacks showed the highest frequency (26.3%) followed by
Bahian rural workers (23.8%), whites (22.3%), and mulattos (17.2%); there was no statistically significant difference between groups (Table 2). Figure 1 illustrates the PCR results of GSTM1 and GSTT1 geno-types in comparison to the internal standard control.
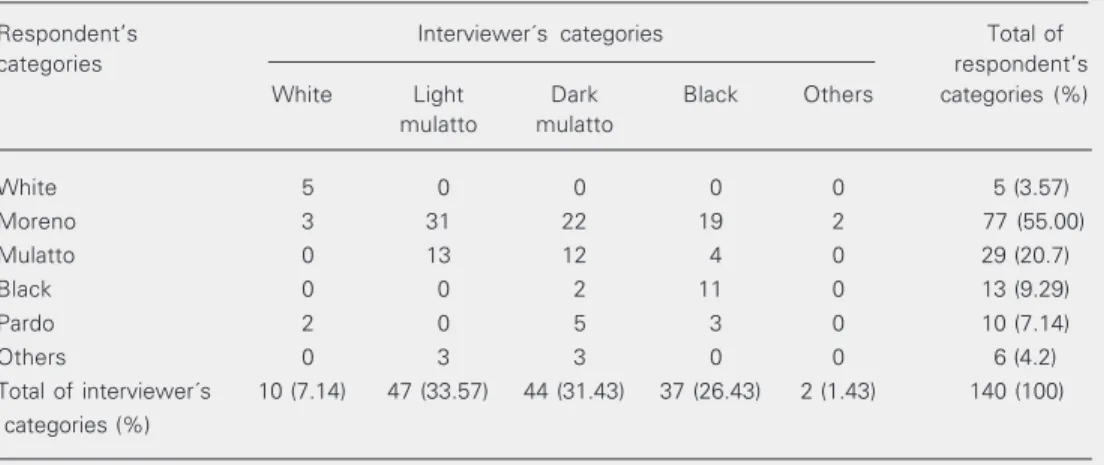
The distribution of the Bahian popula-tion according to the interviewers and the respondents’ classification of skin color is shown in Table 3. This population is essen-tially non-white, containing less than 10% white individuals. The majority of subjects classified themselves as “morenos”, while the interviewers classified them mostly as mulattos. The word “moreno” was not sug-gested by the interviewers and was reported despite options such as “mulatto” and “black” were given. “Moreno” means tanned, darker skin or dark hair, can be applied to individu-als of any ethnic origin, and is not an official term used to classify ethnic groups. Mulattos or “pardos” are terms officially applied to those of mixed African and European origin. The State of Bahia was the first area of colonization in Brazil, which was started by the Portuguese and followed by Africans brought as slaves. At the present time, the Bahian population consists of 75%
individu-Table 2. Distribution of GSTM1 and GSTT1 null genotypes according to ethnicity in volunteers from São Paulo and Bahia States, Brazil.
Skin color N GSTM1 null (%) GSTT1 null (%) GSTM1 null/
GSTT1 null (%)
Total 594 261 (43.9) 137 (23.1) 54 (9.1)
São Paulo group
White 233 129 (55.4)* 52 (22.3) 23 (9.9)
Mulatto 87 36 (41.4) 15 (17.2) 5 (5.8)
Black 137 45 (32.8) 36 (26.3) 13 (9.5)
Bahia group
All workers 137 51 (35.7) 34 (23.8) 13 (9.1)
Self-reported ethnic classification
Moreno 77 28 (36.4) 15 (19.5) 7 (9.1)
Moreno and mulatto 106 38 (34.5) 23 (21.7) 9 (8.5)
Interviewers’ ethnic classification
Mulatto 89 32 (36.0) 17 (19.1) 7 (7.9)
als of African origin (Table 1). In São Paulo State, African descendants are less numer-ous (27.5%) (24). In addition, Bahia State is located much closer to the Equator than São Paulo State, receiving higher sunlight levels. Consequently, workers, especially those who execute their tasks outdoors, have deeply tanned skin color.
The proportion of racial admixture dif-fers according to the region of the country, and the terminology used to denote ethnic groups might also vary (23). Furthermore, racial categories are often based on respon-dents’ self-identification of skin color (23, 24), and “accurate color terminology is es-pecially difficult when discussing Brazil” (22). Therefore, we assessed the compara-bility of the self-reported categorization with the interviewer-rated classification within
the rural worker group, and also compared this group to other groups in São Paulo.
It was clear that “moreno” corresponded mainly to the mulatto and black classifica-tion given by the interviewer, but also en-compassed a wider range of possibilities (Table 3). And there was also a smaller group of respondents who identified them-selves as mulattos. Due to this fact, the agree-ment between the interviewer’s classifica-tion and the interviewee’s self-reported race categorization was relatively low (weighted kappa = 0.4142; P < 0.05).
No statistically significant differences in the distribution of GSTM1 and GSTT1 null genotypes were observed when 137 workers were stratified according to interviewers’ or interviewees’ classification of skin color (Table 2). Also, no difference was observed
CYP1A1
Exon 5 Exon 4
Exon 7
GSTT1 Intron 4
Intron 6 GSTM1
Exon 7 Exon 6
C2
312 bp
C1 T1 T2
215 bp 480 bp L 1 2 3 4 5 6 7 8 9 10 11 12 13 14 L
M1 ⇒ ⇐ M2
Figure 1. PCR products from the co-amplification of GSTM1 (215 bp), GSTT1 (480 bp) and the in-ternal control, the CYP1A1 gene (312 bp). The gel was ethidium-bromide-stained 2% agarose gel (lanes 1, 3, 7, 8, 12 and 14, GSTM1+/GSTT1+ genotype; lanes 2, 5 and 11, GSTM1+/ GSTT1 null genotype; lanes 9 and 13, GSTM1 null/GSTT1+ genotypes; lanes 4, 6 and 10, GSTM1 and GSTT1 null geno-type). L = ladder.
Table 3. Comparison of the distribution of the Bahian volunteers according to self-reported skin color and the interviewers’ categorization.
Respondent’s Interviewer´s categories Total of
categories respondent’s
White Light Dark Black Others categories (%)
mulatto mulatto
White 5 0 0 0 0 5 (3.57)
Moreno 3 31 22 19 2 77 (55.00)
Mulatto 0 13 12 4 0 29 (20.7)
Black 0 0 2 11 0 13 (9.29)
Pardo 2 0 5 3 0 10 (7.14)
Others 0 3 3 0 0 6 (4.2)
Total of interviewer´s 10 (7.14) 47 (33.57) 44 (31.43) 37 (26.43) 2 (1.43) 140 (100) categories (%)
when comparing the same categories in both classifications, and between morenos from respondents’ classification and mulattos from the interviewers’ classification.
The Bahian morenos and the interviewer-classified mulatto groups, as well the mu-latto group from São Paulo, presented rather lower frequencies of the GSTT1 null geno-type. The mulattos from São Paulo showed a lower prevalence of both GSTM1 and GSTT1 null types, albeit not statistically different from other groups. Apparently, there was no specific reason for the observed frequency, which might be attributed to a small sample size and to chance. Further investigation with larger samples needs to be conducted to better investigate these discrepancies.
The distribution of GSTM1 and GSTT1 null genotypes varies among different ethnic groups. Several population-based studies have reported a prevalence ranging from 47 to 58% for the GSTM1 deletion genotype, from 13 to 25% for the GSTT1-null geno-type among white Europeans and 27.6% among the US white population (7,19). Rela-tively few data exist about GSTM1
polymor-phism in black and mulatto populations (28-30). Garte and collaborators (19) evaluated database information on over 15,000 people, identifying only seven published papers about GSTM1 distribution among African and Af-rican-Americans resulting from the analysis of 479 individuals. The reported GSTT1 null genotype among African-Americans ranged from 20 to 24% (26,29).
In our study, the lowest frequency of the GSTM1 null genotype was observed among blacks (32.8%) and was similar to that previ-ously reported for other populations of Afri-can descent. The white group presented an estimated GSTM1 null frequency similar to that reported for the Portuguese population by Moreira et al. (31). The null genotype frequencies observed for GSTM1 and GSTT1 in this report were in agreement with data reported by Arruda et al. (32), Hatagima et al. (33) and Gattás and Soares-Vieira (34) for some Brazilian groups.
The Brazilian population resulted basi-cally from the racial mixture between whites from the Iberian Peninsula and Africans of various ethnic groups, with a small contribu-tion by native Amerindians. Blacks from Bahia descend predominantly from those brought as slaves from the Gulf of Guinea. In the south, descendants from the Bantu tribe, originally from Angola and the Congo, are more numerous (35,36). In the official cen-sus the word “pardo” has been used to desig-nate those with a wide range of skin color between white and black. The term does not only mean mulatto, but can also refer to other admixtures. The population of pardos has been increasing and comprises about 40% of the national population (22,24).
There was no statistical difference within the Bahian group or between any non-white groups (Table 2) in our study. Lack of statis-tical power to show a difference due to rela-tively small sample sizes of some groups is one possible reason. However, this may also represent the lack of a rigid distinction be-tween races and the intense admixture that
Table 4. Distribution of GSTM1 and GSTT1 null genotypes in Bahian volunteers, Brazil.
GSTT1 null GSTM1 null Total
Self-reported skin color
White 0 (0%) 3 (60%) 5
Moreno 15 (20%) 28 (35%) 77
Mulatto 8 (28%) 10 (35%) 29
Black 6 (50%) 3 (25%) 12
Brown 5 (25%) 3 (38%) 8
Others 1 (17%) 2 (33%) 6
Total 32 (23%) 49 (36%) 137
Interviewer-classified skin color
White 2 (22%) 5 (56%) 9
Light mulatto 8 (17%) 19 (40%) 47 Dark mulatto 9 (21%) 13 (31%) 42 All mulatto 17 (19%) 32 (36%) 89
Black 13 (37%) 10 (29%) 35
Others 0 (0%) 2 (100%) 2
Total 32 (24%) 47 (35%) 135
has been occurring in this country.
Telles and Lim (37) have previously shown discrepancies between self-reported information and interviewer classification of race. In our study, the frequencies of GSTM1 and GSTT1 null types in the moreno group and in the interviewer-classified mul-attos from Bahia, as well as in the mulatto group from São Paulo were very similar and reached intermediate values between those found for white and black groups for GSTM1 (Table 2). In the interviewer-classified Bahian group it was possible to notice a gradient. The presence of the GSTM1 null genotype was detected in 55.6% of whites, 40.4% of light mulattos, 32.0% of dark mulattos, and 28.6% of blacks (Table 4).
The loose boundaries of the ethnic defi-nition also cause changes in self-identifica-tion. Surrat and Inciardi (38), in a health behavior study conducted in Rio de Janeiro at different time points, reported that 106 (12.5%) of theirs clients changed their racial categories. They also questioned the use of racial comparison of health risks within their setting, since they consider racial identities in Brazil as “dynamic concepts, which can only be understood if situated and explored within appropriate cultural context”. Telles and Lim (37) suggested that interviewer clas-sification might be more appropriate for studying social inequalities, since it reflects how others classify one’s race.
The perception of skin color differences and the cultural context of the words denot-ing race or ethnicity might differ from North to South in Brazil, between urban and rural areas, as well as from the interviewer to the interviewed (23). In our study, we did not
investigate differences in social or cultural context. However, it was important to assess whether the Bahian group could be compa-rable to other previously studied populations regarding genetic polymorphisms, and also if there was any difference between morenos and mulattos. The fact that the interviewer classification was able to detect a trend from whites to blacks for the GSTM1 null geno-type is an indication that it can be more useful than the self-identification of race in molecular epidemiology studies.
Any information about race, skin color, or ethnicity should be considered with cau-tion in Brazil, and data colleccau-tion as well as interpretation of the information should be conducted within the appropriate cultural/ social setting. Comparison of studies, espe-cially those conducted in different regions or countries, should evaluate the weight of the bias introduced by different data collection techniques.
We have presented here the genotype distribution of two susceptibility genes of the GST family observed in samples from the São Paulo and Bahia population in Bra-zil. The mulatto groups showed intermediate values between whites and blacks, and there were no statistically different distributions among any non-white groups. A better un-derstanding of polymorphic chemical me-tabolizing genes can contribute, in the fu-ture, to preventive actions or to risk assess-ment of humans exposed to environassess-mental carcinogens. For this purpose, however, it is important to take into account the different characteristics and cultural contexts of each population.
References
1. Hayes JD & Pulford DJ (1995). The glutathione S-transferase super-gene family: regulation of GST and the contribution of the isoen-zymes to cancer chemoprotection and drug resistance. Critical Re-views in Biochemistry and Molecular Biology, 30: 445-600. 2. Taningher M, Malacarne D, Izzotti A, Ugolini D & Parodi S (1999).
Drug metabolism polymorphisms as modulators of cancer suscepti-bility. Mutation Research, 436: 227-261.
4. Landi S (2000). Mammalian class theta GST and differential suscep-tibility to carcinogens: a review. Mutation Research, 463: 247-283. 5. Wünsch Filho V & Gattás GJF (2001). Molecular biomarkers in
cancer: implications for epidemiological research and public health. Cadernos de Saúde Pública, 17: 467-480.
6. Awasthi YC, Sharma R & Singhal SS (1994). Human glutathione S-transferases: minireview. International Journal of Biochemistry, 26: 295-308.
7. Rebbeck TR (1997). Molecular epidemiology of the human glutathi-one S-transferase genotypes GSTM1 and GSTT1 in cancer suscep-tibility. Cancer Epidemiology, Biomarkers andPrevention, 6: 733-743.
8. Webb G, Vaska V, Coogan M & Board P (1996). Chromosomal localization of the gene for the human theta class glutathione trans-ferase (GSTT1). Genomics, 33: 121-123.
9. Coogan M, Whitbread L, Whittington A & Board P (1998). Structure and organization of the human theta-class glutathione S-transferase and D-dopachrome tautomerase gene complex. Biochemical Jour-nal, 334: 617-623.
10. Engel LS, Taioli E, Pfeiffer R et al. (2002). Pooled analysis and meta-analysis of glutathione S-transferase M1 and bladder cancer: a HuGE review. American Journal of Epidemiology, 156: 95-109. 11. Geisler AS & Olshan AF (2001). GSTM1, GSTT1, and the risk of
squamous cell carcinoma of the head and neck: a mini-HuGE re-view. American Journal of Epidemiology, 154: 95-105.
12. Reszka E & Wasowicz W (2001). Significance of genetic polymor-phisms in glutathione S-transferase multigene family and lung can-cer risk. International Journal of Occupational Medicine and Envi-ronmental Health, 14: 99-113.
13. Knudsen LA, Loft SH & Autrup H (2001). Risk assessment: the importance of genetic polymorphisms in man. Mutation Research, 483: 83-88.
14. Cotton SC, Sharp L, Little J & Brockton N (2000). Glutathione S-transferase polymorphisms and colorectal cancer: a HuGE review. American Journal of Epidemiology, 151: 7-32.
15. Teixeira JP, Gaspar J, Martinho G, Silva S, Rodrigues S, Mayan O, Martin E, Farmer PB & Rueff J (2002). Aromatic DNA adduct levels in coke oven workers: correlation with polymorphisms in genes GSTP1, GSTM1, GSTT1 and CYPA1. Mutation Research, 517: 147-155.
16. Lee J, Kang D, Lee KH et al. (2002). Influence of GSTM1 genotype on association between aromatic DNA adducts and urinary PAH me-tabolites in incineration workers. Mutation Research, 514: 213-221. 17. Kuljukka-Rabb T, Nylund L, Vaaranrinta R, Savela K, Mutanen P,
Veidebaum T, Sorsa M, Rannug A & Peltonen K (2002). The effect of relevant genotypes on PAH exposure-related biomarkers. Journal of Exposure Analysis and Environmental Epidemiology, 12: 81-91. 18. Zhang J, Ichiba M, Hara K, Zhang S, Hanaoka T, Pan G, Yamano Y,
Takahashi K & Tomokuni K (2001). Urinary 1-hydroxypyrene in coke oven workers relative to exposure, alcohol consumption, and meta-bolic enzymes. Occupational and Environmental Medicine, 58: 716-721.
19. Garte S, Gaspari L & Alexandrie AK (2001). Metabolic gene polymor-phism frequencies in control populations. Cancer Epidemiology, Biomarkers and Prevention, 10: 1239-1248.
20. Roy B, Majumder PP, Dey B, Chakraborty M, Banerjee S, Roy M, Mukherjee N & Sil SK (2001). Ethnic differences in distributions of GSTM1 and GSTT1 homozygous “null” genotypes in India. Human Biology, 73: 443-450.
21. Gaspar PA, Hutz MH, Salzano FM, Hill K, Hurtado AM, Petzl-Erler ML, Tsuneto LT & Weimer TA (2002). Polymorphisms of CYP1A1,
CYP2E1, GSTM1, GSTT1, and TP53 genes in Amerindians. Ameri-can Journal of Physical Anthropology, 119: 249-256.
22. Skidmore TE (1992). Fact and myth: discovering a racial problem in Brazil. In: Domingo C (Editor), Working Paper Series, The Helen Kellogg Institute for International Studies. University of Notre Dame, Notre Dame, IN, USA.
23. Telles EE (1994). Industrialization and racial inequality in employ-ment: the Brazilian example. American Sociological Review, 59: 46-63.
24. Instituto Brasileiro de Geografia e Estatística (2002). Year 2000 Census Data. E-mail: www.ibge.gov.br
25. Miller SA, Dykes DD & Polesky HF (1988). A simple salting-out procedure for extracting DNA from human nucleated cells. Nucleic Acids Research, 16: 1215.
26. Abdel-Rahman SZ, El-Zein RA, Anwar WA & Au WW (1996). A multiplex PCR procedure for polymorphic analysis of GSTM1 and GSTT1 genes in population studies. Cancer Letters, 107: 229-233. 27. Bell DA, Taylor JA, Paulson DF, Robertson CN, Mohler JL & Lucier
GW (1993). Genetic risk and carcinogen exposure: a common inher-ited defect of the carcinogen metabolism gene glutathione S-trans-ferase M1 (GSTM1) that increases susceptibility to bladder cancer. Journal of theNational Cancer Institute, 85: 1159-1164.
28. Lin HJ, Han CY, Bernstein DA, Hsiao W, Lin BK & Hardy S (1994). Ethnic distribution of the glutathione S-transferase mu 1-1 (GSTM1) null genotype in 1473 individuals and application to bladder cancer susceptibility. Carcinogenesis, 15: 1077-1081.
29. Nelson HH, Wiencke JK, Christiani DC, Cheng TJ, Zuo ZF, Schwartz BS, Lee BK, Spitz MR, Wang M & Xu X (1995). Ethnic differences in the prevalence of the homozygous deleted genotype of glutathione S-transferase theta. Carcinogenesis, 16: 1243-1245.
30. Ford JG, Li Y, O’Sullivan MM, Demoupoulos R, Garte S, Taioli E & Brandt-Rauf PW (2000). Glutathione S-transferase M1 polymor-phism and lung cancer risk in African-Americans. Carcinogenesis, 21: 1971-1975.
31. Moreira A, Martins G & Monteiro MJ (1996). Glutathione S-trans-ferase mu polymorphism and susceptibility to lung cancer in Portu-guese population. Teratogenesis, Carcinogenesis and Mutagenesis, 16: 269-274.
32. Arruda VR, Grignolli CE, Gonçalves MS, Soares MC, Menezes R, Saad ST & Costa FF (1998). Prevalence of homozygosity for the deleted alleles of glutathione S-transferase mu (GSTM1) and theta (GSTT1) among distinct ethnic groups from Brazil: relevance to environmental carcinogenesis? Clinical Genetics, 54: 210-214. 33. Hatagima A, Klautau-Guimarães MZ, Silva FP & Cabello PH (2000).
Glutathione S-transferase M1 (GSTM1) polymorphism in two Brazil-ian populations. Genetics and Molecular Biology, 23: 709-713. 34. Gattás GJF & Soares-Vieira JA (2000). Cytochrome P450-2E1 and
glutathione S-transferase mu polymorphisms among whites and mulattos from Brazil. Occupational Medicine, 50: 508-511. 35. Krieger H, Morton NE, Mi MP, Azevedo E, Freire-Maia A & Yasuda N
(1965). Racial admixture in Northeastern Brazil. Annals of Human Genetics, 19: 113-125.
36. Florentino M (1997). Em Costas Negras: Uma História do Tráfico de Escravos Entre a África e o Rio de Janeiro. Companhia das Letras, São Paulo, SP, Brazil.
37. Telles EE & Lim N (1998). Does it matter who answers the race question? Racial classification and income inequality in Brazil. De-mography, 35: 465-474.