SUMMARY
Objective: To present the experience of a health plan operator (Unimed-Manaus) in Manaus, Amazonas, Brazil, with the accreditation of imaging services and the demand induced by the supply of new services (Roemer’s Law). Methods: his is a retrospective work studying a time series covering the period from January 1998 to June 2004, in which the computed tomography and the magnetic resonance imaging services were im-plemented as part of the services ofered by that health plan operator. Statistical analysis consisted of a descriptive and an inferential part, with the latter using a mean parametric test (Student T-test and ANOVA) and the Pearson correlation test. A 5% alpha and a 95% conidence interval were adopted. Results: At Unimed-Manaus, the supply of new imaging services, by itself, was identiied as capable of generating an increased service demand, thus characterizing the phenomenon described by Roemer. Conclusion: he results underscore the need to be aware of the fact that the supply of new health services could bring about their increased use without a real demand.
Keywords: Financing in health; diagnostic imaging; need and demand of health services.
From Medicine School, Universidade Federal do Amazonas, Manaus, Amazonas, Brazil, and Ph.D Research in Bioethics, Universidade do Porto, Portugal
Submitted on: 12/21/2010
Approved on: 01/28/2011
Correspondence to:
Edson de Oliveira Andrade Rua Paraíba, Conj. Abílio Nery,
Quadra H, Casa 2 Adrianópolis Manaus – AM Phone: + 55 92 8429 3579 [email protected]
Conlicts of interest: None.
Case study of supply induced demand: the case of provision of
imaging scans (computed tomography and magnetic resonance) at
Unimed-Manaus
EDSONDE OLIVEIRA ANDRADE1, ELIZABETH NOGUEIRADE ANDRADE2, JOSÉ HIRAN GALLO3
INTRODUCTION
Health is a natural human desire, although facilitator so-cial mechanisms to pursue it are not available to everyo-ne. Brazilian Federal Constitution, promulgated in 1988, is very clear in recognizing this human disposition when, under the Social Order Heading, declares as follows:
Art. 196 – Health is everyone’s right and a duty of the State, assured by social and economic policies aiming at re-duced disease and other injury risk and by universal and egalitarian access to actions and services for promoting it, protecting it, and restoring it.
Brazilian health system organization operates through
Sistema Único de Saúde (SUS) [Single Health System]. his model includes delivering both a public and a supplemen-tary system. he supplemensupplemen-tary system is responsible for
about 40-million-people care and is regulated by the
Agên-cia Nacional de Saúde Suplementar (ANS) [National Sup-plementary Health Agency], while health care is directly provided by the State to 160 million Brazilians.
As the constitutional text makes clear, the Brazilian State should have appropriate and suicient social and economic policies so that legislators rulings are fulilled. Public economic policies are understood not only as i-nancial resources allocated to health, but also as a policy for rationally using these resources. he balance between inlow and outlow is one of the touchstones of the compe-tent health management.
his study aims at studying a small aspect of health resource use — supply induced demand — whose obser-vation was inspired by Roemer’s pioneering work that, by studying hospital bed availability in a county in New York State in the 50’s, detected that increased bed supply crea-ted full occupancy not warrancrea-ted by a restrained demand.
Supply was stimulating demand1.
he importance of studying health economics, a des-cription of factors interfering with supply and demand in health care, an exposition about national regulatory guide-lines for health care, and presentation of the case addres-sing imaging services at the Medical Work Cooperative Unimed-Manaus will be briely reviewed below in order to contextualize and systematize the study.
ECONOMICS ANDHEALTH
he current economic status of health care system is scar-city of resources and/or their waste, no incentives for the several players involved, incorporation of new health care technology with no deined criteria, and a great variability
in using inputs and medical procedures2. hus, it is very
important to understand the various factors in this equa-tion called health care.
Although necessary, the relationship between health care professionals, economists, and other management professionals has not been too peaceful, citing Del Nero as an example stating in his introductory article on the
sub-ject: “Economics has a very tough interaction with health care professions. Many reasons arise from the diferent ways each one of them considers health care.Traditionally, health care professionals focus on individualistic ethics, according to which health is priceless and any efort is jus-tiied to save a life. On the other hand, economics is settled
on common good or social ethics”3.
his unnecessary conlict has hindered the interac-tion of two sectors not working independently. here is no possibility of achieving a good health care without a good medical care – not underestimating the other pro-fessionals providing health care – committed to the best care for the patients and an accountable management concerned about following up the care required by the physician as a result from either individual or collecti-ve patients’ needs. Centrally to the management of this dilemma are inancial resources (funding), their applica-tion (cost), and results of their use.
Upon analyzing those components, several methodo-logies are employed, all of them aiming to evaluate the relationship between what has been spent and what has been gained. Some of such strategies are:
a) cost-efectiveness analysis, the most used in lite-rature, measures the cost in monetary units divided by a non-monetary unit called natural unit, e.g. survival years ater a certain health intervention;
b) cost-beneit analysis, the cost is divided by the be-neit monetary value, which lends methodological com-plexity, as monetary value is to be assigned to life;
c) cost-minimization analysis, comparing the treat-ment cost alternatives, on the premise the inal medical efect is equivalent; its purpose is identifying the least costly way of reaching the desired endpoint;
d) cost-utility analysis is a special way to analyze cost-efectiveness, in which the cost per utility unit (unit related to the individual well-being) is calculated. he most commonly used unit is termed Quality-Adjusted
Life Years (QALY)2.
FACTORSINTERFERINGWITHHEALTHSERVICEDEMANDAND
SUPPLY
In December 1963, Kenneth Arrow published an
arti-cle4, “Uncertainty and the Welfare Economics of Medical
Care”, which would become a classic in health economics
literature, including a fac-simile recent edition by the
World Health Organization4. In his study, Arrow lists a
the product health care from other commodities; d) con-ditions of market supply, where a regulated professional market prevents the free access to new service providers, thus elevating the service cost; e) pricing policy with unusual pricing practices and high variability.
Several factors were found to afect the quantity of a good or a service people intend to use. hese determi-nants can also be classiied in a more simpliied way into the following groups: a) considering what has been pre-viously exposed, it becomes clear that the structure of consumer preferences is one of the main determinants of a good or a service demand; b) the perceived quality of a product or service; c) the good or service price; d) the price of other products or services; e) the consumer
avai-lable income5.
Other important aspects also inluence health service use. One of them is the psychosocial aspect. Working wo-men, as an example, experience more acute and chronic
morbidities than housewives6.
he fact that Brazilian Law provides unlimited access to health services (in the private system a few residual
restrictions remain) has stimulated its use7. In the
priva-te sector, there is recurrent communication of syspriva-tem’s non-rational use with frequent reports of patients un-dergoing laboratory tests, but never coming to get their
results8.
Technological progress generates both supply and
de-mand7. It is a real double-edged sword. It provides
unde-niable gains for individuals, but, on the other hand, it is a source of growing cost. he physician is pressed to use it and the patient insists on its use, as he/she is motivated by an aggressive advertisement selling technology as the
most important part of health care9.
Increasing lawsuits against physicians have led many professionals to adopt defensive behaviors, among which is the overuse of diagnostic resources with the justification of “better safe than sorry”, thus avoiding, future liability and eventual convictions for neglect or
malpractice10.
In a consumerist world, if there is supply, there will be demand, even though this consumption not always me-ans a real health service need, since health care necessity
should be distinguished from health care use11.
herefore, the demand concept oten clashes directly against the need concept. While the former focuses the consumers’ freedom to choose according to their own preference frame, the need concept is an exogenous de-inition by an expert. hus, we will be facing a need to consume health care when an individual is ill or disabled and knows there is a treatment or cure for his condition, while health care use is shown when an individual consi-ders he requires and desires to receive a treatment.
As one can see, dynamics of health service use is too complex and has numerous variables, being some of
them concurrent and others antagonistic, generating a problem to solve equation that requires a lot of efort to be understood, but a better health care will be derived from this understanding.
Given these facts, this work aims at inding supply induced demand (Roomer’s Law) occurring at imaging (Computed Tomography and Magnetic Resonance) ser-vices accredited by Unimed-Manaus from January 1998 to June 2004.
METHODS
Study outline: his a retrospective study covering the pe-riod from January 1998 to June 2004, a time when com-puted tomography and magnetic resonance services were implemented as facilities supplied by that health care plan.
Data base: Data were collected from de health plan data base (SIAMED), organized into a statistical sotware spreadsheet SPSS (version 15), and underwent statistical analysis.
Data processing: Aiming at the study objectives, the data were descriptively organized in the irst instance, lis-ting information resullis-ting from types of scans performed sites where they were carried out and the system user popu-lation. An adjustment of the number of scans monthly per-formed to the user population in the corresponding month was made to evaluate appropriately the efect of supply on demand. For that, ive indexes were created, namely:
a) Utilization index (UI), consisting of the ratio of the monthly number of scans to the number of users in the corresponding month;
b) Monthly user variation index (USVI), consisting of monthly variation of system users;
c) Monthly utilization variation index (UTVI), con-sisting of the monthly variation of scan utilization by the system;
d) Variation ratios (VR), consisting of the USVI to UTVI ratio;
e) Monthly demand incremental index (MDII), cal-culated as a percentage based on the irst UI calcal-culated.
he statistical analysis consisted of a descriptive part and an inferential part, the latter using mean parametric tests (Student’s T test and ANOVA) and Pearson correla-tion. A 5% alpha and a 95% conidence interval (CI) were adopted to determine the statistical signiicance level.
RESULTS
he results will be described independently, i.e., the data on computed tomography and magnetic resonance will be shown separately, as the two kinds of scans have diferent delivery periods.
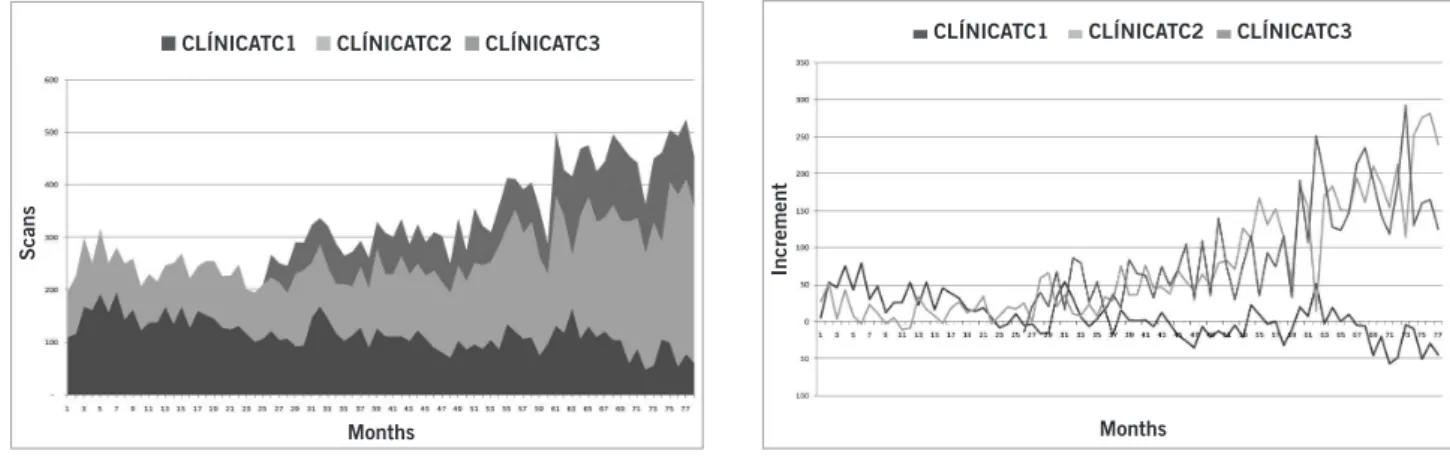
popu-Figure 1 – Computed tomography consumption at Unimed-Manaus per provider unit from January 1998 to June 2004.
Months
CLÍNICATC1 CLÍNICATC2 CLÍNICATC3
Scans
Figure 2 – Computed tomography incremental use at
Unimed-Manaus per service provider from January 1998 to June 2004.
Months
CLÍNICATC1 CLÍNICATC2 CLÍNICATC3
Increment
lation estimated by Instituto Brasileiro de Geograia e
Es-tatística [Brazilian Geographical and Statistical Institute
- IBGE] was 1,422,905)12. A total of physicians ranging
from 830 to 1,099 professionals provided health care, with a monthly mean of 947 (SD ± 84) physician members hav-ing asset links to the cooperative, that is, they owned the health plan operator.
he study began on January 1st, 1998, when the health
plan starts to record systematically the computed tomog-raphy and magnetic resonance scans ofer. On that occa-sion, the imaging services were performed in several cen-ters. Tomographic scans were performed at CLÍNICATC1 and CLÍNICATC2 and, in February 2000, a new center, CLÍNICATC3, was accredited.
Magnetic resonance scans were initially performed in only one center, CLÍNICARM1, a situation that contin-ued until July 1999, when CLÍNICARM2 was accredited. Only in December 2000 a third center, CLÍNICARM3, was accredited.
According to a personal communication from the cooperative chairpersons at the time of the service im-plantation, accreditations were motivated by the desire to provide a better service to the health plan users, although there was no evidence of restrained demand.
TOMOGRAPHICSCANS
Over the months studied, 25,286 scans were performed, with a monthly mean of 324 scans (SD ± 90). he month with the lowest number of scans performed (195) was December 1999.he month with the highest number of scans performed was May 2004, with 524 scans. Figure 1 shows the monthly number of computed tomography scans performed.
In Figure 1, the temporal series detailing every imag-ing clinic participation is observed. Clearly the computed tomography use curve behaved diferently ater the third clinic was accredited. A new use level is reached, where there is no redistribution of the numbers previously
achieved, but an increment due to the new service pro-vided, also resulting from an increasing yield in a clinic already running (CLÍNICATC1). his is the irst evidence of the supply induced demand phenomenon.
he possibility of increased use occurring from an in-crement in the number of system users, with this hypoth-esis possibly explaining the scan use behavior, is not con-irmed by the study data. he UI-CT analysis shows such a situation did not occur. If the increased number of scans had occurred because of an increases user population, the UI-CT should remain stable or it could even be reduced. In fact, a trend to increased CT was observed. he UI-CT in the period ranged from 1.39 to 3.21, with a mean value of 2.26 and SD ± 0.41.
Another important inding conirming the user num-ber did not inluence the increased demand is the lack of correlation between the monthly user variation (USVI-CT) and utilization (UTVI-(USVI-CT). When the Pearson cor-relation is assessed between those variables, no association is found (p > 0.05).
he possibility of randomness in the occurrence of in-creased demand was discarded as the UI-CT was assessed in two groups. he irst composite includes values before CLÍNICATC3 input was considered and the second com-posite already includes this clinic contribution. he Stu-dent’s T test showed a statistically signiicant diference between the two groups (p < 0.001).
Perceivably, the increased use of tomography scan ob-served is not a result from possible increased demand aris-ing from a higher user number, but rather from the avail-ability of one more service.
Next, complementing this line of thinking, Figure 2 shows the MDII-CT, indirectly demonstrating the estimat-ed economic impact entailestimat-ed by the scan use (increment).
Figure 3 – Numbers of magnetic resonances performed at Unimed-Manaus per provider unit from January 1998 to June 2004.
Months
CLÍNICARM1 CLÍNICARM2 CLÍNICARM3
Scans
Figure 4 – Magnetic resonance incremental use at Unimed-Manaus per service providers from January 1998 to June 2004.
Increment
Months
CLÍNICARM1 CLÍNICARM2 CLÍNICARM3
having an ascending MDII-CT, following the MDII-CT curve slope of the new clinic (CLÍNICATC3). his made the general MDII-CT reach a 300% increment based on the early 1998 values.
his data can show the supply induced demand phe-nomenon, described by Roomer, occurring at Unimed-Manaus concerning computed tomography scans. How-ever, the magnetic resonance data analysis makes this situation even more evident.
MAGNETICRESONANCE
Figure 3 shows the growing use of magnetic resonance wi-thin the study period. In contrast with the CT scans sup-ply, it is possible to observe the impact of new provisions in two speciic moments of magnetic resonance use, since initially there was only one clinic providing the service, with two new clinics providing the same service later, but in diferent moments.
It is evident from Figure 3 that each new service did not split the previously available market, but added a new demand.
Adjusting for the system user population at that time (UI-MR), we found that the increased scan use occurs
positively. As it was seen regarding computed tomography, the VR-MR and the correlation between USVI-MR and UTVI-RM shows dissociation between the scan use and the number of users (p > 0.05).
he statistical analysis by ANOVA shows the CLÍNI-CARM3 admittance into the system completely changes the scan use proile (p < 0.001), making CLÍNICARM2 change the yield proile, as Figure 4 shows, with the month-ly demand incremental proile (DMII-MR) per clinic.
DISCUSSIONANDCONCLUSIONS
As discussed above, many factors interfere with supply and demand of health services. In this study speciic case, cle-arly the new service supply must be preceded by correct study on the real need of supply enlargement. Otherwi-se, a system cost elevation could occur, resulting from the supply induced demand alone. his situation will be even more serious if the deliver is associated with adver-tising campaigns or if the media is drawing attention to the technological progress that might be associated with the new service provided. he aggravating factor is this increased outlow not always means a better health care, which would be better assessed by taking into account the
eicacy and the efectiveness of the provided services13.
In this speciic case, the current study could identify a supply induced demand phenomenon (Roemer’s Law) oc-curring from the retrospective review of imaging service data (computed tomography and magnetic resonance) from the Medical Work Cooperative Unimed-Manaus health care plan. his became more evident for magnetic resonance scans, as the services were delivered more deinitely in three discrete moments, providing a clearer identiication of each clinic contribution to the study phenomenon.
Whether in public or private level, the appropriate incorporation of new technology is a great challenge in health resources managing in the present days. Currently, Manaus has 15 computed tomography scanners and four magnetic resonance scanners. his fact, apart from con-stituting a huge capital, is also, as this study quantitatively demonstrated, an encouragement to consumption, bring-ing with it potentially enormous expenses that will cer-tainly afect substantially the already limited and sparing health resources.
New services might be very important to cover a population health care correctly, but their incorporation with no previous need study causes a potential managing destabilization and instead of providing eiciency gains, they turn into factors creating elevated cost and inancial unbalance.
REFERENCES
1. Roemer MI. Bed supply and hospital utilization: a natural experi-ment. Hospitals 196135:36-42.
2. Vianna D, Mesquita ET. Economia da saúde:ferramenta para a toma-da de decisão em Medicina. Revista toma-da SOCERJ 2003;16(4):258-61. 3. Del Nero CR. O que é economia da saúde. In: Piola SFVSM, editor.
Economia da saúde. Conceito e contribuição para a gestão da saúde. Rio de Janeiro: IPEA; 1995. p.5-23.
4. Arrow KJ. Uncertainty and the welfare economics of medical care. 1963. Bull World Health Organ. 2004;82:141-9.
5. Iunes RF. Demanda e demanda em saúde. In: Piola SFVSM, editor. Economia da saúde: conceito e contribuição para a gestão da saúde. Brasília (DF): IPEA; 1995. p.99-121.
6. Gomes KR, Tanaka AC. Morbidade referida e uso dos serviços de saúde por mulheres trabalhadoras, Município de São Paulo. Rev Saúde Pública 2003;37(1):75-82.
7. Zucchi P, Del Nero CR, Malik AM. Gastos em saúde: os fatores que agem na demanda e na oferta dos serviços. Saúde Sociedade 2000;9(1/2):127-50.
8. Magalhães P. Utilização de exames complementares na Unimed-Manaus. 1993.
9. Barros JAC. Propagandas de medicamentos: atentado à saúde?. São Paulo: HAUCITEC-SOBRAVIME; 1995.
10. Porter ME, Teisberg EO. Política de assistência à saúde e competição baseada em Valor. Repensando a saúde. Porto Alegre: Bookman; 2007. p.275-319.
11. William A. Need-an economic exegesis. In: Culyer AJKW, editor. Eco-nomic aspects of health services. London: Martin Robertson; 1978. 12. Instituto Brasileiro de Geograia e Estatística. IBGE. [citado 19 mar
2008]. Disponível em: http://www.ibge.gov.br/home/2008. 13. Nunes R, Rego G. Eicácia e eiciência dos serviços de saúde.