ABSTRACT: The present study aims at describing the sampling plan, operational aspects and strategies used to optimize the ield work of a cross-sectional, population-based study conducted in a southern capital of Brazil. For this purpose, the sample design, data collection instrument, selection of interviewers, pilot study, data collection, ield logistics, quality control, consistency control, costs, and divulgation of results are herein described. The study’s response rate was 85.3%. We found that the comparison of frequency measurements with and without self-assessment had no signiicant impact on the estimates, and that the design efect, estimated at 2, was suicient for most calculations. The reproducibility of the questionnaire was satisfactory, with Kappa values and intraclass correlation coeicients ranging from 0.6 to 0.9. The strategies used to overcome operational problems, such as counting of households, use of maps, questionnaire structuring, rigorous organization of the ield work and monitoring of the estimates were fundamental in conducting the study.
Keywords: Cross-sectional studies. Health surveys. Data collection. Cluster sampling.
EpiFloripa Health Survey: the methodological
and operational aspects behind the scenes
Inquérito de saúde EpiFloripa: aspectos metodológicos
e operacionais dos bastidores
Alexandra Crispim BoingI, Karen Glazer PeresI, Antonio Fernando BoingI, Pedro C HallalII, Nilza Nunes SilvaIII, Marco Aurélio PeresI
IPrograma de Pós-graduação em Saúde Coletiva, Departamento de Saúde Pública, Centro de Ciências da Saúde da Universidade
Federal de Santa Catarina – Florianópolis (SC), Brasil.
IIPrograma de Pós-graduação em Epidemiologia, Departamento de Medicina Social, Faculdade de Medicina da Universidade
Federal de Pelotas; Programas de Pós-graduação em Educação Física, Universidade Federal de Pelotas – Pelotas (RS), Brasil.
IIIDepartamento de Epidemiologia da Faculdade de Saúde Pública, Universidade de São Paulo – São Paulo (SP), Brasil.
Corresponding author: Alexandra Crispim Boing. Universidade Federal de Santa Catarina, Centro de Ciências da Saúde. Campus Universitário, Trindade, CEP: 88034-500, Florianopolis, SC, Brasil. E-mail: [email protected]
Conlict of interests:nothing to declare – Financial support: Conselho Nacional de Desenvolvimento Cientíico e Tecnológico
(CNPq), Edital Universal 15/2007 (projeto No 485327/2007-4)..
Boing, A.C. et Al.
IntroductIon
The knowledge of the magnitude and distribution of illnesses and health-related events is indispensable to properly plan health actions and deine public policies that aim at improving the life quality of the populations. In the sphere of health, diagnoses and surveillance can be conducted based on data stored in oicial Health Information Systems (HIS) or by consulting primary data collected by means of population surveys1. Despite the innumerable advantages of HIS, such as a broad coverage of vital statistics and hospitalizations, there are important limitations to this system, such as the under-registering of data and the limited amount of collected information. For this reason, cross-sectional population studies have a great importance for health-related data collection and systematization.
In Latin America, the boost given to population-based studies occurred through the so-called Atlantis Plan, sanctioned by the United Nations Organization (UNO) and directed towards countries devoid of socioeconomic data of quality or without any data at all2,3. Brazil’s adhesion to this plan happened in 1967, which led to the creation of the National Survey by Household Samples (Pesquisa Nacional por Amostras de Domicílios – PNAD)4. Over the years, other population-based surveys were developed in the country, such as the National Study of Family Expenditures (Estudo Nacional da Despesa Familiar – ENDEF)5 and the Family Income Survey (Pesquisa de Orçamentos Familiares – POF)6. Moreover, health-related population surveys began to be carried out in the country, such as the supplement about the health of the Brazilian population, conducted for the irst time during the PNAD of 19817, the World Health Survey (WHS)8, the telephone inquiry on
ReSUMO: O estudo objetiva descrever o plano amostral, aspectos operacionais e estratégias utilizadas para otimizar o trabalho de campo de um estudo transversal de base populacional desenvolvido em uma capital do sul do Brasil. Para tal, foram descritos plano amostral, instrumento de coleta, seleção de entrevistadoras, estudo piloto, coleta de dados e logística de campo, controle de qualidade, controle de consistência, custos e divulgação dos resultados. A taxa de resposta do estudo foi de 85,3%. Foi veriicado que a comparação de medidas de frequência com e sem ponderação não teve impacto importante nas estimativas e que o efeito de delineamento, estimado em 2, foi suiciente para a maior parte dos cálculos. A reprodutibilidade do questionário foi satisfatória, com valores de Kappa e coeiciente de correlação intraclasse variando entre 0,6 a 0,9. As estratégias utilizadas para transpor problemas operacionais, como contagem dos domicílios, uso de mapas, estruturação do questionário, organização rigorosa do campo e acompanhamento das estimativas foram fundamentais para a condução do estudo.
Surveillance of Chronic Disease Risk Factors and Protection (Vigilância de Fatores de Risco e Proteção para Doenças Crônicas por Inquérito Telefônico – VIGITEL)9, the National Survey on Students’ Health (Pesquisa Nacional de Saúde do Escolar – PeNSE)10, and Oral Health Studies11, among others. Local experiences have also produced important evidence through population inquiries on health, such as the consortia of surveys conducted periodically in Pelotas12, the Health Inquiry in the state of São Paulo (ISA-SP), and the Health Inquiry of Campinas (ISACAMP)13,14.
The publications based on these inquiries concentrate the information collected on the results obtained, rarely or not at all describing the operational aspects and practical challenges of conducting a health survey. The great demand for publications forces periodicals to adopt increasingly restrictive policies pertaining to the length of the articles, which hinders the inclusion of data about the “backstage” of health surveys. Sharing information among researchers is important, as the operational aspects involved in carrying out population-based inquiries often complicate conduction.
The present paper presents, in detail, the methods and operational procedures that are not part of compendiums on the topic. Our purpose is to detail the “backstage” by reporting what happens in the day-to-day conduction of a population-based study. Important questions are addressed here, such as: What is the procedure used to recognize and update the households in selected census tracts? How are ield logistics simulated? What is the size of the team necessary to conduct a survey? What are the advantages and disadvantages of using a handheld computer instead of paper questionnaires? How does one proceed in case of fraud? What is the cost of a survey of this magnitude? How much is paid for each interview conducted?
In the present study, our purpose is to answer these questions, drawing on the methodological and operational aspects of the survey EpiFloripa Adultos, carried out with adults in the capital of the state of Santa Catarina in 2009.
the survey epIFlorIpa 2009
Boing, A.C. et Al.
were linked to this project, namely eight Master’s dissertations, ive doctoral theses, one post-doctorate project, one scientiic initiation project, and two isolated projects. The study was inanced by National Council for Research and Development (CNPq), Edict 15/2007 (project number 485327/2007-4).
methods
Definition of the stuDy population anD sampling
The population was composed of adults (men and women between 20 and 59 years of age) living in the urban region of Florianópolis in 2009. As the survey foresaw estimates of the prevalence of diverse health outcomes, the researchers took into consideration an expected prevalence of 50%, margin of error of 4 percentage points and 95%CI when calculating sample size, which resulted in a sample of 599 adults. To the inal calculation were added a design efect (def) of 2, as well as 10 and 20% to correct the absence of answers so as to control points of confusion. The minimum amount of interviews considered was 1,613 – keeping in mind that the expected response rate was 80% and that the variation coeicient would supposedly not surpass 11% for the estimates of prevalence17.
sample selection
The sampling process was conducted by clusters in two stages18. Firstly, the census tracts were deined by means of a random draw and formed Primary Sampling Units (PSU). Next, the households to be visited within the tracts were randomly drawn. All individuals between 20 and 59 years of age residing in the households drawn were eligible. In Brazil, the use of census tracts as PSUs is convenient, as this method encompasses the entire population and territory studied, is sized for sample-like purposes, has clear and well-deined territorial limits, provides representative data concerning the internal population, and is also convenient due to the large amount of PSUs. These items are important to ensure the quality of a PSU during a survey, but only when the latter is up-to-date (by means of demographic census or recent intercensal countings)17.
conduction of 20 interviews per census tract18. We also considered the necessity of randomly drawing two of the special tracts. This technique forecasts possible ield problems, such as, for instance, the impossibility of collecting data in a unit formed by a single residential condominium where the residents refuse to speak with the interviewers or due to threats to the safety of the ield team. If the possibility of having to replace tracts is not forecasted, a new draw must be subsequently conducted to select the substitute tracts, albeit with a diferent probability of being included in the sample.
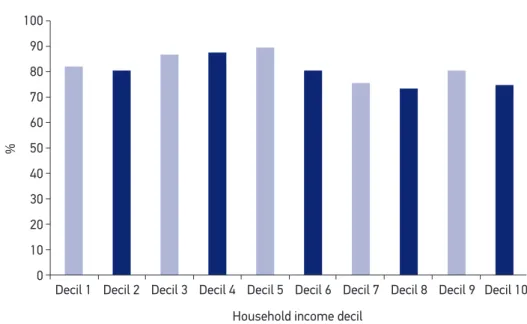
The random draw of the 60 tracts was systematic, with an interval = 7 (420/60). Thus, the probability of a census tract being included in the sample in the irst stage was calculated by f1 = 1/7, and six tracts were selected from each income decil. The spatial distribution of this sample is displayed on Figure 2. Selecting a sample by clusters is a feasible alternative to simple random sampling. In the latter case, choosing the individuals who composed the sample by random draw would be possible by having a list with all the households in the city. However, a list with the necessary quality does not exist in the majority of places. Moreover, the operational costs to carry out this sampling plan would make it very diicult to conduct surveys, whereas the cost tends to be lower in sampling by clusters. The disadvantage of studies by clusters lies in the loss of precision, since, in relation to the outcomes assessed by the survey, the households within a given tract tend to be more similar to one another than when compared to those in other tracts. The increase in estimate variance composes the sample’s design efect (def), which must be considered when calculating the sample’s size.
100
90
80
70
60
50
%
40
30
20
10
0
Decil 1 Decil 2 Decil 3 Decil 4 Decil 5 Decil 6 Decil 7 Decil 8 Decil 9 Decil 10
Household income decil
BoinG, a.C. eT al.
upDating the census tracts
Once the tracts to be visited were dei ned, it was necessary to obtain the list of households that composed them. Such list is updated every 10 years by the IBGE for the national census. In case a survey is conducted in the years that immediately follow the census, the updated list will be extremely useful, and it can be easily obtained from the institute. As the EpiFloripa was carried out in 2009, the available lists were already outdated (year 2000), and it was necessary, then, to update the locations and the quantity of households in each tract. In regions of great urban mobility and territorial occupation, it is important to update the amount of households even in years after the census. To carry out the procedure of “beating the tract”, that is, to update the households in each unit, we had to resort to the IBGE in order to obtain the maps that marked the borders of the census tracts. These maps
are made available online by the IBGE (ftp://geoftp.ibge.gov.br/mapas/malhas_digitais/ setor_urbano_2000/). The recognition and updating of the households in the tracts was performed by ield supervisors. In addition to the maps provided by the IBGE, the supervisors used (1) maps obtained with Google Maps and (2) satellite images from Google Earth to conduct this operation. Knowing the census tracts beforehand enabled us to evaluate the characteristics of each tract and to seek partnerships when a given region was considered risky to the team’s safety. The main partnerships occurred with the Local Health Units and Family Health Strategy teams of the Municipal Health Department in Florianópolis. The ield supervisors who recognized the tracts had to employ certain stratagems to obtain the correct counting, such as verifying the amount of light meters in the property, as well as talking to neighbors and property owners.
It is necessary to highlight that, before going into the ield, the deinition of “household” is important. In the case of the EpiFloripa, the deinition chosen was taken from the IBGE: “a structurally separate and independent location used as the dwelling of one or more persons”19. The total number of urban permanent private households (UPPH) was updated in each census tract, which takes ive hours on average — varying from three to nine hours — depending on the size and territorial complexity of the census tract in question. At the end of the recognition of the 60 census tracts, 16,775 occupied UPPHs were identiied. It was possible to verify the importance of updating each tract upon inding that the number of households varied from 61 to 840 (approximate average of 266 households per tract and variation coeicient of 55%), an interval distant from the IBGE’s deinition of census tract (between 300 and 350). In order to minimize this marked variation — detrimental to sampling estimates — the tracts with a reduced number of households were combined, and others with an excessive amount of households were dismembered. This procedure, extremely interesting if the purpose is to keep census tracts with similar sizes, was performed taking into consideration their contiguity, geographical location, and socioeconomic similarities. In this manner, we obtained 63 primary operational units, and the variation coeicient of the number of households was reduced to 32%, still above the recommended igure of 20%18 but considered acceptable for ield work.
Boing, A.C. et Al.
(comparisons of proportions, standard error, conidence intervals, and design efect of the estimates). It is important that all studies present, along with the results, the inal sampling plan.
It is important to highlight that it was not necessary to utilize any procedures to eliminate information dependence, as less than two individuals on average were interviewed per household. For this reason, dependence in this case was considered insigniicant18.
instrument useD for Data collection
The data collection instrument was devised in a partnership between graduate students and researchers linked to the project. The selection and formulation of the questions occurred during weekly meetings over four months. In the case of questions from other surveys as well as doubts and questions presented by the group, the authors of the questions and/or instruments were contacted. When dealing with validated instruments, the latter were used according to their respective application manuals. Initially, with the purpose of addressing all research interests, the questionnaire contained over 300 questions. It started with general questions, alternated with anthropometric measurements, and relegated the more delicate questions (for instance, domestic violence) to the end. The first structure proposal was reformulated and, after discussion, the questionnaire was tested by the students on an intentional sample of two adults per student, resulting in 32 adults interviewed. In this test, we sought to interview individuals from different socioeconomic levels, assess the time taken to conduct the interview, and the interviewees’ understanding of the questions. The questionnaire was finalized with 233 questions divided in 20 sections. Based on the questionnaire, the “Interviewer’s Manual” was elaborated — with procedures on how to approach the individuals in the field and explanations for each of the 233 questions — and it was used to train the interviewers and as a support in the field. Although lengthy, the questionnaire was well accepted, and the refusals were rare.
the team
Journalism undergraduate, a scientiic initiation student, and an undergraduate student, all on scholarships, were also part of the team.
process of selection of interviewers
The selection process was initiated by the definition of the number of interviewers necessary to interview 2,016 adults in a three-month period (September to November 2009), considering an average of eight weekly interviews per interviewer. Thus, the final number of interviewers was 21. Based on this number, we established some criteria that should be met by the candidates, such as:
1. being female;
2. having finished high school at least;
3. being available to conduct at least two interviews per day;
4. being available to carry out the interviews in the evenings and on weekends;
5. having expression and communication skills;
6. being motivated to perform the activity at hand;
7. participating in the training sessions;
8. being approved on the evaluations conducted during and at the end of the
training sessions.
The job posts were publicized on posters spread on all campuses of Universidade Federal de Santa Catarina (UFSC), in Technical Schools in the area of health in Florianópolis, in places with a high circulation of people in the city, on the website of the Regional Nursing Council of Santa Catarina (COREn/SC), and on the classifieds of one of the city’s most highly circulated newspaper. Furthermore, a list with the names of interviewers who had previously participated in UFSC surveys in the area of health was also used. A pre-selection was carried out with interested candidates, who were interviewed individually. In the pre-selection stage, we took into consideration the aforementioned criteria and selected 30 potential interviewers to participate in the training, a number considered adequate to compose a back-up registry. The subsequent step was the selection per se, with a five-day full-time training that comprised the following contents:
1. presentation of the project;
2. introduction to the theories of the measurements used in the study;
3. measurement training;
4. calibration of the measurements taken by the candidates;
5. presentation on how to approach households and interviewees by IBGE
technicians;
Boing, A.C. et Al.
7. how to handle the handheld device when collecting data;
8. questionnaire reading;
9. simulations and dramatizations of interviews;
10. theoretical test about questions pertinent to the study;
11. pre-test in households (two households per interviewer, supervised by a field coordinator).
After this selection process and training, only seven candidates were selected. There was a high rate of withdrawals and recruiting difficulties, especially due to the candidates’ impossibility to follow the schedule established and test fails. As this number was short of what was planned for data collection, the posters were publicized once again and a new selection process was initiated with the purpose of reaching a total of 21 interviewers in the main team and more back-up interviewers. Thus, new selections, trainings and replacements occurred throughout the entire study.
The interviewers signed a three-month contract that could be renewed due to time extensions needed for data collection (in this case, four months), as well as a loan agreement (which indicated the interviewers’ responsibilities regarding the research materials in their possession), both duly notarized, in accordance with information gathered from consulting the Pro-rector of Research and Extension and the legal attorney of UFSC. This hiring process was conducted so as to offer more security to the interviewers, to the university, and to the researchers in charge.
Data collection
The data collection was carried out by the interviewers using the Personal Digital Assistant (PDA). The PDA is used to collect information digitally, and it has recently been systematically incorporated in surveys conducted by the IBGE. Digital collection brings many advantages to research development, among them:
• immediate judgment of the choices of answers when filling in the questionnaire;
• all mandatory items in the questionnaire must be filled in;
• customized filling-in made possible by automatic question skipping;
• real-time research tracking;
• it dispenses with the transportation of large volumes of paper questionnaires21.
As a disadvantage of using the PDA, observed in the present study, it is possible to mention the difficulty to find professionals to develop data collection using the device within the payment circumstances allowed by the project, and the necessity of 10 hours of practice for the interviewers to familiarize themselves with the equipment.
To program the PDA, we used Python® for Windows Mobile®, a software utilized
participated in test batteries and simulations with the program in order to identify problems in the answers and in the succession of questions. This process with tests and simulations, as well as identification and correction of problems took about two weeks and was fundamental to initiate data collection with the PDAs correctly programmed. Moreover, simulations of data transfering from the PDA files were conducted in the same period. The data were transferred by Windows Mobile® through synchronization and exported as .csv files. Each interview generated one file, followed by a stage of grouping all files in a single database. Once in the field, some problems occurred with the PDAs, such as insufficient battery life and broken device screens. These difficulties were overcome by using printed questionnaires, always at hand in case of eventualities. Even so, the benefits of using PDAs were unquestionable.
Field logistics – Pilot study
A pilot study was carried out in two census tracts that were not part of the sample on the course of two weeks. An average of 15 interviews were conducted by each interviewer. All field simulations were completed and, at the end of the pilot study, we observed that the length of the interviews varied from 45 to 90 minutes; it was longer in the case of female interviewees, as there were specific additional questions directed at them. The average length of time taken to apply the questionnaire was 50 minutes — it varied between 30 and 40 minutes for men, and between 50 to 60 minutes for women. Based on the pilot study, we considered it suitable to provide the interviewers with pre-paid minutes on their mobile phones so as to facilitate contact with the field supervisors. An on-call schedule was devised with specific mobile phone numbers. The purpose was to have a UFSC graduate student answer eventual questions that the field team or the community might have about the study, from Monday to Saturday during business hours. In addition, on the day the interviewers had to hand in the files, once a week, the on-call schedule counted more people: one professor, two on-call students and the executive secretary. The professor on call was in charge of transferring the files, one of the students was responsible for the field material, the other for clarifying any doubts and in case of back-up necessities, and the executive secretary was in charge of paying for the interviews that had already cleared quality control.
publicity strategies
Boing, A.C. et Al.
participants’ adhesion. One week prior to data collection, the field supervisors personally delivered a letter informing about the study, the selection/draw of households, and how the interviewers could be identified. To publicize the survey in the census tracts selected in the draw, we printed colorful posters in which we sought to highlight the importance of the survey and asked the people to receive the interviewers in their households. These posters were distributed in the tracts selected, in locations of high circulation. Moreover, we also publicized the survey through the Communication Agency at UFSC, as well as interviews on radio stations and local newspapers, both in print and on television.
Quality control
Quality control was performed weekly through revising and checking 15% of the interviews, which were selected by random draw in each tract. The key information pieces contained in the questionnaire were veriied over the phone by the ield supervisors, who compared the data obtained during the interview to the answers received over the phone. Four forms with ten questions each were then developed, concerning data that do not vary over a short period of time (from the interviewer’s visit to the checking stage). These forms were utilized randomly during the process of quality control. The purpose of using four diferent sets of questions was to minimize the possibility that the interviewers knew the questions pertaining to quality control. However, in the second month of data collection, we opted for using only one quality control form (with ten questions) in order to have a larger sample when calculating reproducibility. During the quality control process, three fraudulent interviews conducted by the same interviewer were identiied. The procedure followed was to exclude the interview, immediately remove the interviewer in question from the ield, and check all other interviews conducted by her.
consistency control
costs
This research study was financed by CNPq (National Council for Research and Development), Edict 15/2007 (project number 485327/2007-4). It was titled “Health conditions of the adult population of the city of Florianópolis, Santa Catarina: a population-based study”, and it was granted 63,295.32 Brazilian reais (R$). Due to the relatively low amount granted to a study of this proportion, partnerships with the UFSC, the State Health Department, and with another research study carried out in the Graduate Program in Collective Health were necessary. The venue, envelopes, paper, badges, folders, bags, office material, photocopies and telephone were provided by Universidade Federal de Santa Catarina. The State Health Department produced all the manuals and materials used to train the interviewers. Partnering with the other project aided in better negotiations pertaining to the equipment and payment of students on scholarships who worked in both studies at the same time.
The average cost per interview was R$ 36,80 (US$ 21.40), and the average cost of the final work per student (dissertation/thesis/academic papers) was R$ 3.723,25 (US$ 2,164.70). Around 90,0% of the amount granted to the project as a whole was used towards human resources (to pay the interviewers, basically). The cost referring to the payment of successful interviews increased as the survey advanced. Initially, the amount paid per interview was R$ 20,00 (US$ 11.63). We then established weekly goals — for instance, the interviewers who handed in more than 14 interviews per week would receive R$ 21,00 (US$ 12.21) per interview. This strategy had two outcomes: the first one was positive and resulted in an increase in the quantity of interviews handed in per week; and the second was negative, as some interviewers did not show up on the delivery date with the intention of reaching the weekly goal. Thus, the goals were reevaluated each week and delivery delays were not allowed. In the last two months, the payment was raised to R$ 25,00 (US$ 14.53) and R$ 30,00 (US$ 17.44). In the last month, the best four interviewers were selected and returned to the field in the tracts with the lowest response rates; in this case, up to R$ 40,00 (US$ 23.26) were paid per interview. Payments were processed weekly for three reasons:
1. the interviews of a given week were delivered on the same date and were paid only after quality control, that is, in the subsequent week. With this procedure, the chance of encountering problems in the delivery of materials (questionnaire files) is reduced and it did not occur in this study;
2. weekly meetings were held to continuously capacitate the interviewers, control response rates, verify the reasons for refusal and/or losses and provide in-person contact with the field supervisors,
Boing, A.C. et Al.
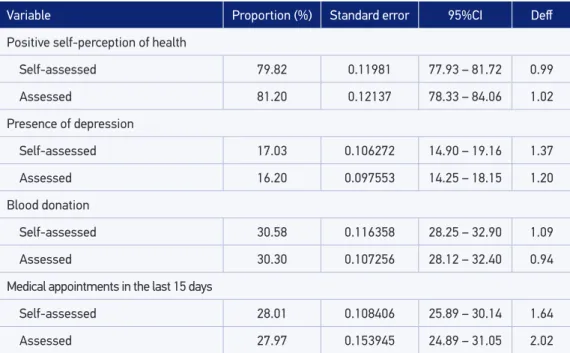
Tabela 1. Estimativas de proporção, erro padrão, intervalo de coniança e efeito de delineamento de algumas variáveis do EpiFloripa (n = 1.720). Florianópolis, 2009.
Variable Proportion (%) Standard error 95%CI Def
Positive self-perception of health
Self-assessed 79.82 0.11981 77.93 – 81.72 0.99
Assessed 81.20 0.12137 78.33 – 84.06 1.02
Presence of depression
Self-assessed 17.03 0.106272 14.90 – 19.16 1.37
Assessed 16.20 0.097553 14.25 – 18.15 1.20
Blood donation
Self-assessed 30.58 0.116358 28.25 – 32.90 1.09
Assessed 30.30 0.107256 28.12 – 32.40 0.94
Medical appointments in the last 15 days
Self-assessed 28.01 0.108406 25.89 – 30.14 1.64
Assessed 27.97 0.153945 24.89 – 31.05 2.02
results
The response rate of this study was 85.3% (1,720 people). Therefore, the minimum number of individuals (1,613) and the precision criteria defined in the planning stage were preserved. We verified similar proportions between age range and sex in the adult population of Florianopólis, obtained through the EpiFloripa survey with IBGE’s estimates for 2009.
The variables that presented a higher percentage of non-response were waist measurement, with 1671 responses and weight, with 1677 responses, followed by blood pressure, with 1679 responses; height, with 1685 responses; and income, with 1685 responses, for a total of 2,1% of non-responses.
reFerences
1. Viacava F. Informações em saúde: a importância dos inquéritos populacionais. Cien Saude Colet. 2002; 7(4): 607-21.
2. Ferrer M. Los módulos de salud en las encuestas de hogares de America Latina y el Caribe: un análisis de cuestionarios recientes. Serie de Informes Técnicos, 72. Washington, D.C: Organización Panamericana de la Salud; 2000. 3. Martine G. O papel dos organismos internacionais na
evolução dos estudos populacionais no Brasil: notas preliminares. Rev Bras Estud Popul 2005; 22(2): 257-75. 4. Instituto Brasileiro de Geograia e Estatística (IBGE).
Manual do operador de campo – Pesquisa Nacional por Amostra de Domicílios. Rio de Janeiro: IBGE; 1967. 5. Monteiro CA, Benicio MHDA, Iunes R, Gouveia
NC, Taddei JAAC, Cardoso MAA. ENDEF e PNSN: para onde caminha o crescimento físico da criança brasileira? Cad Saúde Pública 1993; 9(1): 85-95. 6. Instituto Brasileiro de Geograia e Estatística (IBGE).
Pesquisa de Orçamentos Familiares 2008-2009. Rio de Janeiro: IBGE; 2010.
7. Instituto Brasileiro de Geograia e Estatística (IBGE). Informações gerais sobre a PNAD Disponível em: http://portal.mec.gov.br/index.php?option=com_ content&view=article&id=12521:informacoes-gerais-sobre-a-pnad&catid=190:setec. (Acessado em 10 de fevereiro de 2011).
8. Szwarcwald CL, Viacava F. Pesquisa Mundial de Saúde: aspectos metodológicos e articulação com a Organização Mundial da Saúde. Rev Bras Epidemiol 2008; 11(1): 58-66.
9. Brasil. Ministério da Saúde. Vigitel Brasil 2007: Vigilância de fatores de risco e proteção para doenças crônicas por inquérito telefônico. Brasília: Ministério da Saúde;2008.
10. Instituto Brasileiro de Geograia e Estatística (IBGE). Pesquisa Nacional de Saúde do Escolar. Rio de Janeiro: IBGE; 2009.
11. Roncalli AG. Projeto SB Brasil 2010: elemento estratégico na construção de um modelo de vigilância em saúde bucal. Cad Saúde Pública 2010; 26(3): 428-9. The main results were shared with the survey participants by e-mail and letter. Furthermore, we divulged the results during meetings with the Municipal Health Department, in the research section of a newspaper circulated in the state and in other media with the support of the scientific journalism center at UFSC. The study also has a website (www.epifloripa.ufsc.br) available to researchers and to the community, with all the information about the study as well as the materials developed.
FInal consIderatIons
Boing, A.C. et Al.
12. Barros AJD, Menezes AMB, Santos IS, Assunção MCF, Gigante D, Fassa ACG, et al. O Mestrado do Programa de Pós-graduação em Epidemiologia da UFPel baseado em consórcio de pesquisa: uma experiência inovadora. Rev Bras Epidemiol 2008; 11(1): 133-44.
13. Cesar CLG, Carandina L, Alves MCP, Barros MBA e Goldbaum M. Saúde e condição de vida em São Paulo. Inquérito multicêntrico de saúde no estado de São Paulo – ISA/SP. São Paulo: USP/ FSP; 2005.
14. Campos FG, Barrozo LV, Ruiz T, César CLG, Barros MBA, Carandina L, et al. Distribuição espacial dos idosos de um município de médio porte do interior paulista segundo algumas características sócio-demográficas e de morbidade. Cad Saúde Pública 2009; 25(1): 77-86.
15. Ministério da Saúde. DATASUS. População residente de Santa Catarina. Disponível em: http://tabnet. datasus.gov.br/cgi/tabcgi.exe? ibge/cnv/popsc. def. (Acessado em 10 de fevereiro 2009).
16. Programa das Nações Unidas para o Desenvolvimento (PNUD). Atlas de desenvolvimento humano no Brasil. Brasília: PNUD; 2003.
17. United Nations. Department of Economic and Social Afairs, Statistic Division. Household Sample Surveys in Developing and Transition Countries. New York: United Nations Publications; 2005.
18. Kish L. Survey sampling. New York: John Wiley & Sons; 1965.
19. Instituto Brasileiro de Geograia e Estatística (IBGE). Manual do Recenseador -Censo 2000. Rio de Janeiro: IBGE; 2000. 20. Silva NN. Amostragem probabilística. São Paulo:
EDUSP; 2001.
21. Instituto Brasileiro de Geograia e Estatística (IBGE). Manual operacional do PDA - Censo agropecuário de 2006 / Contagem populacional 2007. Rio de Janeiro: IBGE; 2007.
Received on: 12/10/2012
Final version presented on: 06/23/2013