HEALTH
Health Survey – PeNSE, Brazil
Correspondence:
Deborah Carvalho Malta – Universidade Federal de Minas Gerais, Escola de Enfermagem, Departamento de Enfermagem
Materno-Infantil e Saúde Pública, Av. Alfredo Balena, No. 190, Santa Efigênia, Belo Horizonte-MG, Brasil. CEP: 30130-100
E-mail: [email protected] Abstract
The National Adolescent School-based Health Survey (PeNSE) is a survey conducted with students from public and private schools, performed in a partnership between the Ministry of Health and the Brazilian Institute of Geography and Statistics, with support of the Ministry of Education. PeNSE is part of the Brazilian Surveillance of Risk and Protective Factors for Chronic Diseases. Three editions were held, with triennial periodicity (2009, 2012 and 2015), which included samples composed of 9th grade students. In 2015, a sample of 13 to 17 years old students was added, making PeNSE comparable to international surveys. Throughout the three editions, the sample has increased, in size and scope, and the questionnaire has changed. In addition to the risk and protective factors for chronic diseases, the survey covers other topics, such as sexual behavior and violence. PeNSE provides essential information to support public policies aimed at Brazilian adolescents.
Keywords: Health Surveys; Adolescent; Risk Factors; Chronic Disease; Violence.
doi: 10.5123/S1679-49742017000300017
Max Moura de Oliveira1
Maryane Oliveira Campos2
Marco Antonio Ratzsch de Andreazzi3
Deborah Carvalho Malta4
1Universidade São Paulo, Programa de Pós-Graduação em Saúde Pública, São Paulo-SP, Brasil 2Ministério da Saúde, Secretaria de Vigilância em Saúde, Brasília-DF, Brasil
3Fundação Instituto Brasileiro de Geografia e Estatística, Diretoria de Pesquisas, Rio de Janeiro- RJ, Brasil
Presentation
The National Adolescent School-based Health Survey (PeNSE) is a survey conducted with adolescent students and is part of the Brazilian Surveillance of Risk and Protective Factors for Chronic Diseases. Its first edition was conducted in 2009, and was planned to be held every three years. Since then, there have been two more editions, one in 2012 and another one in 2015.1-3 This
survey is the result of a partnership between the Ministry of Health and the Brazilian Institute of Geography and Statistics (IBGE), with support by the Ministry of Education (MEC). The target-population of PeNSE was first formed by students enrolled in the 9th grade of
Elementary School; in 2015 students enrolled from the 6th grade of Elementary School to the 3rd grade of High
School were also included, with the objective of having a more representative research for students aged from 13 to 17 years old.1-3
According to the 2010 Demographic Census, the population of Brazilian adolescents in that year was of, approximately, 18 million people aged from 10 to 14 years and 17 million aged from 15 to 19 years old.4 Data
of the National Household Sample Survey (PNAD), also conducted by IBGE show that the schooling rate in the country was of 98.2% (2012) and 98.4% (2013) for the population aged from 6 to 14 years, and of 84.2% (2012) and 84.3% (2013) for the age group from 15 to 19 years old, regardless of the family monthly income,5,6 highlighting the potential capacity to monitor
adolescents’ health.
During adolescence, several habits are changed and consolidated. During this period, adolescents go through important biological, cognitive, emotional and social changes. They try new behaviors and experiences, and some of these experiences are risk factors for health, such as smoking, alcohol use, unhealthy diet and physical inactivity, among others.7,8
These risk factors are associated to the development of most chronic non-communicable diseases (NCD),
such as cardiovascular diseases, cancer, respiratory diseases and diabetes, the main causes of death among adults in Brazil and worldwide.9 Understanding how
adolescent students live and behave enables policy makers to measure the magnitude and distribution of important risk factors in health,11-13 producing essential
information to guide public policies.
The World Health Organization (WHO) recommends the implementation and maintenance of surveillance systems for risk factors to health aimed at adolescents. Nowadays, the main surveys of this type are the Global School Based Student Health Survey (GSHS),14 the
Health Behaviour in School-aged Children (HBSC)7
and the Youth Risk Behavior Surveillance System.15 In
Brazil, in 2004, the Brazilian Center of Information on Psychotropic Drugs (CEBRID) conducted a survey on the use of psychotropic drugs by students from the Elementary and High School.16 In 2002 and 2003,
The National Adolescent School-based
Health Survey (PeNSE) is a survey
conducted with adolescent students and
is part of the Brazilian Surveillance of Risk
and Protective Factors for Chronic Diseases.
Summary of the profile of the National Adolescent School-based Health Survey (PeNSE), Brazil, 2009, 2012 and 2015
Content
Health profiles of Brazilian adolescents who attended public or private schools and school characteristics
Years 2009, 2012 and 2015
Coverage
2009, 2012 and 2015: Federal District and Brazilian state capitals
2012 and 2015: Brazil, with representativeness for the macroregions
2015: Brazil, with representativeness for the states
Main variables
Socioeconomic aspects; social and family contexts; factors for non-communicable chronic diseases (tobacco, physical inactivity, unhealthy diet, alcohol use); experimentation and use of drugs; sexual and reproductive health; violence, safety and accidents; perception of body image; use of health services; others.
Limitations
The research represents adolescents who attend schools
The information is referred by the participants, and are subjected to measuring errors It is necessary to be cautious when comparing the results among editions, since there have been changes in the questionnaires and sampling plans
Access links
2009
http://www.ibge.gov.br/home/estatistica/ populacao/pense/default.shtm
2012
http://www.ibge.gov.br/home/estatistica/ populacao/pense/2012/default.shtm
2015
the National Institute of Cancer conducted a survey on Smoking among school adolescents (Vigiescola), covering students enrolled in the 7th and 8th grades of
Elementary School and in the 1st grade oh High School
of public schools from 12 Brazilian state capitals.17 In
2003 and 2007 there were surveys on the surveillance of risk factors for non-communicable diseases among adolescent students of public schools in the municipality of Rio de Janeiro.18
PeNSE was developed with the aim of filling the gaps on the knowledge about the health situation of Brazilian adolescents, and to meet WHO recommendations. Its planning began in 2004, with the meeting of a group of specialists, from several academic institutions, called by the General Coordination of Non-communicable Diseases and Conditions and Health Promotion (CGDANT), of the Secretary of Health Surveillance of the Ministry of Health (SVS/MS). Initially, a bibliographic revision and research for documents of similar surveys was conducted in order to subsidize the discussions about what would be the adequate design of the survey.
In 2005, a Technical Group (TG) was formed19
with the aim of conducting the first National Adolescent School-based Health Survey. The TG assisted the Ministry of Health in the formulation of the methodology, especially the development of the questions, by adapting national and international tools to the national needs and demands. The target-population chosen – adolescent students enrolled in the 8th grade (9th grade, after reformulation of the
education system) – considered the age recommended by WHO for adolescent health surveys (13 to 15 years old), besides the fact that this school grade is the last in the cycle of elementary school, having higher coverage of the target-population than the high school. In this age group, the students are able to understand well the questions, texts and topics proposed in the research. After some unsuccessful attempts to conduct a public bidding to enable the research, in 2007, IBGE and the Ministry of Health established a partnership to conduct PeNSE. The leadership, capacity for field work and adherence by IBGE researchers contributed so the investigation could be conducted with quality and swiftly. Currently, PeNSE is part of the calendar of researches under the responsibility of the Surveillance System for Risk and Protective Factors for Non-communicable Diseases and Conditions of the
Secretary of Health Surveillance, Ministry of Health, and includes telephone surveys, such as the Telephone Survey Surveillance System for Risk and Protective Factors for Chronic Diseases (VIGITEL), household surveys, such as the National Health Survey (PNS), the Surveillance for Violence and Accidents (VIVA survey) and PeNSE. IBGE is the partner of the Ministry of Health and developer of structuring researches, such as PeNSE and PNS, which is a strong element for its sustainability.20
In 2009, PeNSE innovated by using the equipment Personal Digital Assistant (PDA) to collect the data and, in 2012, the smartphone, standing out among the main adolescent-based researches worldwide. The Brazilian adolescents approved the new technology which, besides being safety, allows quick information transmission by eliminating data entry.
In the following years, the partnership between SVS/MS, WHO, the Pan-American Health Organization (PAHO) and the Centers for Disease Control and Prevention of the United States (CDC/USA) enabled a broader comparability between PeNSE and other surveys around the world.
The main objectives of PeNSE are to (i) compose the Surveillance for Risk and Protective Factors for Chronic Diseases in Brazil, (ii) monitor risk and protective factors regarding Brazilian adolescent students and (iii) identify priority issues for the development of public policies to promote adolescents’ health.
Sample
In the three editions of PeNSE (2009, 2012 and 2015) the researchers investigated factors of risk behavior and health protection in a sample of students who, at the moment of the survey, were enrolled in the 9th grade of Elementary School, in morning and
afternoon shifts of public and private schools, located in urban and rural areas of the Brazilian territory (Sample 1).1-3
The 2015 PeNSE was composed of two independent samples of students; one was the same as those from the previous years (2009 and 2012), that is, of students enrolled in the 9th grade of elementary school (Sample
1), and the other of students who were enrolled from the 6th grade of elementary school to the 3rd grade
some ages of interest. Both samples considered only students from regular public or private schools, with at least 15 students enrolled on the corresponding grade for each sample.1-3
The samples of 9th graders (Sample 1) were
dimensioned so the population parameters (proportions or prevalences) could be estimated in different geographic locations: each one of the 26 state capitals and the Federal District, for all the editions; the five Brazilian macroregions and the total for Brazil, in the editions of 2012 and 2015; and the 26 federative units, in the 2015 edition.1-3
Thus, the geographical stratification of the national territory for the sample of 9th graders occurred
as follows: each one of the 26 state capitals plus the Federal District was defined as a geographical stratum; the other municipalities were grouped into 26 geographical strata, representing each one of the Brazilian states, excluding their capitals, totalizing 53 strata. One sample of schools was dimensioned and selected in each one of the 53 strata formed. The sample characteristics are presented in Figure 1, highlighting the increase in the coverage and geographical breakdown of the survey.1-3
The size of the samples was calculated to provide estimates in each one of the geographical strata, with an approximate maximum error of 3%, in absolute values, with 95% confidence level. For that, the sample was dimensioned considering a prevalence (proportion) of 0.5 (or 50%), because, for proportions of this value, the variance of sample estimates is maximum. The sample sizes defined for each geographical stratum were distributed by strata allocation. The strata allocation, formed by comparing the geographical strata and the administrative dependence of the schools and their size – based on the number of 9th grade
classes –, were used to allocate the sample to ensure the presence of private and public schools (federal, state or municipal), in the approximate proportion to its real amount in the selection registration.1-3
To calculate the Sample 1, all the students enrolled in morning or afternoon shifts, in the 9th grade of
regular Elementary School, in schools where there were more than 15 students enrolled in that grade, according to the School Census valid at the time of the research planning.1-3 To estimate the sample size
(number of students) of a conglomerate sampling plan and a selection of proportional probabilities,
a 50% proportion estimate was considered, with error margin and confidence level of 95%, using the following formula:
n= epa.nASS= 1.96 __________ 4d2+1.962/N
Where:
n = size of the students’ sample in a specific geographic stratam
epa = estimate of conglomeration effect
nASS = size of an equivalent simple random sample d = expected margin of error
N = total of students recorded in that geographic stratam
1.96 = Z value of the standard normal distribution which corresponds to a 95% confidence level
Sample 2, which represented students aged from 13 to 17 years old, was composed of students enrolled from the 6th to 9th grades of Elementary School and from
the 1st to 3rd grades of High School, who studied in
morning, afternoon and evening shifts (including multi-grade, integrated and teaching technician), enrolled and attending public and private schools located in the urban and rural areas of the whole Brazilian territory, in the year the survey was conducted.3 Sample 2
represented Brazil and its macroregions (Figure 1). Sample 2 arose from the need to monitor students per age and represent 16 and 17-year-old individuals. The research scope increased and, consequently, its results could be compared with results of researches conducted in other countries. In this sub-sample, the evening shift was included because there is an important proportion of students aged 16-17 who study in this period. The schools with less than 15 students enrolled in the researched grade were excluded, for the reasons described previously. The following modalities of High School were also excluded: youth and adult education, concomitant professional education, subsequent professional education, combined professional education (concomitant + subsequent), 4th grade of regular high
school, integrated or teaching technician.3
Sample characteristics Year of research
2009 2012 2015 (Sample 1) 2015 (Sample 2)
Target-population Students enrolled in the 9th grade (former 8th grade) of Elementary School Students aged from 13 to 17 years old
Population in the research Students of the 9th grade of public and private Elementary Schools (morning and afternoon shifts), with at least 15 students enrolled in the 9th grade
Students of the 6th to 9th grades (formed 5th to 8th grades) of Elementary School to the 3rd grade of High School (morning, afternoon and evening shifts), of public and private schools, with at least 15 students enrolled in the respective grades Reference year of schools
registration 2007 2010 2013
Sampling plan (stratification)
Stratum: state capitals UPA:1 school
USA:2 class
State capitals Stratum: state capitals UPA:1 school
USA:2 class
Non-state capitals Stratum: macroregion, except state capitals UPA:1 group of
municipalities UPA:2 school
USA:3 class
State capitals Stratum: state capitals UPA:1 school
USA:2 class
Non-state capitals Stratum: federative unit, except state capitals UPA:1 IBGE agency
UPA:2 school
USA:3 class
Macroregions Stratum: macroregion UPA:1 IBGE agency
UPA:2 school
USA:3 class
Sample characteristics All the students of the selected classes Number of geographic
strata 27 32 53 05
Description of geographic strata
27 strata, composed of capitals of each federative unit
27 strata, composed of capitals of each federative unit
27 strata, composed of capitals of each federative unit
5 strata, each one related to one of the Brazilian macroregions
5 strata, composed of the aggregation of non-capital municipalities in each Brazilian macroregion
26 strata, composed of the aggregation of non-capital municipalities in each federative unit
Parameters to calculate the sample size
Maximum error 0.03% in absolute values in 95% confidence level Prevalence: 0.5
Proportional sample according to school administrative dependence
Considerations to calculate the sample size
Size of the students’ sample in a specific geographic stratum Total of students recorded in that geographic stratum Sampling plan effect – estimate of conglomeration effect
Selection method
State capital UPA:1 probabilities
proportional to the size (number of 9th grade classes)
USA:2 with the list of
schools, the classes were selected and the draw was conducted in loco for 1 or 2 classes (if the school had more than two 9th grade classes)
State capital Idem
Non-state capital UPA:1 selection of groups of
municipalities
USA:2 with the list of schools,
the classes were selected and the draw was conducted in loco for 1 or 2 classes (if the school had more than two 9th grade classes)
State capital Idem
Non-state capital UPA:1 selection of IBGE
agencies4
USA:2 with the list of schools,
the classes were selected and the draw was conducted in loco for 1 or 2 classes (if the school had more than two 9th grade classes)
Macroregion
UPA:1 selection of IBGE agencies4
UPA:2 probabilities proportional
to the size (number of classes for each class)
UTA:3 with the list of schools, the
classes were selected and the draw was conducted in loco for 1 or 2 classes (if the school had more than two eligible classes)
Representativeness
Represents students enrolled who regularly attended the classes.
In the calculation, students who missed the class or did not answer the sex were considered.
Represents students enrolled who regularly attended the classes. In the calculation, students who missed the class or did not answer the sex or age were considered.
Represents students aged 13 to 17, enrolled and who regularly attended the classes. In the calculation, students who missed the class or did not answer the sex or age were considered.
1) UPA: primary sample unit. 2) USA: secondary sample unit. 3) UTA: tertiary sample unit.
4) IBGE: Brazilian Institute of Geography and Statistics.
allowed the monitoring of the target of the NCD Global Plan defined for this age group.3
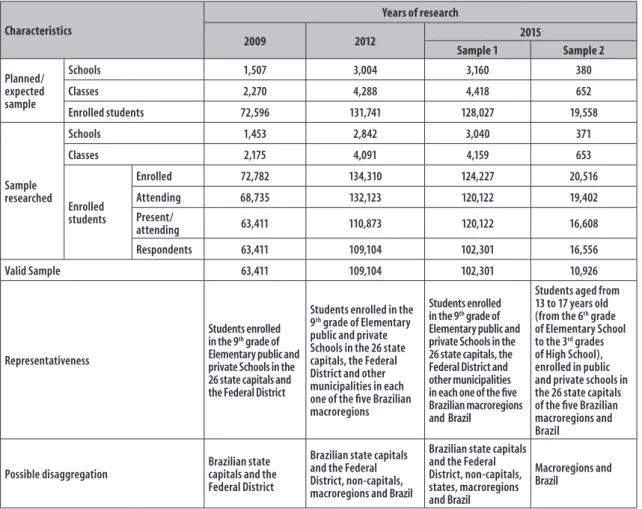
In Figure 2, we can see the predicted and collected samples, the representativeness and the possible disaggregation level of each edition.1-3
Participants
The target-population of PeNSE is composed of students (i) enrolled in the 9th grade of elementary
school (former 8th grade) (Sample 1) and (ii) from the 6th to 9th grades of elementary school (former 5th to
8th grades) and from the 1st to 3rd grades of high school
(Sample 2, from 2015 onwards). The students should be regularly enrolled in public and private schools located in the urban and rural areas of the Brazilian territory, and attending classes in the years the survey was conducted. With regard to these characteristics, all
the students of the classes of the selected schools were considered eligible to participate in the survey and were invited to answer to the questionnaire.1-3
Data collection
In all the editions, during the stage before field work, the teams from SVS/MS, IBGE, state health and education departments of the 27 Brazilian federative units participated in video conference meetings. This stage aimed to raise awareness of the local teams and plan previous visits to the schools, assisted by health and education technicians of the respective federative unit. After the schools’ draw, there were visits to the selected units in order to explain to the school directors and professionals the planning and to schedule the data collection.1-3
PeNSE is composed of two data collection tools. One of them is the school questionnaire, answered by the
Characteristics
Years of research
2009 2012 2015
Sample 1 Sample 2
Planned/ expected sample
Schools 1,507 3,004 3,160 380
Classes 2,270 4,288 4,418 652
Enrolled students 72,596 131,741 128,027 19,558
Sample researched
Schools 1,453 2,842 3,040 371
Classes 2,175 4,091 4,159 653
Enrolled students
Enrolled 72,782 134,310 124,227 20,516
Attending 68,735 132,123 120,122 19,402
Present/
attending 63,411 110,873 120,122 16,608
Respondents 63,411 109,104 102,301 16,556
Valid Sample 63,411 109,104 102,301 10,926
Representativeness
Students enrolled in the 9th grade of
Elementary public and private Schools in the 26 state capitals and the Federal District
Students enrolled in the 9th grade of Elementary
public and private Schools in the 26 state capitals, the Federal District and other municipalities in each one of the five Brazilian macroregions
Students enrolled in the 9th grade of
Elementary public and private Schools in the 26 state capitals, the Federal District and other municipalities in each one of the five Brazilian macroregions and Brazil
Students aged from 13 to 17 years old (from the 6th grade
of Elementary School to the 3rd grades
of High School), enrolled in public and private schools in the 26 state capitals of the five Brazilian macroregions and Brazil
Possible disaggregation
Brazilian state capitals and the Federal District
Brazilian state capitals and the Federal District, non-capitals, macroregions and Brazil
Brazilian state capitals and the Federal District, non-capitals, states, macroregions and Brazil
Macroregions and Brazil
director of the school or someone designated by them. The interview was conducted by a technician from IBGE.1-3
The other tool, destined to collect students’ data, was an electronic device: PDA, used in 2009; and smartphones, used in the subsequent editions. The IBGE technician distributed the devices to the students who were in class at the day of the interview and explained to them how to use the device. They also presented the Free Informed Term of Consent, and, after they agreed to participate in the survey, the students answered the questions. In this document, the adolescents were informed about their right to (i) not answer to some questions and (ii) leave the survey at any moment.1-3
Besides the questionnaire, the technicians collected the students’ anthropometric measurements to calculate their body mass index (BMI). In 2009 and 2015, they collected weight and height. In 2009, this measurement covered the whole sample. In 2015, the measurements were conducted in Sample 2, and for Sample 1, the weight and height were self-reported. In 2012, these data were not collected.1-3
Quality control
A pilot test was conducted during the research planning, for adjustments and adequacy. Before data collection, IBGE state supervisors were trained so they could replicate the same training course to the interviewers, in each federative unit. The main objective of this strategy was to ensure the quality and standardization of the procedures for data collection. The supervision conducted by the team of the national management of PeNSE with the field teams tried to ensure consistency in the procedures, besides collecting suggestions of the field experience, aiming to improve the future editions of PeNSE.1-3
During the data collection period, the data recorded on smartphones were sent daily, by the local teams to IBGE head office. When the data collection was concluded, IBGE treated the variables, by checking inconsistencies and cleaning the database. The sample weighs to be used in the data analysis were calculated by IBGE.1-3
Variables
The school questionnaire contains data related to (i) administrative organization (education level
offered, working shifts, number of enrolled students), description of the (ii) school environment (library, computer lab, kitchen, cafeteria, sports court, schoolyard, accessibility structure) and of (iii) local policies (adherence to the Programs School Health and More Education, policy against tobacco, alcoholic beverage, and bullying).
The students surveyed by PeNSE informed about: sociodemographic and economic aspects; family contexts; eating habits; practice of physical activity; tobacco, alcohol and other drugs; sexual and reproductive health; violence, safety and accidents; habits of personal hygiene; oral health; perception of body image; mental health; use of health services; and asthma. The dictionaries of variables for each edition of PeNSE are available at IBGE website: http://www.ibge.gov.br.
Uses
PeNSE data support the development of indicators to characterize the adolescents’ health profile. These indicators are mainly calculated according to sex and administrative dependence of the school. The main indicators monitored by the National Adolescent School-based Health Survey are presented in Figure 3. PeNSE supported the School Health Program, as well as other approaches of the Ministry of Education and Ministry of Health to promote health within schools. Its data subsidized the publication of several scientific articles,21,22 and academic studies.
Updates
PeNSE is revised every new edition so it can improve and be updated to answer to the demands related to adolescents’ health. According to Figure 4, throughout its three editions, the main changes were:
a) questionnaire review, inclusion and adjustments of questions, besides making it more comparable to international surveys – currently, seven modules can be compared to the GSHS;
b) change in the data collection tool – first the PDA, then the smartphone;
c) sample expansion, so the data could be more representative of Brazil, its macroregions, federative units and state capitals; and
Household and school contexts
Percentage of students whose parents or guardian knew what they did during their free time
Percentage of students who misses classes or did not attend school without permission from parents or guardian Percentage of students who used to eat their meals in five or more days a week with their parents or guardian
Eating habits
Percentage of students with healthy eating habits (beans and fruits) and unhealthy eating habits (treats and soft drinks), at least five out of seven days before the data collection
Physical activity and body image
Percentage of students with self-perception of body image, in the categories ‘skinny or thin’, ‘normal’, ‘fat or very fat’ Percentage of students who reported spending two or more hours a day watching TV (physical inactivity)
Attendance to physical education classes – percentage of students who had attended two or more physical education classes at school, in the previous seven days
Percentage of students who had practiced a total of 300 minutes or more of physical activity, in the previous seven days
Use of psychoactive substance
Percentage of students who had tried cigarette at least once in their lives
Percentage of students who reported having smoked at least once in the 30 days before the data collection Percentage of students who had tried alcoholic beverages at least once in their lives
Percentage of students who reported having drank alcoholic beverages at least once in the 30 days before the data collection Percentage of students who had tried, at least once, illicit drugs, such as marijuana, cocaine, crack, solvents mix (cola, loló, lança perfume), ecstasy, oxy, etc.
Percentage of students who reported having used illicit drugs, such as marijuana, cocaine, crack, solvents mix (cola, loló, lança perfume), ecstasy, oxy, etc., in the 30 days before the data collection
Violence
Percentage of students whose classmates had treated them well and/or had been helpful to them, in the 30 days before the data collection
Percentage of students who reported having felt humiliated by bullyers in the 30 days before the data collection
Percentage of students who had been into any fight in which someone used firearm or melee weapon in the 30 days before the data collection
Accidents
Percentage of students who had not used seat belt when they were in motor vehicle driven by another person, in the 30 days before the data collection
Percentage of students who had not worn seat belt when they were in motor vehicle driven by another person, in the 12 days before the data collection
Sexual behavior
Percentage of students who have had sex at least once in their lives
Percentage of students, among those who have had sex, who used condom in the last intercourse Dental Health and search for health services
Percentage of students who had been to the dentist in the 12 months before the data collection
Percentage of students who searched for any health service or professional for assistance related to their own health, in the 12 months before the data collection
Figure 3 – Main indicators monitored by the National Adolescent of the National Adolescent School-based Health Survey (PeNSE), Brazil
Limitations
When using PeNSE data, some limitation must be taken into consideration to interpret the analyses results.
Firstly, it is important to highlight that this survey in conducted with adolescents who attend school and were there the day the questionnaire was applied. So, two main issues should be considered: (i) school absenteeism may be related to the outcome
studied;13 and (ii) this survey does not represent
the Brazilian adolescents, but the adolescents who go to school. However, we must consider that the elementary school level is universalized throughout the country.5,6
Revisão do questionário, com objetivo de torná-lo mais comparável aos
inquéritos internacionais
Revisão e expansão da amostra
Revisão e expansão da amostra
Idealização da Pesquisa Nacional de Saúde do escolar (2004)
Amostra representativa de escolas públicas e privadas nas 26 capitais brasileiras e no Distrito Federal
2ª edição
3ª edição
2004 - 2007 2012 2015
Amostra representativa das 26 capitais brasileiras e no Distrito Federal,
Regiões e Brasil 1ª edição
Amostra 2** representativa Regiões e Brasil
Amostra 1* representativa das 26 capitais brasileiras e no Distrito Federal, Unidades Federativas, Regiões e Brasil
Celebração da parceria entre o Ministério da Saúde e O Instituto Brasileiro de
Geografia e Estatística (2007)
3rd edition
2nd edition
Revision of the questionnaire in order to make it more camparable to
international surveys
1st edition Self-report questionnaire
using the smartphone Revision and expansion of the sample
Conception of the National Adolescent School-based Health
Survey (2004)
Self-report questionnaire using the
Personal Digital Assistant Revision and expansion of the sample
Sample 1* representing public and private schools of the 26 Brazilian state capitals and the Federal Disctrict, Macroregions and Brazil
Partnership between the Ministry of Health and the Brazilian Institute of Geography and Statistics (2007)
Sample representing public and private schools of the 26 Brazilian state capitals and the Federal Disctrict
Sample representing public and private schools of the 26 Brazilian
state capitals and the Federal Disctrict, Macroregions and Brazil
Sample 2** representing Macroregions and Brazil
2004 - 2007 2009 2012 2015
*Sample 1: students of the 9th grade of Elementary School.
**Sample 2: students from the 6th grade of Elementary School to the 3rd grade of High School.
Figure 4 – Timeline of planning and development of the National Adolescent School-based Health Survey (PeNSE), Brazil, 2004-2015
of the asked behaviors. Since this is a cross-sectional survey, it is necessary to be cautious when interpreting the results, because it is not possible to establish time and causal relation to some of the associations found.23
We should also be aware to the comparison between indicators obtained from data collected in different editions: some questions are not comparable anymore, and the samples have also changed, especially in 2015, when we compare to the two first editions – 2009 and 2012.1-3
Data analysis
Since this is a complex sample survey, the data analysis of PeNSE must consider weights for each sample, calculated with the objective of representing the students belonging to each sample.
in the research and informed their age and sex). The sample weights enabled to estimate the number of students enrolled who were present in classes.1-3
The analyses must be conducted with specific statistical programs for data originated in complex samples. Before the beginning of the analyses, the sample weighs and the strata must be stated: (i) for 2009, ‘peso_aju_sexo’ and ‘estaloca’; (ii) for 2012, ‘peso’ and ‘estratog’; and (iii) for 2015, ‘peso’ and ‘estrato_exp’.
The analyses can be stratified, mainly by sex and administrative dependence. For geographical disaggregation, the representativeness of the sample for each edition must be observed, as previously descried.
Ethical aspects
In all the editions of PeNSE, their respective projects were submitted and approved by the National Committee of Ethics in Research (CONEP) – reports No. 11.537/2009, No. 16.805/2012 and No. 1.006.467/2015 –, and met the Resolution of the National Health Council (CNS) No. 196, dated October 10th 1996.
The Free Informed Term of Consent was included in the PDA (2009) and in the smartphones (2012 and 2015), depending on the edition, and the participants marked that they were aware of their participation in the research. The participants could withdraw the
research at any moment, with no loss of any type. Anonymity and privacy were fully guaranteed to the participants; IBGE does not provide variables that can identify the participants.
Access
PeNSE data are of public domain and can be accessed at IBGE website (http://www.ibge.gov.br). In the icon ‘population’, you can select the ‘National Adolescent School-based Health Survey’. In the chart ‘Summary of the profile of the National Adolescent School-based Health Survey – PeNSE. Brazil, 2009, 2012 and 2015’, you can find the links to access each edition of PeNSE and the information available: book with the analyses results; tables with the main indicators; files with the school and students’ data, in the formats ‘.csv’ and ‘.sas7bdat’; and variables dictionaries, in ‘.xls’.
Authors' Contributions
Oliveira MM worked in the development of the first version of the manuscript. Malta DC wrote the background. Oliveira MM, Campos MO, Andreazzi MAR and Malta DC conducted the critical review of the article. All the authors approved its final version and declared to be responsible for all aspects of the study, ensuring its accuracy and integrity.
1. Instituto Brasileiro de Geografia e Estatística. Pesquisa nacional de saúde escolar. Rio de Janeiro: Instituto Brasileiro de Geografia e Estatística; 2009.
2. Instituto Brasileiro de Geografia e Estatística. Pesquisa nacional de saúde escolar. Rio de Janeiro: Instituto Brasileiro de Geografia e Estatística; 2013.
3. Instituto Brasileiro de Geografia e Estatística. Pesquisa nacional de saúde escolar. Rio de Janeiro: Instituto Brasileiro de Geografia e Estatística; 2016.
4. Instituto Brasileiro de Geografia e Estatística. Sinopse do censo demográfico 2010 [Internet]. Rio de Janeiro: Instituto Brasileiro de Geografia e Estatística; 2011 [citado 2017 maio 08]. Disponível em: http://www.ibge.gov.br/home/ estatistica/populacao/censo2010/sinopse/default_ sinopse.shtm
5. Instituto Brasileiro de Geografia e Estatística. Pesquisa nacional por amostra de domicílios: síntese de indicadores [Internet]. Rio de Janeiro: Instituto Brasileiro de Geografia e Estatística; 2012 [citado 2017 maio 08]. Disponível em: http://www.ibge.gov. br/home/estatistica/populacao/trabalhoerendimento/ pnad2012/default_sintese.shtm
6. Instituto Brasileiro de Geografia e Estatística. Pesquisa nacional por amostra de domicílios: síntese de indicadores [Internet]. Rio de Janeiro: Instituto Brasileiro de Geografia e Estatística; 2013 [citado 2017 maio 08]. Disponível em: http://www.ibge.gov. br/home/estatistica/populacao/trabalhoerendimento/ pnad2013/default_sintese.shtm
7. World Health Organization. Inequalities young people's health: key findings from the Health Behaviour in School-aged Children (HBSC)
2005/2006 survey fact sheet [Internet]. Copenhagen: World Health Organization; 2008 [cited 2017 May 08]. Avaliable from: http://www. euro.who.int/__data/assets/pdf_file/0004/83695/ fs_hbsc_17june2008_e.pdf
8. Malta DC, Andreazzi MA, Oliveira-Campos M, Andrade SS, Sá NN, Moura L, et al. Trend of the risk and protective factors of chronic diseases in adolescents, National Adolescent School-based Health Survey (PeNSE 2009 e 2012). Rev Bras Epidemiol. 2014;17 Suppl 1:77-91.
9. Ministério da Saúde (BR). Secretaria de Vigilância em Saúde. Departamento de Análise de Situação de Saúde. Plano de ações estratégicas para o enfrentamento das doenças crônicas não
transmissíveis (DCNT) no Brasil 2011-2022. Brasília: Ministério da Saúde Brasília; 2011.
10. Oliveira-Campos M, Nunes ML, Madeira FC, Santos MG, Bregmann SR, Malta DC, et al. Sexual behavior among Brazilian adolescents, National Adolescent School-based Health Survey (PeNSE 2012). Rev Bras Epidemiol. 2014;17 Suppl 1:116-30.
11. Matos K, Martins CBG. Mortalidade por causas externas em crianças, adolescentes e jovens: uma revisão bibliográfica. Rev Espaço Saúde. 2013 dez;14(1/2):82-93.
12. Andrade SSCA, Yokota RTC, Sá NNB, Silva MMA, Araújo WN, Mascarenhas MDM, et al. Relação entre violência física, consumo de álcool e outras drogas e bullying entre adolescentes escolares brasileiros. Cad Saude Publica. 2012 set;28(9):1725-36.
13. Oliveira MM, Andrade SSCA, Campos MO, Malta DC. Fatores associados à procura de serviços de saúde entre escolares brasileiros: uma análise da Pesquisa Nacional de Saúde do Escolar (PeNSE), 2012. Cad Saude Publica. 2015 ago;31(8):1603-14.
14. World Health Organization. Global school-based student health survey (GSHS). Geneva: World Health Organization; 2009.
15. Brener ND, Kann L, Shanklin S, Kinchen S, Eaton DK, Hawkins J, et al. Methodology of the youth risk behavior surveillance system — 2013. MMWR Recomm Rep. 2013 Mar ;62(RR01):1-23.
16. Galduróz JCF, Noto AR, Fonseca AM, Carlini EA. V levantamento nacional sobre o consumo de drogas psicotrópicas entre estudantes do ensino fundamental e médio da rede pública de ensino
nas 27 capitais brasileiras: 2004 [Internet]. São Paulo: Centro Brasileiro de Informações sobre Drogas Psicotrópicas; 2005 [citado 2017 maio 08]. Disponível em: http://200.144.91.102/sitenovo/ conteudo.aspx?cd=644
17. Ministério da Saúde (BR). Secretaria de Atenção à Saúde. Instituto Nacional de Câncer José Alencar Gomes da Silva. VigiEscola: Vigilância de tabagismo em escolares: dados e fatos de 12 capitais brasileiras [Internet]. Ministério da Saúde; 2004 [citado 2017 maio 08]. Disponível em: http://www.inca.gov.br/ vigescola/docs/vigescola_completo.pdf
18. Castro IRR, Cardoso LO, Engstrom EM, Levy RB, Monteiro CA. Vigilância de fatores de risco para doenças não transmissíveis entre adolescentes: a experiência da cidade do Rio de Janeiro, Brasil. Cad Saude Publica. 2008 out;24(10):2279-88.
19. Brasil. Ministério da Saúde. Portaria nº 12, de 26 de abril de 2005. Constitui grupo técnico, com a finalidade de apoiar a realização da primeira pesquisa nacional de saúde dos escolares. Diário Oficial da República Federativa do Brasil, Brasília (DF), 2005 abr 27; Seção 1:118.
20. Malta DC, Morais Neto OL, Silva MMA, Rocha D, Castro AM, Reis AAC, et al. Política Nacional de Promoção da Saúde (PNPS): capítulos de uma caminhada ainda em construção. Cienc Saude Coletiva. 2016 jun 21(6):1683-94.
21. Pesquisa Nacional de Saúde do Escolar. Ciência e saúde coletiva; 2010: 15 supl2.
22. Pesquisa Nacional de Saúde do Escolar. Revista Brasileira de Epidemiologia. 2014;17(supl.1). Disponível em: http://www.scielo.br/scielo. php?script=sci_issuetoc&pid=1415-790X20140005&lng=pt&nrm=iso
23. Gordis L. Epidemiology. 5. ed. Philadelphia: Elsevier Saunders; 2014.
Received on 27/03/2017