BGD
11, 16447–16495, 2014
Recycling and fluxes of C gases in a stratified boreal
lake
H. Nykänen et al.
Title Page
Abstract Introduction
Conclusions References
Tables Figures
◭ ◮
◭ ◮
Back Close
Full Screen / Esc
Printer-friendly Version Interactive Discussion
Discussion
P
a
per
|
Discussion
P
a
per
|
Discussion
P
a
per
|
Discussion
P
a
per
|
Biogeosciences Discuss., 11, 16447–16495, 2014 www.biogeosciences-discuss.net/11/16447/2014/ doi:10.5194/bgd-11-16447-2014
© Author(s) 2014. CC Attribution 3.0 License.
This discussion paper is/has been under review for the journal Biogeosciences (BG). Please refer to the corresponding final paper in BG if available.
Recycling and fluxes of carbon gases in a
stratified boreal lake following
experimental carbon addition
H. Nykänen1, S. Peura1,2, P. Kankaala3, and R. I. Jones1
1
University of Jyväskylä Department of Biological and Environmental Science, Jyväskylä, Finland
2
Department of Ecology and Genetics, Uppsala University, Uppsala, Sweden 3
Department of Biology, University of Eastern Finland, Joensuu Campus, Joensuu, Finland
Received: 28 October 2014 – Accepted: 28 October 2014 – Published: 28 November 2014 Correspondence to: H. Nykänen ([email protected])
BGD
11, 16447–16495, 2014
Recycling and fluxes of C gases in a stratified boreal
lake
H. Nykänen et al.
Title Page
Abstract Introduction
Conclusions References
Tables Figures
◭ ◮
◭ ◮
Back Close
Full Screen / Esc
Printer-friendly Version Interactive Discussion
Discussion
P
a
per
|
Discussion
P
a
per
|
Discussion
P
a
per
|
Discussion
P
a
per
|
Abstract
Partly anoxic stratified humic lakes are important sources of methane (CH4) and car-bon dioxide (CO2) to the atmosphere. We followed the fate of CH4and CO2in a small boreal stratified lake, Alinen Mustajärvi, during 2007–2009. In 2008 and 2009 the lake received additions of dissolved organic carbon (DOC) with stable carbon isotope ratio
5
(δ13C) around 16 ‰ higher than that of local allochthonous DOC. Carbon transforma-tions in the water column were studied by measurements of δ13C of CH4 and of the dissolved inorganic carbon (DIC). Furthermore, CH4 and CO2 production, consump-tion and emissions were estimated. Methane oxidaconsump-tion was estimated by a diffusion gradient method. The amount, location andδ13C of CH4-derived biomass and CO2 in
10
the water column were estimated from the CH4 oxidation pattern and from measured
δ13C of CH4. Release of CH4 and CO2to the atmosphere increased during the study. Methane production and almost total consumption of CH4 mostly in the anoxic water layers, was equivalent to the input from primary production (PP). δ13C of CH4 and DIC showed that hydrogenotrophic methanogenesis was the main source of CH4 to
15
the water column, and methanogenic processes in general were the reasons for the
13
C-enriched DIC at the lake bottom. CH4 and DIC became further 13C-enriched in the anoxic layer of the water column during the years of DOC addition. Even gradient diffusion measurements showed active CH4oxidation in the anoxic portion of the water column; there was no clear13C-enrichment of CH4as generally used to estimate CH4
20
oxidation strength. Increase inδ13C-CH4was clear between the metalimnion and epil-imnion where the concentration of dissolved CH4and the oxidation of CH4were small. Thus,13C-enrichment of CH4 does not reveal the main location of methanotrophy in a lake having simultaneous anaerobic and aerobic oxidation of CH4. Overall the results show that organic carbon is processed efficiently to CH4 and CO2 and recycled in the
25
BGD
11, 16447–16495, 2014
Recycling and fluxes of C gases in a stratified boreal
lake
H. Nykänen et al.
Title Page
Abstract Introduction
Conclusions References
Tables Figures
◭ ◮
◭ ◮
Back Close
Full Screen / Esc
Printer-friendly Version Interactive Discussion
Discussion
P
a
per
|
Discussion
P
a
per
|
Discussion
P
a
per
|
Discussion
P
a
per
|
biomass was produced, while a large amount of CH4-derived CO2was produced in the anoxic bottom zone of the lake.
1 Introduction
A large number of small lakes is typical of boreal and arctic regions (Downing et al., 2006). Due to a high load of allochthonous dissolved organic carbon (DOC) from their
5
forested and peatland-dominated catchments, most of these small lakes are highly humic, brown-water lakes (Kortelainen, 1993). Thus, the lakes are integral parts of terrestrial carbon cycling in the landscape and can return a substantial proportion of the carbon originally fixed in their catchment areas back to the atmosphere (Algesten et al., 2003; Huotari et al., 2011). In contrast, the sediments of small lakes function as
10
a permanent sink and store of carbon (Kortelainen et al., 2004). As concentrations of allochthonous DOC in the lakes in many boreal regions are reported to be increasing (Vuorenmaa et al., 2006; Monteith et al., 2007), there is a need for better understanding of carbon cycling in the lakes.
During summer, the water columns of small, sheltered brown-water lakes are
typi-15
cally steeply stratified with respect to light penetration, temperature and chemical prop-erties (Salonen et al., 2004). Under stratified conditions microbial processes also differ considerably according to depth and oxygen availability. Anaerobic microbial decom-position of organic matter in the sediment and deep water layers yields high accumu-lation of carbon dioxide (CO2) and methane (CH4) in the anoxic hypolimnion (Houser
20
et al., 2003). In freshwater lakes methanogenesis is the main process in anaerobic or-ganic matter degradation (Capone and Kiene, 1988), based either on acetoclastic (ac-etate as terminal substrate) or hydrogenotrophic (H2and CO2 as terminal substrates) pathways. Furthermore, both processes consume and release CO2 in a chain of pro-cesses leading to CH4.
25
BGD
11, 16447–16495, 2014
Recycling and fluxes of C gases in a stratified boreal
lake
H. Nykänen et al.
Title Page
Abstract Introduction
Conclusions References
Tables Figures
◭ ◮
◭ ◮
Back Close
Full Screen / Esc
Printer-friendly Version Interactive Discussion
Discussion
P
a
per
|
Discussion
P
a
per
|
Discussion
P
a
per
|
Discussion
P
a
per
|
stratification period the metalimnetic oxycline is a site of active CH4 oxidation, which is often seen as minimum CH4 concentration in this layer (Bastviken et al., 2008). In addition, CH4can be oxidized anaerobically (anaerobic oxidation of methane, AOM) by anaerobic methanotrophic archaea (ANME) using electron acceptors other than oxy-gen (Liikanen et al., 2002; Eller et al., 2005; Caldwell et al., 2008; Schubert et al., 2011,
5
2012). Furthermore, nitrite reducers can provide molecular oxygen directly for methan-otrophs in anoxic systems (Ettwig et al., 2010). Also micro-aerobic CH4 oxidation is possible in anoxic water columns (Blees et al., 2014)
At an annual scale most boreal lakes are significant sources to the atmosphere of both CO2 (Kortelainen et al., 2006; Huotari et al., 2011) and CH4 (Bastviken
10
et al., 2004; Juutinen et al., 2009), although during the summer stratification period they may occasionally be sinks of atmospheric CO2 due to photosynthetic uptake in the shallow euphotic layer and low gas transfer velocities between epilimnion and hy-polimnion (Ojala et al., 2011; Huotari et al., 2011; Kankaala et al., 2013a). When con-sidering the fluxes of radiatively important trace gases, the transformation of CH4 by
15
MOB to their cell material and to CO2is important, because CH4is 25 times more active as a greenhouse gas than CO2in a time horizon of 100 years (IPCC, 2007). Seasonally, the greatest CH4emissions to the atmosphere have usually been measured immedi-ately after ice-melt, and also during the autumnal overturn (Kankaala et al., 2006a; Juutinen et al., 2009; Karlsson et al., 2013). In autumn a high proportion of dissolved
20
CH4 is oxidized in the mixed water column when plenty of both CH4 and oxygen are simultaneously available for MOB in the same location (Kankaala et al., 2006a, 2007). In general, a major part of the CH4 produced (50–100 %) is apparently oxidized in the lake water column (Kankaala et al., 2006a, 2007; Bastviken et al., 2002; Shubert et al., 2011, 2012) before reaching the atmosphere. CH4carbon in microbial biomass
25
BGD
11, 16447–16495, 2014
Recycling and fluxes of C gases in a stratified boreal
lake
H. Nykänen et al.
Title Page
Abstract Introduction
Conclusions References
Tables Figures
◭ ◮
◭ ◮
Back Close
Full Screen / Esc
Printer-friendly Version Interactive Discussion
Discussion
P
a
per
|
Discussion
P
a
per
|
Discussion
P
a
per
|
Discussion
P
a
per
|
Kankaala et al., 2013b). Moreover, in the euphotic zone of the water column, CO2 de-rived from CH4 can be incorporated into the biomass of algae. Thus, a major part of the CH4 produced seems to be recycled in lakes. Despite this, CH4 emissions from lakes have been estimated to contribute as much as 8–48 Tg year−1 (6–16 %) to the global natural CH4emissions (Bastviken et al., 2004), although also smaller estimates
5
of 3.7–10 Tg year−1have also been given (Juutinen et al., 2009).
The knowledge that biogenic CH4 has a strongly negative stable carbon isotope value (δ13C) compared to other carbon forms in ecosystems has been widely utilized in biogeochemical and ecological studies. CH4production and consumption processes give a particular signal to its bulk isotopic composition in the water column, and this
sig-10
nal is then reflected in the isotopic composition of microbes oxidizing CH4and also in higher trophic level consumers. It is possible to track the production pathway, especially if the isotopic composition of CO2is also known (Whiticar, 1999). In methane oxidation the lighter carbon (12C) isotope is preferentially consumed, increasing the proportion of the heavier13C in the residual CH4 (Whiticar, 1999; Bastviken et al., 2002).
Fraction-15
ation against the heavier isotope has also been demonstrated for anaerobic microbial oxidation of CH4 (Holler et al., 2009). Thus, the existence of CH4 oxidation can be verified and an estimation of the fraction of oxidized CH4can be calculated from mea-suredδ13C-CH4 values. The isotopic composition of DIC (δ13C-P
CO2 or δ13C-DIC) is determined by the original substrate δ13C, respiration, photosynthesis and diff
u-20
sion; δ13C-DIC is also linked to CH4 by its use in CH4 production, and when CH4 is oxidized aerobically or anaerobically, isotopically depleted CO2 is produced. Car-bon isotope analyses have shown that MDC can be>50 % of the carbon biomass of crustacean zooplankton and chironomid larvae in some lakes (Jones and Grey, 2011; Taipale et al., 2011) and up to 20 % of carbon biomass of fish (Jones and Grey, 2011).
25
BGD
11, 16447–16495, 2014
Recycling and fluxes of C gases in a stratified boreal
lake
H. Nykänen et al.
Title Page
Abstract Introduction
Conclusions References
Tables Figures
◭ ◮
◭ ◮
Back Close
Full Screen / Esc
Printer-friendly Version Interactive Discussion
Discussion
P
a
per
|
Discussion
P
a
per
|
Discussion
P
a
per
|
Discussion
P
a
per
|
(AMO). Thus the fate of biogenic CH4is important in stratified lake carbon cycles and needs further study.
Here we report results from a study of carbon cycling in a small boreal forest lake from 2007 to 2010. During the second and third year the DOC concentration was ex-perimentally increased by addition of cane sugar (δ13C ca.−12 ‰) to test the effect
5
of increased DOC load on lake ecosystem functions and also to be able to trace the fate of DOC in the lake by its δ13C signal. Peura et al. (2014) found from this same experiment that after DOC enrichment, diffusive CH4 and CO2 fluxes increased, epil-imnetic bacterial production increased, DIC became13C-enriched, and there was also transfer of added carbon to consumers by bacterial usage of DOC. Here we present
10
detailed results for carbon gas (CH4 and DIC) dynamics in the whole lake water col-umn during the experimental period, based on both the isotopic signature of C (δ13C) and mass balance calculations. We usedδ13C-CH4to estimate processes involved in CH4 formation, its vertical and temporal pattern in the water column and the strength of CH4oxidation, as well as possible effects of CH4oxidation on formation of microbial
15
biomass and on the isotopic composition of DIC. Whileδ13C values of microbes utiliz-ing CH4and DIC (acetogens, methanogens, methanotrophs and algae) are not easily measurable, δ13C of POM, DOM and zooplankton are shown to set frames for their possible isotopic composition. These findings are then tied to carbon flow estimates for the lake.
20
2 Materials and methods
2.1 Site and manipulation
The study was done in a small polyhumic headwater lake with sampling from spring 2007 to autumn 2010, during the ice-free period, and occasionally during the winter ice cover periods. Total amounts of oxygen, DIC, methane and DOC are presented to the
25
BGD
11, 16447–16495, 2014
Recycling and fluxes of C gases in a stratified boreal
lake
H. Nykänen et al.
Title Page
Abstract Introduction
Conclusions References
Tables Figures
◭ ◮
◭ ◮
Back Close
Full Screen / Esc
Printer-friendly Version Interactive Discussion
Discussion
P
a
per
|
Discussion
P
a
per
|
Discussion
P
a
per
|
Discussion
P
a
per
|
production and consumption results are only from the ice-free stratification periods during 2007–2009 when measurements of CH4 consumption by a diffusion gradient method were possible from 1 May to 31 October in 2007 and 2008, and from 1 May to 30 September in 2009.
Lake Alinen Mustajärvi (Fig. 1) is a small (area 0.7 ha, volume 31 000 m3) headwater
5
lake located in a boreal coniferous forest area in southern Finland (61◦12′N, 25◦06′E; 129.4 m a.s.l.). The catchment area (<0.5 km2) consists of over 90 % mixed spruce, pine and birch forest and less than 10 % peatlands. The lake is covered by ice for 5.5–6 months each year from late November to late April. During the ice-free period the lake is steeply stratified with respect to temperature and oxygen; there is low stable
10
temperature, darkness and anoxic conditions in the hypolimnion, while the eplimnion is aerobic and supports photosynthesis, although the dark water colour restricts the eu-photic zone. Alinen Mustajärvi is spring meromictic and thus transition from under ice stratification to summer stratification is rapid, while overturn in autumn mixes aerated surface water to the bottom of the water column and deeper water masses can come
15
into contact with the atmosphere. The littoral zone of the lake is narrow, reaching to a depth of only 1.5–1.6 m, and the vegetation is dominated by sparse stands ofNuphar lutea(L.),Carexspecies and submergedSphagnum. Weather data are from the near-est weather station at Lammi Biological Station (61◦03′N, 25◦02′E, 125 m a.s.l.), some 18 km from the lake. Average annual temperature for the period 1981–2010 was 4.2◦C
20
and precipitation 645 mm, of which 326 mm was during 1 May to 30 September (Piri-nen et al., 2012). During this study, the precipitation for the same period was 323.7, 306.9 and 324.0 mm for 2007, 2008 and 2009, respectively. A small ditch (10 cm deep and 30 cm wide) drains some water from the lake.
An annual addition of 22 g carbon m−2 as cane sugar (Demerara Sugar, Danisco
25
BGD
11, 16447–16495, 2014
Recycling and fluxes of C gases in a stratified boreal
lake
H. Nykänen et al.
Title Page
Abstract Introduction
Conclusions References
Tables Figures
◭ ◮
◭ ◮
Back Close
Full Screen / Esc
Printer-friendly Version Interactive Discussion
Discussion
P
a
per
|
Discussion
P
a
per
|
Discussion
P
a
per
|
Discussion
P
a
per
|
to the epilimnion. Sugar was first dissolved in lake water in a large tub and the sugar solution was then pumped to the lake epilimnion by bilge pump and dispersed manually from a tube at a height of 1 m above the water surface from a rowing boat. Mixing was ensured by vigorous rowing while the sugar was being added. The first addition was on 15 May 2008 and the last on 9 October 2009. All measurements were made before
5
sugar additions, so that after each sugar addition there was always a minimum of 2 weeks when the lake was not disturbed. The added carbon was intended to mimic in-creased loading of labile allochthonous carbon sources due to changed precipitation, or to altered thawing and melting patterns, changing runoffand carbon flows in the catch-ment area. However, the cane sugar had δ13C around −12 ‰, while allochthonous 10
(terrestrial) organic carbon entering the lake hasδ13C around −27 ‰, so the added
sugar also served as an isotopic tracer for carbon transformations in the lake.
2.2 Measurements
All variables were measured from over the deepest point of the lake (6.5 m). All sam-pling was done between 08:30 and 11:00 (GMT+2 h).
15
2.2.1 Physical variables
Temperature and oxygen concentration were measured at 0.5 m intervals with a YSI 55 probe (Yellow Springs Instruments; accuracy ±0.3◦C, ±0.3 mg O2L−1 or ±2 % of
reading) starting from the lake bottom. Because oxygen measurement with this de-vice does not guarantee when the water is totally anoxic, redox measurements were
20
also made monthly during 2007–2008 with a WTW Multiline P3 and Redox electrode SenTix ORP directly from the water collected in a 2 L Limnos tube sampler from 1 m intervals. Additional measurements made in 2009 (J. Saarenheimo, personal commu-nication, 2010) confirmed anoxic conditions in the lake hypolimnion during the whole study during stratification periods. The temperature profile of the water column at 1 m
25
BGD
11, 16447–16495, 2014
Recycling and fluxes of C gases in a stratified boreal
lake
H. Nykänen et al.
Title Page
Abstract Introduction
Conclusions References
Tables Figures
◭ ◮
◭ ◮
Back Close
Full Screen / Esc
Printer-friendly Version Interactive Discussion
Discussion
P
a
per
|
Discussion
P
a
per
|
Discussion
P
a
per
|
Discussion
P
a
per
|
spring thawing in 2007 to the start of the ice-covered period in 2008; logging during winter was successful only from depths of 1, 2 and 4 m.
2.2.2 Chemical analyses
Samples for water chemistry were collected with the Limnos sampler. Water collected for pH, DOC and nutrient analyses was pooled from the epilimnion (during 2007 and
5
2008 sample depths were 0, 1, and 2 m, thereafter 0 and 1 m), metalimnion (during 2007 and 2008 sample depths were 3 and 4 m, thereafter 2 and 3 m) and hypolimnion (during 2007 and 2008 sample depths were 5 and 6 m, thereafter 4, 5 and 6 m) (Ta-ble 1). Nutrient concentrations (P−PO−
4, N−NO3+N−NO2, NH4, Ptot, Ntot) were
mea-sured by standard methods (http://www.sts.fi/). Light penetration was meamea-sured as
10
Secchi-disc depth.
2.2.3 Primary production and community respiration
Primary production (PP) was measured with the inorganic14C-uptake method (Keski-talo and Salonen, 1994), and community respiration as an increase in DIC concentra-tion during 24 h incubaconcentra-tion in the dark with DIC analysed according to Salonen (1981).
15
PP and community respiration were measured using water collected from 0, 0.5, 1 and 2 m depths, and incubations were made at the corresponding depths. For cumulative net production and respiration, the daily averages were multiplied by the number of days in the month and these values were summed for each study period.
2.2.4 Methane and DIC concentrations andδ13C
20
Concentrations of CH4 and DIC in the water column were measured from samples taken once or twice per month at 1 m intervals into 50 mL gas-tight polypropylene sy-ringes. These were kept under crushed ice prior to analyses (max 4 h) and concen-tration was analysed with the headspace equilibrium technique and gas chromatogra-phy (Agilent 6890N equipped with FID and TCD, details in Ojala et al., 2011). Before
BGD
11, 16447–16495, 2014
Recycling and fluxes of C gases in a stratified boreal
lake
H. Nykänen et al.
Title Page
Abstract Introduction
Conclusions References
Tables Figures
◭ ◮
◭ ◮
Back Close
Full Screen / Esc
Printer-friendly Version Interactive Discussion
Discussion
P
a
per
|
Discussion
P
a
per
|
Discussion
P
a
per
|
Discussion
P
a
per
|
adding the N2 headspace, the water was acidified with HNO3 to convert all DIC to CO2for analyses with TCD. The CH4concentration in the water was calculated as de-scribed by Huttunen et al. (2001a). Samples forδ13C-DIC were taken from the Limnos sampler directly by 5 mL syringe to vials having a helium atmosphere and 0.15 mL of H3PO4. In 2007 samples were taken to a depth of 5 m and were analysed at the
Uni-5
versity of Helsinki by E. Sonninen. During the rest of the study samples were taken to a depth of 6 m and were analysed at Jyväskylä similarly as in Helsinki with a Gas-Bench II connected to a Thermo Finnigan XP Advantage, using the same in-house carbon standard, CaCO3. Samples forδ13C-CH4were collected once a month during the open water period from 2008 to 2009; generally depth intervals were 1 m, and once
10
0.5 m. For CH4isotopic analyses, 30 mL water samples from the Limnos tube sampler were taken into 60 mL syringes. In the laboratory, 30 mL of N2 headspace gas was added into the syringes via 3-way stopcocks and after shaking the headspace gas was injected into pre-evacuated LABCO exetainers (12 mL). Analyses of δ13C-CH4 were done similarly and with the same isotopic ratio mass spectrometer and PreCon unit as
15
described in Kankaala et al. (2007). The same gas cylinder of standard for CH4 was used as an in-house standard during the study to ensure consistency.δ13C of POM, DOM and zooplankton was determined as in Peura et al. (2014). Results are reported relative to the VPDP scale.
δ13C=
13
C
12C
sample
13
C
12C
standard
−1
·1000 (1)
20
CH4 concentration and δ13C-CH4 in bubble collectors (design described in Huttunen et al., 2001b) were determined twice during 2008 after 7–20 day deployments and again in spring 2009. The lowest rim (area covering 0.03 m2) of the collector was at a depth of 0.5 m. Sub-samples were taken from the upper part of the collector and CH4 concentration and δ13C-CH4 analyses were made as described for analyses of
25
BGD
11, 16447–16495, 2014
Recycling and fluxes of C gases in a stratified boreal
lake
H. Nykänen et al.
Title Page
Abstract Introduction
Conclusions References
Tables Figures
◭ ◮
◭ ◮
Back Close
Full Screen / Esc
Printer-friendly Version Interactive Discussion
Discussion
P
a
per
|
Discussion
P
a
per
|
Discussion
P
a
per
|
Discussion
P
a
per
|
the boundary layer diffusion equations presented by Kling et al. (1992) and Phelps et al. (1998), and their calculation is described in Peura et al. (2014).
2.2.5 Biofilm, algae and surface sedimentδ13C
Biofilm was scraped by spatula from surfaces of ropes and incubation support tubes in autumn 2009. This represents material accumulated during summer, probably
consist-5
ing of algae, microbes and some zooplankton, and thus integrates various processes in the lake water column. Algae was sampled on 1 July 2009 straight from a surface scum, and represents photosynthetic material at the lake surface. Floating material from the bottom was taken from the Limnos tube sampler in early spring under ice (6 April 2010).Chaoboruswere sampled from near the lake bottom by net. For isotopes
10
analyses samples were frozen and then freeze-dried before analysis by EA IRMS.
2.3 Calculations
2.3.1 Amount of oxidized CH4during stratification period
An estimate of CH4oxidation was derived from estimation of turbulent diffusion of CH4 across the concentration gradient in the water column and by comparing predicted
15
and observed concentrations in the water column at each meter during the ice-free period (Kankaala et al., 2006a). Estimation of CH4 oxidation by this method was only possible during the stratification period. Results were compared to data from 2007 when concentration changes during 24 h incubations in glass syringes were measured in the laboratory at temperatures prevailing in the lake (Kankaala et al., 2013b).
20
2.3.2 Amount of methane production and process pathway
BGD
11, 16447–16495, 2014
Recycling and fluxes of C gases in a stratified boreal
lake
H. Nykänen et al.
Title Page
Abstract Introduction
Conclusions References
Tables Figures
◭ ◮
◭ ◮
Back Close
Full Screen / Esc
Printer-friendly Version Interactive Discussion
Discussion
P
a
per
|
Discussion
P
a
per
|
Discussion
P
a
per
|
Discussion
P
a
per
|
lost in ebullition was small (results from funnel deployments) and also water flowing out from the lake contained only a small portion of CH4according to the low concentration of CH4 in the epilimnetic water and the small lake outflow. Estimation of the process pathway in CH4 production was based on Whiticar et al. (1986). Here, the assumption was that CH4production in the sediment surface and deep water column affectedδ13
C-5
CH4 and DIC in the bottom water, and thus they were used as values following from methanogenesis. An estimate of hydrogenotrophic production of CH4 was calculated fromδ13C-CH4andδ13C-CO2(Whiticar et al., 1986; Conrad, 2005)
αCO2–CH4=δ
13
CCO
2+1000
δ13C
CH4+1000
(2)
whereαCO2–CH4 =apparent carbon fractionation factor by hydrogenotrophs. In
fresh-10
water sediments, αCO2–CH4>1.065 indicates hydrogenotrophy as the dominant path-way, while αCO2–CH4<1.055 indicates dominance of acetatoclastic methanogenesis (Whiticar et al., 1986).
2.3.3 CO2flows from organic matter degradation leading to CH4formation
Fermentation processes produce H2 or acetate from organic matter. In the
hy-15
drogenotrophic pathway (CO2+4H2→CH4+2H2O) [R1], the required hydrogen (H2) production also generates CO2: 2CH2O+2H2O→2CO2+4H2[R2]; thus the complete
hydrogenotrophic pathway produces one mole of CO2. Formation of acetate (4H2+
2CO2→CH4COOH) [R3] for the acetoclastic pathway (CH3COOH→CH4+CO2) [R4] consumes two moles of CO2 but produces one mole of CH4 and CO2 which is
com-20
pensated by CO2 production in the H2 formation [R2] needed for acetate. Thus, ac-cording to Chanton et al. (2005), both processes producing CH4 can be written as 2CH2O→CH4+CO2, [R5] and the CO2 produced in the whole chain from organic
matter leading to CH4formation is same as the CH4produced, irrespective of the path-way.
BGD
11, 16447–16495, 2014
Recycling and fluxes of C gases in a stratified boreal
lake
H. Nykänen et al.
Title Page
Abstract Introduction
Conclusions References
Tables Figures
◭ ◮
◭ ◮
Back Close
Full Screen / Esc
Printer-friendly Version Interactive Discussion
Discussion
P
a
per
|
Discussion
P
a
per
|
Discussion
P
a
per
|
Discussion
P
a
per
|
Carbon dioxide produced in CH4 oxidation was estimated for the aerobic and anaerobic parts of the water column based on general equations for CH4 oxidation: CH4+2O2→CO2+2H2O [R6] and CH4+SO2−
4 →HCO
−
3+HS
−
+H2O [R7]. Thus in theory aerobic and anaerobic processes produce one mole of C from one mole of con-sumed CH4. However, in practice the portion of CO2 is smaller, as some CH4-C is
5
retained in the biomass of methanotrophs.
2.3.4 Bulk amount of methane-derived biomass and CO2, andδ13C of MOB and
CO2in the water column
Growth yield of methanotrophs was estimated from literature values. In aerobic and anaerobic CH4 oxidation, all CH4 is converted to either biomass or CO2. In general,
10
carbon conversion efficiency (CCE) expressed as percentage of carbon incorporated into cell material for microbial growth on CH4varies from 19 to 70 % (Leak and Dalton, 1986; Roslev, 1997). Rudd et al. (1974) estimated that one third of CH4carbon goes to biomass in lake water column CH4 oxidation. Kankaala et al., 2013b used a range of 10–40 %. Here a CCE value of 44.9 % was used for aerobic oxidation (Leak and Dalton,
15
1986). For AOM there is energy limitation, doubling times are high and CCE is small, 99 % of carbon goes to CO2 and only 1 % to formation of anaerobic methane oxidizer (ANME) biomass (Knittel and Boetius, 1999). Thus 1 % was used here for the value of carbon incorporation to biomass in anaerobic oxidation. In earlier studies AOM did not result in the assimilation of carbon from14C-CH4, while 30–60 % was assimilated
20
in aerobic oxidation of CH4(Panganiban et al., 1978).
A range for possible δ13C of methanotrophic biomass was derived from mea-sured water column δ13C-CH4 and literature values for fractionation between CH4 and methanotrophic biomass.δ13C of biomass is 12.6 ‰ lighter for soluble methane mono ogygenase (sMMO) and 23.9 ‰ lighter for particulate methane mono
oxyge-25
BGD
11, 16447–16495, 2014
Recycling and fluxes of C gases in a stratified boreal
lake
H. Nykänen et al.
Title Page
Abstract Introduction
Conclusions References
Tables Figures
◭ ◮
◭ ◮
Back Close
Full Screen / Esc
Printer-friendly Version Interactive Discussion
Discussion
P
a
per
|
Discussion
P
a
per
|
Discussion
P
a
per
|
Discussion
P
a
per
|
(Alperin et al., 1988); however, Holler et al. (1999) obtained values of 1.012–1.039 for marine anaerobic sediments, and thus values from 1.009 to 1.039 correspond to the range of possible fractionations. Here the expression: ε∼(α−1)·1000 is also used
(ε=fractionation).
A substantial portion of CH4 carbon is assimilated to biomass in aerobic oxidation,
5
while the remaining carbon is lost in respiration as MD-CO2. The CCE value cited above (Leak and Dalton, 1986) was used to estimate the portion of CO2 produced in aerobic CH4 oxidation, this being 100 %−44.9 %=55.1 % as CO2-C. This was also used in mass balance calculation of theδvalue of CO2produced.
In anaerobic oxidation almost all CH4 is estimated to produce CO2 with biomass
10
gain only around 1 %. For CO2from anaerobic oxidation,δ13C-CO2was calculated by mass balance equation when the amount of oxidized CH4, itsδ13C and amount of MD-biomass carbon is known. Since only 1 % goes to MD-biomass formation, theδ13C value of the CO2produced should be almost the same as that of the original CH4.
Production of biomass and CO2 was divided through the water column by
assum-15
ing that CH4 oxidation was anaerobic below depths at which measured redox turned negative. The depth of the detection limit (0.33 mg L−1) for our O2measurementis also shown.
3 Results
3.1 Water column variables
20
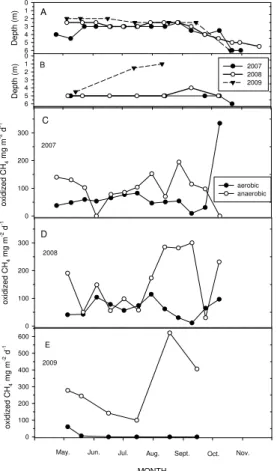
The average water column temperature gradient during stratification was similar during the study years (Fig. 2a). Data logged from spring 2007 to autumn 2008 show the gen-eral pattern of temperature profile development in the water column (Fig. 3): water sur-face temperatures started to decrease in August, while temperatures at greater depths increased until cooling of the air eventually led to cooling of water masses towards
au-25
BGD
11, 16447–16495, 2014
Recycling and fluxes of C gases in a stratified boreal
lake
H. Nykänen et al.
Title Page
Abstract Introduction
Conclusions References
Tables Figures
◭ ◮
◭ ◮
Back Close
Full Screen / Esc
Printer-friendly Version Interactive Discussion
Discussion
P
a
per
|
Discussion
P
a
per
|
Discussion
P
a
per
|
Discussion
P
a
per
|
at the bottom (6 m) increased until the end of October, but decreased rapidly in Novem-ber. In winter, the coldest temperature of 2.2◦C was measured on 11 April 2008 at 1 m,
while the temperature remained above 3.8◦C at 4 m depth.
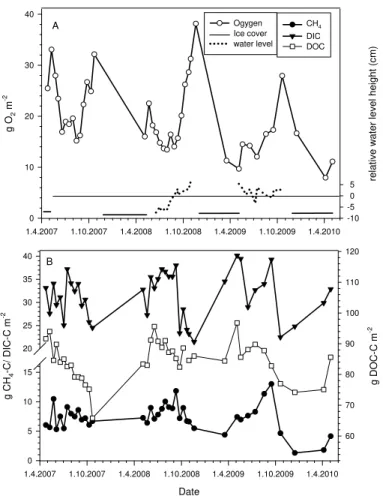
Oxygen concentration was below the detection limit at the bottom during the strat-ification period (Fig. 2b). The total amount of oxygen in the water column (Fig. 4a,
5
Table 1) and the depth of the oxygenated layer (Fig. 5a) increased towards autumn, while at 6 m depth the water was aerobic during overturns in autumn 2007 and 2009, but not in 2008 (Fig. 5a). During the study, the thickness of the aerobic layer decreased (Figs. 2b and 5a). The change in oxygen profile was not due to a change in thermocline depth (see Fig. 2), but due to changes in oxygen consumption, dissolution or its
pro-10
duction pattern. Minimum concentrations of oxygen during the open water period were at the end of July, and also after ice-melt in spring 2009 and 2010 (Fig. 4a). The maxi-mum amount of oxygen in the water column was in May in 2007 and during November in 2008 and 2009 (Fig. 4a). Redox potential was negative at 5 and 6 m depths dur-ing the stratification period (Fig. 2c); durdur-ing 2009 redox was already negative below
15
1 m depth (Fig. 5b). Water level fluctuation was monitored in 2008 and 2009; in 2008 water level increased 10 cm from spring to autumn, while it remained quite stable in 2009 (Fig. 4a). Secchi disc transparency decreased from 2.1 m in 2007 and 2008 to 1.5 m in 2009, so the euphotic zone changed accordingly. However, water colour in the hypolimnion decreased during the study (Table 1). During the stratification period,
20
the water column was clearly stratified with regard to different carbon forms, colour, pH, concentration of dissolved gases and nutrients (2007 data; Table 1). All amounts were highest at the bottom, except oxygen and NO−
2+NO−3, which were lowest at the
bottom (Table 1). Water was acidic, but less so in the hypolimnion. DOC was the dom-inant carbon form in the water column (10.1–20.1 mg L−1), with average totals in the
25
water column during the stratification period of 83.4, 87.9 and 88.5 g m−2in 2007, 2008
BGD
11, 16447–16495, 2014
Recycling and fluxes of C gases in a stratified boreal
lake
H. Nykänen et al.
Title Page
Abstract Introduction
Conclusions References
Tables Figures
◭ ◮
◭ ◮
Back Close
Full Screen / Esc
Printer-friendly Version Interactive Discussion
Discussion
P
a
per
|
Discussion
P
a
per
|
Discussion
P
a
per
|
Discussion
P
a
per
|
C in epi-, meta- and hypolimnion in 2007 (Table 1). Average amount of POC in whole water column was totalling 5.7, 7.1 and 6.8 g m−2 in 2007, 2008 and 2009 (Table 1).
Regarding nutrients, the sum of NO−2 and NO−3 increased from 2007 to 2009, but the total N, NH+4-N, total P and PO−
4-P showed no systematic trend during the study. pH
decreased slightly from the 2007 value, with the greatest decrease in the epilimnion
5
and hypolimnion.
3.2 Primary production and respiration
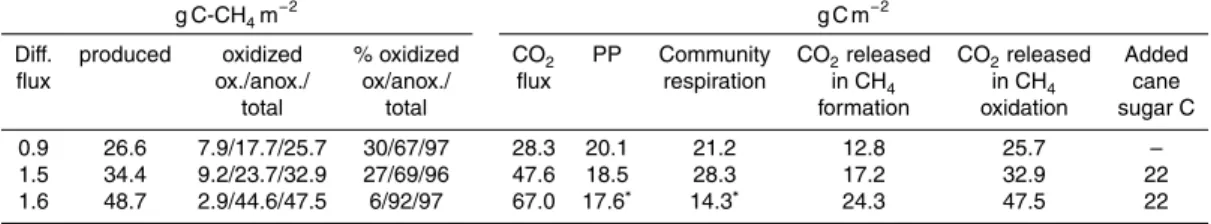
PP was 20.1, 18.5 and 17.6 g C m−2 in 2007, 2008 and 2009 respectively (Table 2).
Consequently, the amount of sugar carbon added in 2008 and 2009 (22 g C m−2) was
comparable to the amount of carbon derived from PP. In 2007, 2008 and 2009
commu-10
nity respiration was 21.2, 28.3 and 14.3 g C m−2. Respiration was higher than the PP in 2007 and 2008. Because dark respiration in 2009 showed net uptake of CO2below 1 m, integrated PP and respiration are calculated for the upper 1 m of the water column.
3.3 Gaseous carbon flows
Dissolved C gas concentrations were highest in the hypolimnion (Table 1, Fig. 6).
15
Methane concentration was highest at the bottom (Figs. 6a, c, e and Fig. S1b in the Supplement), and there was a steep decrease in concentration from the bottom to a depth of 3 m; above 3 m the concentration was stable to the surface (Fig. 6a, c and e, inserts). In general the amount of dissolved gaseous carbon increased during the study; CH4increased from 7.2±1.6 to 9.1±2.5 g CH4-C m−2from 2007 to 2009 (Fig. 4b,
20
Table 1). Total average DIC in the water column increased from 31.1±3.6 g m−2in 2007
to 33.2±4.5 g m−2in 2008 and finally to 35.7±4.6 g m−2in 2009 (Table 1, Fig. 4b).
Emis-sions during the stratification period also increased; most important was the diffusional escape of CO2, which increased from 28.3 g C m−2in 2007 to 76 g C m−2in 2009, while CH4 emissions were smaller and increased from 0.9 g C m−2 in 2007 to 1.6 g C m−2 in
25
BGD
11, 16447–16495, 2014
Recycling and fluxes of C gases in a stratified boreal
lake
H. Nykänen et al.
Title Page
Abstract Introduction
Conclusions References
Tables Figures
◭ ◮
◭ ◮
Back Close
Full Screen / Esc
Printer-friendly Version Interactive Discussion
Discussion
P
a
per
|
Discussion
P
a
per
|
Discussion
P
a
per
|
Discussion
P
a
per
|
Both CH4production and oxidation increased from 2007 to 2009; around 97 % of CH4 produced was oxidized (Table 2). The average in situ production was 161–317 mg CH4 -C m−2d−1. Oxidation patterns were similar during the study years, oxidation
be-ing higher in autumn while the minimum oxidation was measured in early summer (Fig. 5c–e). In general, aerobic oxidation was only 6–30 % of all CH4 oxidation, and
5
was higher in early summer. The estimate for CH4 oxidation of 28.8 g CH4-C m−2
ob-tained with the syringe incubation method during the ice-free period in 2007 (back calculated from Kankaala et al., 2013b) was bigger for this longer period, and thus in the same range as those given here by the diffusion gradient method. Based on the bubble collectors there was no clear ebullition at the lake, but there was an increase
10
in CH4 concentration in funnels, compared to that in the corresponding surface wa-ter: 12.9±2.0 µmol CH4 in the water and 23.5±2.3 µmol CH4 (n=3) dissolved in the gas collectors on 30 October 2008. The increase during the 2 weeks of deployment by 0.4 mg m−2d−1 was considered to be so small that it was not added to CH4 flux or production estimates.
15
Since 67–92 % of oxidation during the stratification period was anaerobic, and anaer-obic oxidation clearly produces more CO2 than biomass, total CO2 production from anaerobic CH4 oxidation was substantial, while that from aerobic oxidation was small (Table 2, Fig. 7).
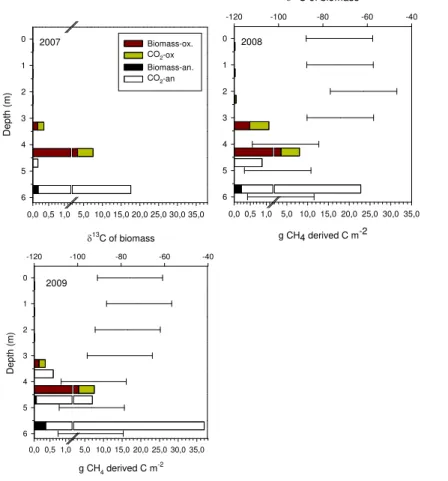
Oxidation of CH4 returned almost all MDC carbon to the water column (Table 3;
20
Fig. 7), mostly as CO2. This CO2(and lack of photosynthesis) is probably seen as in-creased concentration at depths of 3 m in plots of DIC concentration (Figs. 6a, c, e and S1a). Biomass formed anaerobically was clearly smaller than that formed aerobically (Table 3, Fig. 7a–c). The amount of biomass from aerobic CH4oxidation was 75–95 % of all CH4-derived biomass carbon. Biomass δC from CH4 oxidation is relatively13
C-25
BGD
11, 16447–16495, 2014
Recycling and fluxes of C gases in a stratified boreal
lake
H. Nykänen et al.
Title Page
Abstract Introduction
Conclusions References
Tables Figures
◭ ◮
◭ ◮
Back Close
Full Screen / Esc
Printer-friendly Version Interactive Discussion
Discussion
P
a
per
|
Discussion
P
a
per
|
Discussion
P
a
per
|
Discussion
P
a
per
|
Methanogenesis and its preceding steps use CO2from sediment or the deep water column, but also release CO2. The net release of CO2 related to methanogenesis increased from 2007 to 2009 (Table 2).
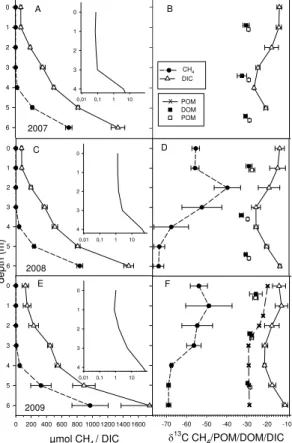
3.4 δ13C of CH4and DIC
In general,δ13C in CH4increased from 2008 to 2009 (Fig. 6d and f) and the difference
5
was statistically significant for depths 4 m (+4.2 ‰), 5 m (+6.9 ‰) and 6 m (+5.5 ‰) (in-dependent samplet test,p <0.05, df=11). However, CH4 at 2 m was 15 ‰ lighter in 2009 than in 2008 (ttest,p <0.05, df=11; Fig. 6d and f). Like CH4, hypolimnetic DIC became13C-enriched during the study (Fig. 6d and f). In 2008 there was enrichment of 1.9 ‰ at 5 m compared to 2007, and between 2007 and 2009 differences were
sta-10
tistically significant for depths 3 m (+2.9 ‰), 4 m (+4.4 ‰) and 5 m (+3.6 ‰), but not in the surface layers. There was also statistically significant13C-enrichment in DIC from 2008 to 2009 at 4 m (+2.7 ‰), 5 m (+1.7 ‰) and 6 m (+1.4 ‰).
In early summerδ13C-CH4was lowest at the bottom, but later in summer the most
13
C-depleted CH4values were measured from 5 m depth (Figs. 8b and S1).δ13C-CH4
15
at the bottom increased from August 2008, while at 5 m depth δ13C-CH4 decreased until autumn overturn induced13C-enrichment. In 2009 the most13C-depleted values were at 5 m (Fig. 8b). There was no statistically significant difference in δ13C-CH4 between depths of 6 and 5 m, but there were differences between 6 m and all other depths in 2008. In 2009δ13C-CH4 values at 5 and 4 m did not differ from values at
20
6 m, while there were statistically significant differences with other depths. Average
δ13C-CH4values at the bottom were−75.0±1.9 ‰ in 2008 and−70.0±1.1 ‰ in 2009.
Mechanically-released bubbles gave a correspondingδ13C-CH4value of−73.6 ‰ (n=
2) in 2008. The average of the most enriched δ13C-CH4 in the water column was
−33.3±9.2 ‰ in 2008 and −45.4±9.3 ‰ in 2009. The fractionation factor (αox) for
25
whole water column CH4 oxidation (calculated from the difference between bottom
BGD
11, 16447–16495, 2014
Recycling and fluxes of C gases in a stratified boreal
lake
H. Nykänen et al.
Title Page
Abstract Introduction
Conclusions References
Tables Figures
◭ ◮
◭ ◮
Back Close
Full Screen / Esc
Printer-friendly Version Interactive Discussion
Discussion
P
a
per
|
Discussion
P
a
per
|
Discussion
P
a
per
|
Discussion
P
a
per
|
2008 and 1.026 in 2009. Almost all of the fractionation occurred in the metalimnion just below the aerobic layer (Fig. 9), where the amount of CH4 was only 1/200–1/300 of that at the bottom, and thus a relatively small oxidation of a small amount of CH4 led to large13C-enrichment. It was not possible to calculateαox for the anaerobic part of water column whereδ13C-CH4 remained similar even though the oxidation of CH4
5
ranged from no oxidation (fox=0) to almost all oxidized (fox=1) (Fig. 9). The maximum average fractionation was between the bottom and 2 m; ε was 37.9 ‰ in 2008 and 17.0 ‰ in 2009. The average depth of the most enriched CH4 followed changes in the oxygen-depth profile in the lake, and increased from 2.2 m in 2008 to 1.7 m in 2009. The location of the most enriched CH4 was narrow (Fig. S1), and the true maximum
10
value could have been missed with our 1 m sampling resolution.
DIC was heavier in 2008 than in 2007 in the whole water column, but there was a statistically significant difference in13C-DIC only at a depth of 5 m (−20.4 ‰ in 2007
and −18.5 ‰ in 2008; t test, p=0.031, df=13). In 2009 DIC was also heavier than in 2007 at all depths, but the difference was statistically significant only for depths 3,
15
4 and 5 m. DIC also became13C-enriched between 2008 and 2009, but the difference was significant only at 4 m. The averageδ13C-DIC at the bottom during the stratifica-tion period was−12.4±0.6 ‰ in 2008 and −11.0±0.7 ‰ in 2009. (In 2007 13C-DIC was not measured from the depth of 6 m). The difference (∼6 ‰) between 5 and 6 m
DIC values was statistically significant (paired samplesttest,p <0.05, df=9 for 2008
20
or 6 for 2009). Averages of the most depleted DIC values in the water column were
−24.9±1.7 ‰,−23.2±2.2 ‰, and−21.2±2.0 ‰ in 2007, 2008 and 2009, respectively.
The change in the water column δ13C-DIC was smooth compared with the change in δ13C-CH4 (Figs. 6b, d and f and S1). The depth of the most 13C-depleted DIC was 1.5–2 m lower than that the depth of the most 13C-enriched values of CH4. On
25
27 August 2008 when sampling resolution was 0.5 m, this difference was 1.5 m (min.
δ13C-DIC at 4 m and max.δ13C-CH4at 2.5 m; Fig. S1). On average, the most depleted
BGD
11, 16447–16495, 2014
Recycling and fluxes of C gases in a stratified boreal
lake
H. Nykänen et al.
Title Page
Abstract Introduction
Conclusions References
Tables Figures
◭ ◮
◭ ◮
Back Close
Full Screen / Esc
Printer-friendly Version Interactive Discussion
Discussion
P
a
per
|
Discussion
P
a
per
|
Discussion
P
a
per
|
Discussion
P
a
per
|
The fractionation factor (fCO2–CH4), between average bottomδ13CO2andδ13C-CH4, decreased from 1.068±0.002 in 2008 to 1.064±0.002 in 2009, indicating that CH4
was mainly from hydrogenotrophic processes, but there might have been a slight shift towards more acetogenesis in CH4production.
3.5 δ13C of CH4derived C
5
Depending on the processes responsible for CH4oxidation, the microbial biomass us-ing CH4as a carbon source could have hadδ13C ranging from−114 to−79 ‰ (Table 3,
Fig. 7b and c). Similarly, DIC derived from CH4oxidation could have hadδ13C from−68 up to−38 ‰ in aerobic CH4 oxidation, while CO2 from anaerobic CH4 oxidation had
almost similar δ13C value as the original CH4 since only 1 % went to MOB carbon
10
(Table 3). The amount of oxidized CH4in different regions of the water column shows that there was a change in the pattern of CH4 oxidation during the study. Methane-derived biomass at greater depths had the lowest δ13C (Fig. 7b and c), and most of this biomass was at depths below 3 m. Similarly, depleted CO2 was formed at the bottom where production from CH4oxidation was also highest. A small amount of CH4
-15
derived CO2was produced in shallower water (Fig. 7a–c), whereδ13C-CO2increased. In the illuminated layer of active photosynthesis, CH4 oxidation was also minimal due to lack of CH4. Thus the effect of methanotrophy on DIC production and algal biomass
δ13C was small at the surface as was formation of methanotrophic biomass. In 2009 CH4oxidation could have been more active in the euphotic zone, and thus could have
20
affected the algal and zooplanktonδ13C.
3.6 δ13C of other carbon pools
moder-BGD
11, 16447–16495, 2014
Recycling and fluxes of C gases in a stratified boreal
lake
H. Nykänen et al.
Title Page
Abstract Introduction
Conclusions References
Tables Figures
◭ ◮
◭ ◮
Back Close
Full Screen / Esc
Printer-friendly Version Interactive Discussion
Discussion
P
a
per
|
Discussion
P
a
per
|
Discussion
P
a
per
|
Discussion
P
a
per
|
ately lighter than POM. Both were also slightly more13C-depleted in the metalimnion than in the epi- and hypolimnion.
δ13C-POM measurements on 15 September 2009 from different depths down the water column at 1 m resolution corresponded well to averages for the meta- and hy-polimnion, but differed in the epilimnion (Fig. 6f). This is possibly due to different
pro-5
cesses in the epilimnion affecting the POMδ13C in autumn when the water layers are mixing, which is not strongly reflected in ice-free average values.
Algae sampled on 1 July 2009 straight from a surface scum had δ13C value of
−29.8 ‰ compared with δ13C-DIC of −13.7 to −14 ‰ at the same time at the same
depth; thus fractionation between DIC and algae was∼17 ‰. Material floating above
10
the bottom sediments (probably sedimented algal material from the previous summer) sampled in early spring under ice (6 April 2010) was depleted to−32.8 ‰. Biofilm from
aluminium tubes used in incubation experiments had δ13C of around −24 ‰ at the surface (with contact to the atmosphere) and−27.2 ‰ at 0.2 and 1 m depths, but was
depleted to−36.0 ‰ at 2 m. Larvae of the phantom midge (Chaoborussp.), migrating 15
daily between the bottom and the oxygenated surface, had averageδ13C of−31.2±3.8 (n=20) between 14 August 2007 and 3 May 2010, but individualδ13C values ranged from−37.9 to−25.4 ‰.
4 Discussion
4.1 Effect of added carbon
20
In general, the addition of sugar carbon changed processes in the lake, but CH4 oxida-tion and MDC formaoxida-tion were essentially similar to the reference year 2007, and typical of this kind of stratified lake.
CH4 efflux during the stratification period doubled from 2007 to 2009, while CO2 efflux almost tripled. Calculations based on global warming potential for a 100 year
25
BGD
11, 16447–16495, 2014
Recycling and fluxes of C gases in a stratified boreal
lake
H. Nykänen et al.
Title Page
Abstract Introduction
Conclusions References
Tables Figures
◭ ◮
◭ ◮
Back Close
Full Screen / Esc
Printer-friendly Version Interactive Discussion
Discussion
P
a
per
|
Discussion
P
a
per
|
Discussion
P
a
per
|
Discussion
P
a
per
|
was the most important greenhouse gas emitted from the lake and even more so after sugar addition. Emission of CO2 was substantial, but was smaller than that measured by Eddy Covariance at the nearby lake Valkea Kotinen (Huotari et al., 2011). However, methods based on surface concentration generally give lower estimates of fluxes for CO2 and CH4than Eddy Covariance (Schubert et al., 2012). Furthermore, efflux was
5
calculated only for the stratified period, and fluxes during overturn when water masses rich in CO2 and CH4 come into contact with the atmosphere are not included, so our values certainly underestimate annual emissions.
Although DOC amount was increased by sugar addition, there was no clear in-crease in epilimnetic heterotrophy, probably due to shortage of mineral nutrients (Peura
10
et al., 2014). Addition of labile carbon as sugar probably increased nutrient competi-tion between bacteria and algae favouring bacteria, and this decreased the amount of nutrients from 2007 to 2008 (Table 1) as demonstrated by Tammert et al. (2012) in mesocosm experiments with glucose addition.
Our addition of 44 g C m−2 during 2008 and 2009 led to
∼60 g C m−2 increase in C 15
fluxes to the atmosphere during the stratification period. Peura et al. (2014) explained the increased flux in Alinen Mustajärvi by increased anaerobic respiration and fermen-tation in the hypolimnion and by increased degradation of DOC in the meta- and hy-polimnion. Furthermore, the thinner epilimnion increased DIC-rich water masses in the upper water column, and this physical change also increased efflux of CO2 and CH4.
20
Here it was possible to study the fate of CH4 by methane oxidation, and as produc-tion of CH4increased, both aerobic and anaerobic CH4oxidation increased leading to a substantial increase in CO2 formation. However, most of this increase in CO2 pro-duction from CH4 was in the anaerobic bottom layers and upward diffusion from there can partly account for the increased concentration of CO2 in surface layers and the
25
increased CO2efflux.
C-BGD
11, 16447–16495, 2014
Recycling and fluxes of C gases in a stratified boreal
lake
H. Nykänen et al.
Title Page
Abstract Introduction
Conclusions References
Tables Figures
◭ ◮
◭ ◮
Back Close
Full Screen / Esc
Printer-friendly Version Interactive Discussion
Discussion
P
a
per
|
Discussion
P
a
per
|
Discussion
P
a
per
|
Discussion
P
a
per
|
DIC values from lakes to compare if this kind of fluctuation inδ13C occurs naturally in stratified lakes, but unless autochthonous or allochthonous carbon inputs are changing it is unlikely. Direct aerobic respiration of the cane sugar would produce an enriched
13C signal in DIC, as cane sugar is
∼16 ‰ heavier than the natural DOM or POM in
the lake; in fact enrichment was clear in the hypolimnion but not clear in the epilimnetic
5
DIC. Thus enriched DIC was available to be incorporated into algae, possibly seen in POMδ13C values following those of DIC at 0–2.5 m depth (Fig. 6f), and generally becoming enriched during the study (Peura et al., 2014).
It is unclear whether the 13C-enrichment in CH4 and DIC in deep layers (4, 5 and 6 m) was due to changes in the microbial and algal biomass and zooplankton food web
10
structure, as documented for the epilimnion (Peura et al., 2014), leading to sedimen-tation of this enriched carbon source towards the bottom. The change could also have been due to a direct effect of the added carbon source, which partly flocculated and sunk to the bottom where it was used as a substrate in methanogenesis. A third expla-nation could be a change in the lake anaerobic metabolism due to physical changes,
15
leading gradually to a shift from hydrogenotrophic methanogenesis towards acetoclas-tic methanogenesis, as fractionation factors were shifting in the direction of acetoclasacetoclas-tic methanogenesis. In addition, increased CH4production leads to gradual enrichment of
δ13C of CH4 and DIC because the carbon source gets progressively enriched as the light isotopes are used preferentially. Evidence for this increased use of carbon comes
20
from the increased C fluxes and the decrease in total amount of TOC towards 2009. However, with current data the ultimate reason for the hypolimnetic enrichment inδ13C of CH4and DIC remains unresolved.
The first δ13C-DIC andδ13C-CH4 measurements in 2008 were before sugar addi-tion and from a depth of 6 m. There was a small increase in bottom δ13C-DIC after
25
carbon addition in spring 2008 as there had been in the reference year 2007 before any additions were made, whereasδ13C-CH4decreased at the depths of 5 and 6 m.
BGD
11, 16447–16495, 2014
Recycling and fluxes of C gases in a stratified boreal
lake
H. Nykänen et al.
Title Page
Abstract Introduction
Conclusions References
Tables Figures
◭ ◮
◭ ◮
Back Close
Full Screen / Esc
Printer-friendly Version Interactive Discussion
Discussion
P
a
per
|
Discussion
P
a
per
|
Discussion
P
a
per
|
Discussion
P
a
per
|
DIC enriched. A Keeling plot estimate for δ13C-DIC produced from dark incubation of epilimnetic water in situ in 2009 (data not shown) gave an estimate for respired
δ13C-DIC of−14.1 ‰; together with the preferential diffusional losses of light12CO2to atmosphere this could well lead to theδ13C-DIC values detected in the epilimnion.
4.2 Recycling of carbon in the water column
5
As oxidation (and production) of CH4 was high before sugar carbon addition to whole lake, it is evident that Alinen Mustajärvi was not only a natural “hot spot” for methano-genesis, but also capable of oxidizing considerable amounts of CH4 and processing it to biomass and CO2. High CH4 production is possible as the bottom receives new organic carbon sedimenting from the surface at the same time as older carbon is
pro-10
cessed. Furthermore, even though the increase in lake bottom temperature from spring to late autumn is small (from 4.3 to 5.8◦C in 2007 and from 4.3 to 5.2◦C in 2008), with the generalQ10 value of 4 (Yvon-Durocher et al., 2014) the production rate would
in-crease 13–23 % thus maintaining production of CH4from older stores when substrate rain ceases in late autumn. Even though the measurement site was the deepest point
15
of the lake, the difference in depth is not so great that the deep point will receive addi-tional sediment from the sides.
Almost all of the CH4produced in the small stratified lake Alinen Mustajärvi was ox-idized in the water column, as seen from the low surface concentrations, small CH4 effluxes and also the clear 13C-enrichment of CH4 up the water column. The in situ
20
incubation method to estimate the CH4 oxidation in 2007 and the independent calcu-lation by the diffusion gradient method gave comparable results, so we are confident that our oxidation estimates are reliable. Production and oxidation of CH4 was an im-portant part of the lake carbon metabolism and quantitatively and qualitatively affected the carbon cycle.
25
BGD
11, 16447–16495, 2014
Recycling and fluxes of C gases in a stratified boreal
lake
H. Nykänen et al.
Title Page
Abstract Introduction
Conclusions References
Tables Figures
◭ ◮
◭ ◮
Back Close
Full Screen / Esc
Printer-friendly Version Interactive Discussion
Discussion
P
a
per
|
Discussion
P
a
per
|
Discussion
P
a
per
|
Discussion
P
a
per
|
period that was oxidized is consistent with other studies; e.g. from a Japanese lake, where 74 % of all CH4 was oxidized (Utsumi et al., 1998) and from a Finnish lake, where on an annual basis 79 % was consumed in the water column by methanotrophs (Kankaala et al., 2006a). Schubert et al. (2011, 2012) also stressed the importance of CH4oxidation, which was consuming 75 % of the CH4in Lakes Lugano and Rotsee.
5
The oxidation measured in Alinen Mustajärvi (annually and per day) was at the upper end of the range reported previously from lakes, whereas the emissions of CH4to the atmosphere were at the lower end of the reported range (Bastviken et al., 2004). How-ever, even after the substantial DOC addition as sugar, the CH4 emissions are more at the level of estimates by Juutinen et al. (2009) than those of Bastviken et al. (2004)
10
for boreal lakes. Bastviken et al. (2011) estimated ebullition to be∼88 % of all
emis-sions of CH4 to the atmosphere from lakes at the same latitude as Alinen Mustajärvi. Rasilo et al. (2014) used an estimate for ebullition of 9 % of total efflux for Canadian boreal lakes. Ebullition was insignificant in Alinen Mustajärvi, as it was in the nearby lake Valkea-Kotinen (Kankaala et al., 2006a). Carbon input as peat from degrading
15
lake shores led to huge ebullition from Siberian thaw lakes (Zimov et al., 1997), but our sugar addition was dissolved and easily degradable carbon, which was used at least partly in the aerobic zone by microbes (Peura et al., 2014); more recalcitrant peat is a less readily available carbon source and also forms physical barriers on the lake bottom.
20
Schubert et al. (2012) reported CH4 oxidation of 5.3 g C m−2 in the oxic layer and
24.8 g C m−2 in the whole water column in Lake Lugano, with efflux of 4.1 g C m−2. In Lake Rotsee oxic oxidation was 7 g C m−2 and that of the whole water column
33.0 g C m−2, and e
fflux 5.4 g C m−2 (Schubert et al., 2011). These estimates are
sim-ilar to ours for Alinen Mustajärvi and simsim-ilarly showed the overwhelming importance
25
BGD
11, 16447–16495, 2014
Recycling and fluxes of C gases in a stratified boreal
lake
H. Nykänen et al.
Title Page
Abstract Introduction
Conclusions References
Tables Figures
◭ ◮
◭ ◮
Back Close
Full Screen / Esc
Printer-friendly Version Interactive Discussion
Discussion
P
a
per
|
Discussion
P
a
per
|
Discussion
P
a
per
|
Discussion
P
a
per
|
the stratified period was similar to that found by Liikanen et al. (2002) for the profundal water column of eutrophic Lake Kevätön.
In Alinen Mustajärvi more CH4 was oxidized in the anaerobic part of the water col-umn which does not support earlier findings that CH4oxidation in freshwaters is most active in the vicinity of the oxic–anoxic interface or oxycline, where both CH4and O2are
5
available (Rudd et al., 1974; Lidstrom and Somers, 1984; Bastviken et al., 2008). Liika-nen et al. (2002) also reported highest oxidation rates in a eutrophic lake hypolimnion during stratification when the bottom had the highest CH4concentrations. Even though in Alinen Mustajärvi the change inδ13C-CH4showing CH4oxidation was greatest in the oxycline, the amount of CH4there was so much less than at the bottom that the actual
10
quantity of CH4oxidized there was small.
The detection limit for our oxygen measurements leaves open the possibility that there was still some residual O2 available for oxidation. Blees et al. (2014) explained CH4oxidation in Lake Lugano by (micro-)aerobic methane oxidation (MOx), in the zone where oxygen concentration was sub-micromolar and not detectable with traditional
15
techniques. This might have been the case in our study, since we were not able to mea-sure sub-micromolar concentrations of O2. However, there are other indicators that the lake hypolimnion was truly anaerobic: redox was negative, there was sulphide in water column, and pH in the hypolimnion was higher in line with production of basic cations by AOM. Blees et al. (2014) did not report redox values from their study. However, in
20
our study there was CH4oxidation in layers where redox was negative. Thus, the expla-nation for the CH4 fate may be anaerobic oxidation of CH4(Eller et al., 2005) or nitrite reducers providing directly molecular oxygen for methanotrophs in anoxic systems (Et-twig et al., 2010). There was a suite of alternative electron acceptors available, of which nitrate was measured, while the smell of H2S compounds was evident in samples from
25