61 © Author(s) 2007. This work is licensed
under a Creative Commons License.
Implications of changing from grazed or semi-natural vegetation
to forestry for carbon stores and fluxes in upland organo-mineral
soils in the UK
B. Reynolds
Centre for Ecology and Hydrology, Bangor, Gwynedd LL57 2UP, Wales, UK
Email: [email protected]
Abstract
In the UK, as organo-mineral soils are a significant store of soil organic carbon (SOC), they may become increasingly favoured for the expansion of upland forestry. It is important, therefore, to assess the likely impacts on SOC of this potentially major land use change. Currently, these assessments rely on modelling approaches which assume that afforestation of organo-mineral soils is carbon neutral. This review evaluates this assumption in two ways. Firstly, UK information from the direct measurement of SOC change following afforestation is examined in the context of international studies. Secondly, UK data on the magnitude and direction of the major fluxes in the carbon cycle of semi-natural upland ecosystems are assessed to identify the likely responses of the fluxes to afforestation of organo-mineral soils. There are few directly relevant measurements of SOC change following afforestation of organo-mineral soils in the UK uplands but there are related studies on peat lands and agricultural soils. Overall, information on the magnitude and direction of change in SOC with afforestation is inconclusive. Data on the accumulation of litter beneath conifer stands have been identified but the extent to which the carbon held in this pool is incorporated into the stable soil carbon reservoir is uncertain. The effect of afforestation on most carbon fluxes is small because the fluxes are either relatively minor or of the same magnitude and direction irrespective of land use. Compared with undisturbed moorland, particulate organic carbon losses increase throughout the forest cycle but the data are exclusively from plantation conifer forests and in many cases pre-date current industry best practice guidelines which aim to reduce such losses. The biggest uncertainty in flux estimates is the relative magnitude of the sink for atmospheric carbon as trees grow and mature compared with that lost during site preparation and harvesting. Given the size of this flux relative to many of the others, this should be a focus for future carbon research on these systems.
Keywords: soil carbon, land-use change, forestry, organo-mineral soils, carbon fluxes, uplands
Introduction
As a party to the United Nations Framework Convention on climate change, the UK is required to protect and enhance the sinks and reservoirs for greenhouse gases. Within the UK, approximately 30% (1357 Tg to a depth of 1 m) of the soil organic carbon (SOC) stock is held in organic (peat) soils with a further 22% in organo-mineral soils (Bradley et al., 2005). In relation to land use, only 9% of the UK SOC stock resides in forest and woodland soils, although the carbon density of these soils is relatively high (25 kg m2
or 250 tC ha1) compared with pasture and arable soils (16
and 12 kg m2 or 160 and 120 tC ha1 respectively; Bradley
et al., 2005). Organo-mineral soils may well become increasingly important for the future expansion of forestry
in the uplands if the extensive grazing agriculture they currently support becomes economically marginal because of CAP reform. An assessment of the likely effects of this potentially major change in land use on SOC stocks is, therefore, required.
62
SOC is concerned, Cannell et al., (1999) consider three types of soil; peats, upland organo-mineral soils and mineral soils. For the purposes of the carbon inventory, the last named are assumed to be planted with broadleaved trees and are predicted to gain SOC as the trees add substantial quantities of litter to soils, including former agricultural land with relatively low organic matter content (Cannell and Dewar 1995). For peats, information from field measurements of net ecosystem carbon exchange suggest that there will be a small net source of carbon resulting from the effects of drainage and soil drying by the trees (Hargreaves et al., 2003). Upland organo-mineral soils under plantation conifer forest are considered to be carbon neutral, having gained as much carbon from forest litter as has been lost through accelerated decomposition during site preparation and drainage. The purpose of this review is to evaluate this assumption.
Planting trees can affect the ecosystem carbon balance in two opposing ways. Firstly, drainage and disturbance during site preparation and planting may lead to higher SOC losses as increased microbial respiration rates, aeration and disruption of soil aggregates lead to higher rates of organic matter decomposition. Secondly and conversely, carbon will be sequestered by tree growth and needle fall will contribute to the accumulating litter layer at a faster rate than for the pre-existing ground vegetation. Tree roots and root litter will also contribute to the below ground carbon stock.
This review considers two primary approaches to assessing the likely effects of changing land-use from grazed acid grassland or semi-natural vegetation to forestry on SOC in organo-mineral soils of the UK. These are: (1) direct measurement of change in soil organic carbon, and (2) measurement of biogeochemical fluxes to produce a carbon budget.
As there are relatively few directly relevant studies, the review will draw on studies of related systems to draw
inferences and conclusions about the likely effects of afforestation on the SOC balance of organo-mineral soils.
Direct measurement of change in soil
organic carbon
Relatively few data are directly relevant to describing the effects on SOC accumulation following the conversion of land on organo-mineral soils in the UK from permanent, extensively grazed grassland/semi-natural moorland to forestry. Changes in carbon accumulation in peat following drainage and afforestation have been measured directly at Lochar Moss (Harrison et al., 1997) and Mindork Moss (Jones et al., 2000) using C:Pb ratios to determine the change in the carbon stock to the ploughed depth (Table 1)
Although the sites differed considerably in productivity, the changes in SOC were similar and equally variable. At Mindork Moss, the authors concluded that the effect of tree planting on the peat was carbon neutral whereas Harrison et al. (1997) proposed that Lochar Moss was accumulating carbon because of the greater productivity of Lochar Moss, where the inputs of needle, branch and root litters were much higher than at Mindork Moss. Changes in SOC storage in the upper organic-rich horizons of mature forest were measured in 1949/50 by FitzPatrick (1951) and re-sampled some 38 years later by Billett et al. (1990). The fifteen soil profiles were located in stands planted in the 1880s and 1930s. The organic carbon concentration in the soil declined by approximately 5%, although carbon stocks had increased due to an increase in the depth of the horizon (Table 2)
Numerous soil properties were measured at Gisburn Forest and compared with data collected from grassland control plots (Moffat and Boswell, 1990). There were few significant differences in soil characteristics between grassland control and tree plots after 32 years of forest growth, partly because, across the site, natural variation in many soil properties
Table 1. Measured carbon change since planting in afforested peatlands in SW Scotland (Harrison et al., 1997; Jones et al., 2000; positive notation represents accumulation by the soil).
LOCHAR MOSS MINDORK MOSS
Site characteristics Sheltered low altitude, Wet, exposed, high productivity low productivity
(YC 16) (YC 10-12)
Time since planting 28 26 (years)
Peat carbon change 25.2 to +19.6 20.8 to +36.4 (t C ha-1
63 confounded tests for species effects. There was little
difference in soil organic carbon concentration in the A horizon expressed as % loss-on-ignition (% LOI) between the tree species (pine, oak, alder and spruce) and grazed plots; the ungrazed plots had significantly higher LOI. There were variations in horizon thickness, with conifers having thicker F and H horizons but thinner A horizons compared with the other treatments. Unfortunately, bulk density data were not available so that SOC stocks could not be estimated. In Wales the amounts of carbon stored in the L and F layers have been measured at a chronosequence of Sitka spruce stands aged between 14 and 55 years (Stevens et al., 1994). The quantity of carbon held in the undecomposed litter (L) layer increased sharply to a maximum of c. 4 tC ha1 at age 25 and then, with the exception of one site,
decreased steadily with age (Fig. 1).
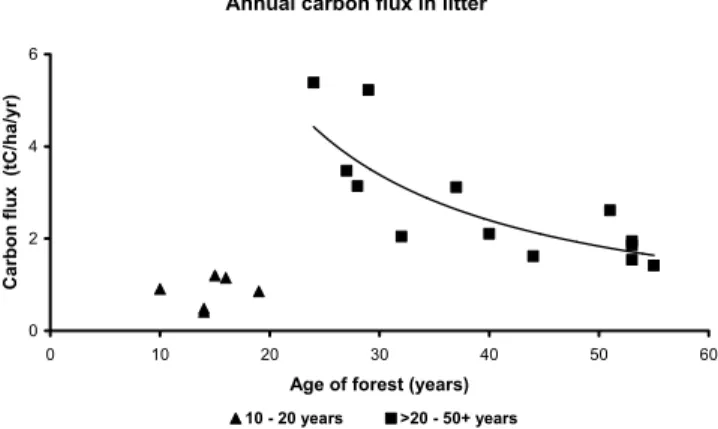
The input of falling litter followed a similar pattern although the decrease over time from a maximum of 5.5 tC ha1 yr1 at age 24 was much steeper (Fig. 2). Quantities of
litter deposited in older (c. 1.4 tC ha1 yr1 at 50+ years)
stands were only slightly greater than in young stands (<20 yrs). Overall, the litter carbon pool accounted for approximately 2.6 tC ha1 (1.2 to 3.8 tC ha1) or 16% of the
L+F layer carbon pool. There was a steep increase in F layer carbon storage with age up to 53 years (Fig.3) where the
maximum amount of carbon was measured (26 tC ha1).
However, at the oldest site (Beddgelert Forest, 55 years), the F layer carbon store amounted to only 8 tC ha1 with 2
tC ha1 stored in the L layer. This suggests that carbon may
have been lost from surface horizons at this site which is very nitrogen-rich and has a relatively open canopy.
In an extensive literature survey, Post and Kwon (2000) provide a geographically wide-ranging summary of soil carbon accumulation rates during forest establishment after Table 2. Changes in SOC in Alltcailleach Forest between 1949/50 and 1987 (Billett et al.,
1990; positive notation represents accumulation by the soil).
Old stand Younger stand
Change in thickness (cm) +6 (0 to +10) +3.5 (0 to +8) Change in carbon concentration (%C) 6.0 (11.3 to +0.3) 4.5 (18.3 to +17.4) Change in SOC store (gC m2
yr1
) +56.8 (2.2 to +115.1) +21.1 (34.0 to +60.2)
Fig. 1. Changes in L horizon carbon pool over time in a chronosequence of Sitka spruce plantations in Wales (CEH unpublished data).
Litter (L) horizon carbon pool
0 1 2 3 4 5
0 10 20 30 40 50 6
Forest age (years)
C
a
rbon pool (tC
/ha)
0
10-20 yrs >20 - 50+ yrs
Annual carbon flux in litter
0 2 4 6
0 10 20 30 40 50 6
Age of forest (years)
Car
bon flux
(tC/ha/yr)
0
10 - 20 years >20 - 50+ years
Fig. 2. Changes in the falling litter carbon flux over time in a chronosequence of Sitka spruce plantations in Wales (CEH unpublished data).
'F' layer carbon pool
0 10 20 30
0 10 20 30 40 50 6
Forest age (years)
C
a
rbon p
ool (T C
/ha)
Beddgelert forest
0
64
agricultural use. The systems considered range from cool temperate forest to wet tropical forest and rates of soil carbon accumulation vary widely from very large losses of 51 gC m2 yr1 following intensive site preparation in subtropical
moist forest to very large accumulation rates of 300 mgC m2 yr1 in subtropical wet hardwoods. In cool temperate
moist forest systems, accumulation rates ranged from small losses of the order 34 gC m2 yr1 to accumulations of 66 gC
m2 yr1. In general, accumulation rates increased from
temperate to subtropical systems.
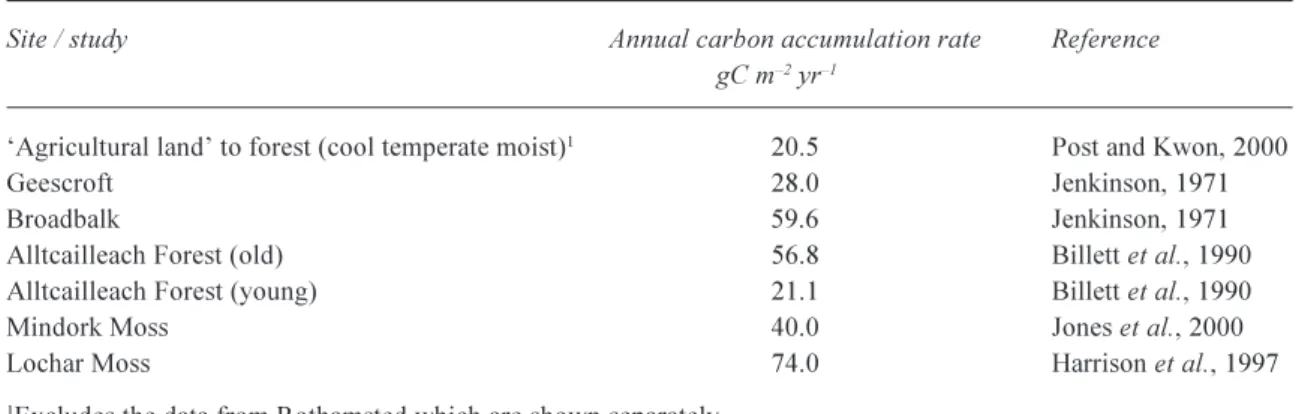
The data for cool temperate moist forest systems provided by Post and Kwon (2000) are summarised in Table 3, omitting studies of the conversion of mine spoil and constructed systems to forest. Table 3 also shows annual carbon accumulation rates for the studies described above (Billett et al.,1990; Harrison et al., 1997; Jones et al., 2000) and data from the Rothamsted long-term experiments at Geescroft Wilderness and Broad-balk Wilderness (Jenkinson, 1971).
The data in Table 3 suggest that conversion of land to forest results in SOC accumulation, even in systems where drainage and disturbance have preceded forest planting. Furthermore, the data from Alltcailleach Forest indicate that carbon is continuing to accumulate in mature forests. However, important caveats have to be applied to the interpretation of these data.
There are significant potential sources of error in the direct measurement of change in carbon stocks in forest soils. A high degree of spatial variation is often encountered in forest soil carbon measurements (Huntington et al., 1988; Trettin et al., 1999) especially at sites which have been disturbed by drainage and ploughing. Conen etal. (2004) noted that the variance in the estimate of soil carbon stocks in temperate and boreal forests increased with mean carbon content. In the extreme case of a disturbed site with a large soil carbon content, in excess of a thousand samples may be required
to detect a soil carbon change of 5 tC ha1. The depth of soil
sampling can also affect the measurement, as soils can change with respect to depth and bulk density in response to forest development (Jenkinson, 1971; Cannell et al., 1993).
The comparison of annual rates of change in soil carbon can be misleading. Soussana et al., (2004) used a database of 19 000 unpublished records of carbon stocks in French soils to model changes in response to various land-use change scenarios. They noted that soil carbon accumulation rates are non-linear; following a change in land use, high initial rates would later slow down as a new equilibrium is reached. The time to reach equilibrium will be determined by factors such as the ability of the soil to stabilise carbon, the prevailing climate, the quality of the added carbon and the balance between carbon inputs and losses through respiration (Freibauer et al., 2004). In the case of plantation forestry on organo-mineral soils, initial losses of carbon due to site preparation may be compensated for later. The implication is that the annual accumulation rate will depend on the time period covered by the measurement.
Some studies reported by Post and Kwon, (2000) recorded a loss of carbon at depth in the profile, whilst observing accumulation at the surface. In these cases, organic carbon inputs during early growth of the forest were insufficient to replenish decomposition losses lower in the profile. A decrease in the recalcitrant soil organic carbon pool was predicted by the MERLIN model in a simulation of planting and growth of a 30 year old Sitka spruce plantation which replaced moorland vegetation growing on acid peaty podzols in north Wales (Emmett et al., 1997). The data used to parameterise the model, which came from a chronosequence of Sitka spruce plantations on similar soils, showed, however, a net accumulation of organic carbon by the ecosystem, both as new wood and in the labile soil organic matter pool mainly in the forest floor. Evidence of a loss of
Table 3. Summary of annual soil organic carbon accumulation rates
Site / study Annual carbon accumulation rate Reference
gC m2 yr1
Agricultural land to forest (cool temperate moist)1
20.5 Post and Kwon, 2000
Geescroft 28.0 Jenkinson, 1971
Broadbalk 59.6 Jenkinson, 1971
Alltcailleach Forest (old) 56.8 Billett et al., 1990 Alltcailleach Forest (young) 21.1 Billett et al., 1990 Mindork Moss 40.0 Jones et al., 2000 Lochar Moss 74.0 Harrison et al., 1997
1
old soil organic carbon during forest development also
comes from a study of the 14C signal in soil solution dissolved
organic carbon (DOC) by Karltun et al. (2005). Samples of DOC were collected from the transition zone between the A and B soil horizons of a forest chronosequence comprising twelve sites in southwest Sweden, ranging from agricultural land to 89 year old, first generation Norway spruce. In order to explain the observed changes in 14C signal along the
chronosequence, the authors proposed that two processes were occurring simultaneously; namely changes in litter input and increased mobilisation of soil organic carbon formed before afforestation. The implication is that any assessment of SOC stock change in response to afforestation must extend down to the base of the rooting zone in order to account for potential losses of SOC from the subsoil as well accumulation at the soil surface.
Guo and Gifford (2002) reported a meta-analysis of studies on the effects of land-use change on soil organic carbon stocks. Analysis of 83 observations (dominated by studies from New Zealand) on the conversion of pasture (including semi-natural grassland) to plantation forest showed an overall decline in soil organic carbon stocks of 10%. Planting broadleaved trees had little effect on soil organic carbon stocks but conifers (mainly Pinus radiata) reduced organic carbon stocks by 12%. The effect on organic carbon stocks was related strongly to rainfall amount. Little effect was observed at lower rainfall sites (<1200 mm) but, where annual rainfall exceeded 1500 mm, there was a significant reduction in soil organic carbon (23%). The implication that, in areas of high annual rainfall, carbon leaching is important was not supported by analysis of soil sampling depth. However, carbon may have been lost by percolation and runoff, rather than simply being re-deposited lower in the soil profile, especially on steeply sloping sites.
UK studies of carbon exchange in
conversion of semi-natural grassland
and moorland ecosystems to
plantation forestry
Components of the carbon budget have been studied to evaluate the effects on the SOC balance of establishing forest plantations on semi-natural moorland and grassland on peats and organo-mineral soils. However, none of these has produced a complete biogeochemical budget for this change in land use, making it necessary to piece together evidence from a range of appropriate studies.
ESTIMATES OF CHANGES IN NET CO2 EXCHANGE
FOLLOWING AFFORESTATION OF PEATS
Some of the most detailed field measurements of net exchange of CO2 (eddy covariance method + supporting meteorological data) have been undertaken in forests planted on deep peats in Scotland (Hargreaves and Fowler, 2000; Hargreaves et al., 2003). At the Auchencorth Moss site, flux modelling using relationships between daytime negative fluxes and solar radiation and night time positive fluxes and temperature has been used to infill missing field measurements and to estimate annual fluxes.
The annual net exchange of CO2 for undisturbed peat lands estimated from these studies (Table 4) indicates that peat lands act as a net sink for CO2 from the atmosphere. Following further measurements, the figures for Auchencorth Moss have been revised upwards to a mean annual rate of 27.8 gC m2 yr1 (SE = +/ 2.5 ; Billett et al.,
2004). Even so, this is much less than the mean range for UK peat lands provided by Immirzi et al. (quoted in Hargreaves et al., 2003) of 0.4 to 0.7 tC ha1 (40 to 70 gC
m2 yr1). Net surface exchange measurements are subject
to uncertainty caused by variations in the type and age of peat and the prevailing weather (Billet et al., 2004;
Table 4. Net ecosystem exchange of CO2 for undisturbed peatlands (Hargreaves and Fowler 2000; carbon sink is
given a negative notation as it represents depletion of atmospheric carbon)
Site Annual net CO
2 exchange Cumulative net CO2 exchange over
gC m2 yr1 27yearst, C ha1
Undrained peatland at Auchencorth Moss,
SE Scotland, 270 m altitude 22 6.0 Undisturbed peat at Mindork Moss,
low productivity forest in SW Scotland,
66
Hargreaves et al., 2003)
To simulate the effect of drainage and afforestation of peat land on net CO2 exchange, the flux model developed at Auchencorth Moss was parameterised with values from field campaigns of measurement at four afforested peat land sites representing a chronosequence of development from 14 years, 8, 9 and 26 years. Simulations based on the climate at Mindork Moss (Hargreaves et al., 2003) showed that in the first two years following drainage, the site acted as a net source of CO2 (2 to 4 tC ha1 yr1) and returned to
becoming a net sink by year five. If the loss from peat occurred only in the first four years following disturbance, the maximum total loss would be +9.0 tC ha1 (Table 5). By
year 26, the cumulative exchange of CO2 was 54 tC ha1,
representing an enhancement of 44.2 tC ha1 over and above
unafforested peat land (Tables 4 and 5).
Using the climate data for Auchencorth Moss, the predicted net exchange of CO2 resulting from simulated drainage and afforestation was similar to that at Mindork Moss (Hargreaves and Fowler, 2000). Following drainage, the site lost less carbon (8.5 tC ha1) compared with the
Mindork Moss simulation because of lower mean annual temperatures. The cumulative exchange of CO2 after 26 years was slightly smaller at 50 tC ha1 (Table 5).
The net exchange of CO2 with the peat plus surface
vegetation was further investigated at Mindork Moss by subtracting the net carbon exchange of the growing trees, estimated using the CFLOW model (Dewar and Cannell, 1992; Milne et al., 1998) from the overall net CO2 exchange measured by eddy covariance (Hargreaves et al., 2003). In the first five years, the peat and surface vegetation were a net CO2 source due to disturbance and drainage and the time course of CO2 exchange tracked the overall CO2 exchange closely, reflecting the minor role of the trees at this time. Between years five and ten, the peat plus vegetation became a net sink, implying that the uptake of CO2 by the ground vegetation exceeded the loss from peat by decomposition. Beyond canopy closure at about year 15, there was little ground vegetation and the peat continued to be a net source of CO2 provided that the trees in the CFLOW model were given a yield class of 10 or greater. From measurements at the site by the Forestry Commission and CEH, the average yield class for the site was 10 to 12 over the 26-year period. Subtracting the net cumulative carbon gain in the trees (assuming yield class 1012) from the overall net CO2 exchange for the site, gave a cumulative carbon loss from the peat plus vegetation of +7.3 to +16 tC ha1. Hargreaves
et al., (2003) argue that approximately 9 tC ha1 of this loss
was accounted for in the first nine years, so that the remaining loss between years 10 and 26 of approximately
Table 6. Estimated carbon balance for drained and afforested peatland (Jones et al., 2000; Harrison et al., 1997; carbon sink is given a negative notation as it represents depletion of atmospheric carbon).
1Mindork Moss (tC ha1) 2Lochar Moss(tC ha1)
Mean change in peat C 36.4 to +20.8 20 to +25 Mean C accumulated in litter 9.5 19.5 Mean C accumulated in dead branches etc not measured 20.0 Mean C in tree biomass 35.3 150 Mean total change in C over rotation 81 to 24 210 to 165
1
Wet, exposed, low productivity (YC 1012) site in SW Scotland, over 26 years
2
Sheltered low altitude, high productivity (YC 16) site in SW Scotland, over 28 years
Table 5. Net ecosystem exchange of CO2 for drained and afforested peatlands in Scotland (Hargreaves and Fowler 2000; Hargreaves et
al., 2003 carbon sink is given a negative notation as it represents depletion of atmospheric carbon)
Climate type Upper limit to C loss tC ha1 Cumulative carbon sink Forest enhancement, tC ha1
over 26 year rotation, tC ha1
Auchenchorth Moss +8.5 50.2 44.2
5 tC ha1 was attributable to the peat. This gives an annual
CO2 loss rate of less than 0.5 tC ha1 yr1 (50 gC m2 yr1).
The results from the CO2 exchange experiments can be compared with the measurements of soil carbon stocks from Mindork Moss and Lochar Moss described above. Combining the measured changes in peat carbon storage at Mindork Moss with an estimate of carbon accumulation in biomass predicted by CFLOW, plus the carbon held in the litter, the overall change in carbon stock was between 24 and 81 tC ha1 (Table 6), so that the site was a sink for
atmospheric CO2 for up to 26 years. The more productive site at Lochar Moss showed much larger carbon accumulations in litter and living biomass (estimated from site measurements; Harrison et al., 1997), but similar and equally variable changes in soil carbon. Again the site was an atmospheric CO2 sink over the 28 years of forest growth. Measurement of the net exchange of CO2 accounts for only one flux component of the carbon balance in an ecosystem and must be supplemented by estimates of other fluxes if the overall effect on soil carbon sequestration is to be determined. Although the estimate of carbon exchange for afforested peat described by Hargreaves et al. (2003) includes carbon uptake into biomass, it does not account for potential carbon losses in soil water and runoff (dissolved and particulate organic carbon, dissolved inorganic carbon, CO2 and methane) and in terrestrial emissions of methane. Ignoring these carbon losses may lead to a significant over-estimation of the terrestrial carbon accumulation rate (Hope et al., 2001), particularly if the fluxes change significantly during the forest cycle.
Accounting for the other carbon
fluxes how important are they?
PEAT LAND CARBON BUDGET
Recent attempts to describe the biogeochemical cycle of carbon in UK upland peat systems can be used to illustrate the potential importance of fluxes, other than net CO2 exchange, to the soil carbon balance. They also highlight some of the uncertainties in carbon balance studies.
Billett et al. (2004) used measurements of net CO2 exchange, stream water carbon fluxes and stream surface CO2 evasion, combined with literature values of carbon inputs in precipitation and terrestrial methane emissions, to construct an annual carbon budget at Auchencorth Moss. A similar exercise has been undertaken for Moorhouse in the Pennines (Worrall et al., 2003; Table 7).
Both studies highlight the importance of carbon losses in stream water to the overall carbon balance of the catchments as this flux is of similar magnitude to the net exchange of CO2. The stream flux term contains several components. For the Pennine site, particulate organic carbon (POC) accounts for approximately 50% of the stream flux compared to about 5% at Auchencorth Moss. Large POC fluxes have been reported for a number of Pennine streams (Labadz et al., 1991; Hutchinson, 1995) whereas much smaller fluxes have been observed at sites in Scotland and mid-Wales (Dawson et al., 2002) where DOC accounts for the majority (69 to 88%) of the riverine carbon flux. Dissolved inorganic carbon plus dissolved CO2 fluxes vary in significance, ranging from 2% to 25% of the total stream carbon flux (Dawson et al., 2002; Worrall et al., 2003; Billett et al., 2004)
Table 7. Carbon budgets for UK peatlands (gC m-2
yr-1
); carbon sink is given
a negative notation as it represents depletion of atmospheric carbon.
1Auchencorth Moss 2Moorhouse
Precipitation inputs 3.1 3.1 Net CO2 exchange 27.8 -55.0
CH4-C emission +4.1 +7.1 Stream surface CO2 evasion loss +4.6
Stream water loss +30.4 +37.2
Balance +8.2 -13.8
1
from Billett et al., 2004
2
Very different conclusions are drawn from the two studies, with Auchencorth Moss acting as a net carbon source and Moorhouse as a sink for carbon, exemplifying some of the uncertainties inherent in budget studies. Worrall et al., (2003) used the published literature values for net uptake of CO2 into UK peat lands of 40 to 70 gC m2 yr1 (Immirzi et al.,
1992, cited by Hargreaves et al., 2003) to estimate net ecosystem exchange of carbon. This figure is approximately double that measured using eddy covariance methods at Auchencorth Moss. Billett et al., (2003) acknowledge that such measurements are very sensitive to prevailing weather conditions indicating a range of possible values for the 24 month measurement period of between 7.6 and 43.8 gC m2 yr-1. Although these fall within the range of values
published from net CO2 exchange studies in other northern hemisphere peat land environments (10 to 76 gC m2 yr1;
Billett et al., 2004), they are at the lower end for UK systems. The other important flux omitted from the budget of Worrall et al. (2003) is the evasion loss of CO2 from the stream which can comprise a significant flux of gaseous carbon in catchments dominated by peat lands (Hope et al., 2001).
In relation to the afforestation of organo-mineral soils, these studies confirm the uncertainties attached to net CO2 exchange measurements which can make the difference between net carbon accumulation and net loss. Losses of carbon in runoff may be a significant flux out of the system similar in size to the carbon captured by net CO2 exchange.
DISSOLVED ORGANIC CARBON FLUXES
There has been considerable recent interest in riverine DOC dynamics with widespread reporting of trends of increasing concentrations in surface waters over the last two decades (Worrall et al., 2004; Evans et al., 2005). Concern has been expressed that these trends might be indicative of destabilisation of soil carbon stores, particularly in catchments dominated by peat soils (Freeman et al., 2001). Several environmental drivers have been proposed to account for the trends which include a response to increased temperatures (Freeman et al., 2001) and/or increased concentrations of atmospheric CO2 (Freeman et al., 2004),
Table 8. Riverine DOC fluxes (gC m-2
yr-1
) from upland UK catchments containing organo-mineral soils and peats beneath moorland / acid grassland and plantation forest.
Site Soil Flux Ref
Pennines (Moorhouse) peat dominated 9.4 Worrall et al., 2003 Scotland (Brocky Burn) peat dominated 16.9 Dawson et al., 2002 Mid-Wales (U. Hafren) peat dominated 8.4 Dawson et al., 2002 Mid-Wales semi-improved grassland (Cyff) organo-mineral + peat 4.1 CEH unpublished data Mid-Wales forest / moorland (L. Hafren) organo-mineral + peat 4.0 CEH unpublished data Mid-Wales forest / moorland (L. Hore) organo-mineral + peat 3.8 CEH unpublished data Mid-Wales conifer plantation (Tanllwyth) organo-mineral (peaty gleys) 4.1 CEH unpublished data Wales - mean of 20 1st
order conifer organo-mineral (peaty podzols) 3.9 CEH unpublished data plantation catchments
Wales - mean of 5 1st
order moorland / acid organo-mineral (peaty podzols) 4.7 CEH unpublished data grassland catchments
Temperate moorland soils not specified 4.3 Hope et al., 1994 Temperate forest soils not specified 3.3 Hope et al., 1994
0 4 8 12 16
0 10 20 30 40 50 6
Forest age (years)
DO
C f
lux gC
m
-2
yr
-1
0
Forest sites Moorland sites
effects of major drought-rewet cycles (Watts et al., 2001), response to a change in atmospheric acid anion loading following emission reductions (Clark et al., 2005) or an ionic strength effect (Evans et al., 2005).
In terms of land-use change, a review by Hope et al. (1994) indicated that temperate forests exported slightly less DOC (3.3 gC m-2 yr1) compared to moorland and grassland
systems (4.3 gC m2 yr1). These figures are broadly
confirmed by data from catchments dominated by organo-mineral soils in Wales (Table 8), although peat land catchments have larger DOC exports of between 8 and 17 gC m2 yr1.
Generally, exports of DOC from catchments containing plantation conifer forest are slightly lower than those from moorland/acid grassland systems on equivalent organo-mineral soils. The chronosequence of 20 Welsh plantation forests showed widely ranging DOC fluxes (0.5 to 19 gC m2 yr1), with no consistent relationship between flux and
forest age. Many of the catchments contained some non-forest land although the highest fluxes (13.6 and 19.1 gC m2 yr1) were observed in very small (1 ha) catchments
planted entirely with young Sitka spruce (1016 years). Estimates of DOC soil water fluxes beneath the rooting zone in the podzolic B horizon of these forest stands show a decrease with age (Fig. 4). Fluxes in the oldest stands are smaller than those measured in moorland/acid grassland on equivalent podzolic soils.
Soil water DOC fluxes beneath the surface O horizon are much larger than in the B horizon (mean of 22 gC m2 yr1
for moorland and 18 gC m2 yr1 for forest) but there is no
relationship between flux and forest age. These data suggest that the stage of forest development has little effect on DOC production in the surface organic horizons. However, the B horizon of older forest soils may have a greater capacity to adsorb carbon.
PARTICULATE ORGANIC CARBON (POC)
In comparison with DOC, there is much less information about catchment exports of POC although it generally comprises about 10% of the total organic carbon (TOC) export (Hope et al., 1994). The effects of afforestation on catchment sediment losses have been the subject of debate in the past (Moffat 1989; Soutar 1989a). In a review of sediment losses resulting from afforestation of upland catchments, Soutar, (1989b) re-assessed evidence presented by Moffat (1988) and concluded that, in the long-term, sediment losses are three to four times greater in afforested catchments compared with non-forest controls or pre-afforestation conditions. However, much larger losses, up to 50 times pre-afforestation rates, are possible following ploughing, drainage, road building and harvesting. Steep slopes and storms can, in some cases, exacerbate erosion problems in forest catchments. The source of the material is clearly crucial in determining whether sediment losses will affect soil carbon stores within the catchment. For example, loss of road surface material due to timber lorry traffic during harvesting is of less concern than loss of peat during pre-afforestation drainage and ploughing.
Some of the best long-term information on sediment losses from afforested and moorland upland catchments is available from Plynlimon in mid-Wales where suspended sediment losses have been measured at irregular intervals over the last two decades or more (Leeks and Marks, 1997). To provide an estimate of catchment POC fluxes, the long-term annual means of these data have been combined with an assumed carbon content of 20% (Walling and Webb, 1981 suggest a range of 1030%; Table 9). The estimates suggest that POC losses from forest catchments are considerably higher than those from relatively undisturbed grassland and moorland catchments. However, where peat is actively eroding in moorland catchments, as in the Pennine site, POC losses can be much higher still (31 to 39 gC m2 yr1; Labadz
et al., 1991; Hutchinson, 1995) and the carbon content of suspended sediments may be 2550%.
Table 9. Estimated POC and TOC exports (gC m-2
yr-1
) for the Plynlimon experimental catchments and UK upland peatland catchments.
Site POC TOC % as POC Reference
The data from the lower part of the Afon Hore at Plynlimon (L. Hore in Tables 8 and 9) include a two-year period during which 50% (c. 130 ha) of the forested part of the catchment was clearfelled. This resulted in a very large increase in suspended sediment load and POC flux (assuming 20% carbon content) from c. 3.5 gC m2 yr1 in the two years
prior to felling to a maximum of 28 gC m2 yr1 in the second
year of felling. Annual losses were sustained at around 18 to 20 gC m2 yr1 for the subsequent three years.
The 347 ha Afon Hafren catchment which is adjacent to the Afon Hore at Plynlimon, comprises a peat-dominated, moorland headwater area of approximately 93 ha while the remainder of the catchment contains a substantial area (167 ha) of commercial plantation forestry consisting mainly of first and second rotation Sitka spruce (Picea sitchensis). The catchment is monitored at two points: the U. Hafren which drains the moorland headwaters and the L. Hafren which drains both the moorland and forested parts of the catchment. Although the measurements cover different periods, the data in Table 9 indicate that annual exports of TOC at the two points in the catchment are approximately equal at c. 11 gC m2 yr1. The peat dominated headwaters
export twice as much DOC but 2.5 times less POC compared with the lower part of the catchment which is dominated by organo-mineral soils and includes the large area of plantation forest. The shift in the flux terms represents the combined effects of a change in land use and dominant soil type between the headwaters and the lower parts of the catchment and is consistent with the data from the other sites.
The study at Coalburn in Northumberland (Robinson et al., 1998) provides a good example of sediment losses associated with the initial stages of afforestation. The 1.5 km2
catchment comprised deep peats which were drained and ploughed prior to planting in the summer of 1972. The pre-forestry drainage density was approximately 3.5 km km2
which was increased to 200 km km2 by forestry operations.
Prior to treatment, suspended sediment losses were c. 3 g m2 yr1. An estimated 120 t km2 of sediment was lost as a
result of drainage (equivalent to 50 years of sediment load at pre-drainage rates). Assuming this material was peat with a carbon content of 50% (Harrison et al., 1997), the amount of carbon lost was approximately 0.6 tC ha1. The probable
long-term effect of drainage was to increase sediment losses to c. 12 g m2 yr1 (Robinson and Blyth, 1982) equivalent to
6 gC m2 yr1 assuming a carbon content of 50% for the
sediment.
The main loss of material resulting from pre-afforestation drainage at Coalburn was thought have occurred in the first five years after the operations (Robinson and Blyth, 1982). If this were the case, and if the rate of carbon loss stabilised thereafter at 6 gC m2 yr1, the total carbon loss for a
26-year period (equivalent to the measurements at Lochar Moss and Mindork Moss) would have been about 1.9 tC ha1. Over
the same period, undisturbed peat land would have lost approximately 0.4 tC ha1. Although afforestation may have
resulted in a roughly five-fold increase in carbon losses as suspended sediment, these are still relatively small quantities compared to the other components of the carbon balance measured at Mindork Moss and Lochar Moss.
It is important to note that most, if not all, data describing the effects of afforestation on sediment losses from upland catchments reflect forestry practices of an earlier era. Many data pre-date the Forest and Water Guidelines (HMSO, 2003) which now determine good practice for sustaining water quality in forest catchments throughout the forest cycle. In respect of future afforestation of organo-mineral soils, it is unlikely that the extensive ground preparation classically associated with plantation forestry would be undertaken. Good practice as determined by the UK Forestry Standard (Forestry Commission 1998) suggests that low impact techniques would be employed which would help safeguard both water quality and soil carbon stocks.
DISSOLVED INORGANIC CARBON (DIC), CO2 AND CH4 EXPORTS
Inorganic carbon can be exported from catchments in the form of the bicarbonate anion (HCO3), dissolved CO
2 and
dissolved CH4. Dissolved CH4 fluxes even from peat dominated catchments are considered negligible (<0.01 gC m2 yr1; Dawson et al., 2002; Billett et al., 2004) whilst
bicarbonate-C plus CO2-C fluxes comprised less than 10% of the stream water carbon export (Dawson et al., 2002; Billett et al., 2004). Much higher proportional losses (25%) were estimated for the Pennine site described by Worrall et al. (2003). For the Plynlimon catchments, bicarbonate C export was less than 1 gC m2 yr1 (Reynolds et al., 1989),
amounting to between 10 and 15% of the TOC + DIC flux. Relatively few studies of carbon budgets have incorporated the gaseous carbon losses from water bodies resulting from evasion of CO2 and CH4 (Hope et al., 2001), although more recently data have been published for peat land systems (Dawson et al., 2002; Worrall et al., 2003; Billett et al., 2004). For peat land systems, total gaseous evasion losses expressed per unit area of catchment may amount to 28 to 70% of the net carbon accumulation (20 50 gC m2 yr1; Hope et al; 2001). This pathway may,
by mass flow in water (Clymo and Pearce, 1995). Evasion
losses from the soil surface are, therefore, likely to be relatively low, with greater transport of gases via soil water to the stream (Hope et al., 2001). In thinner, more permeable, freely draining soils, evasion from the soil surface may become the more important pathway. In view of the lack of data and the potential interactions with soil type and land use, it will be difficult to generalise on the likely effects on evasion losses of carbon from organo-mineral soils due to forest planting on moorland and acid grassland. It is probable that methane fluxes will decrease significantly because increases in evapotranspiration losses will tend to dry out the soil and lower the water table.
SOIL METHANE EMISSIONS
Peat lands are considered one of the main natural sources of terrestrial methane emissions. In peat land systems typical of the British uplands, annual methane production has been estimated as lying between 1.5 and 11 gC m2 yr1 (Worrall
et al., 2003; Billett et al., 2004). The measured methane flux to the atmosphere from soils is the net result of methane production, transport and consumption. Production of methane in soils requires an anaerobic environment with strongly reducing conditions which may require soils to be flooded or waterlogged for several days (Smith and Conen, 2004). Unless a soil layer such as an iron pan impedes drainage, these conditions are unlikely to persist for extended periods in organo-mineral soils, with the possible exception of gleyed soils. Furthermore, if conditions favourable for methanogenesis exist at depth in the soil, it is highly likely that the methane produced would be oxidised en route to the soil surface. Although data are scarce, it seems likely that methane emissions from upland organo-mineral soils will be very small; the soils are more likely to act as sinks for methane (Smith et al., 2000). Land-use change from moorland/acid grassland to forestry will tend to dry out soils due to increased evaporation from the forest canopy. Thus, as in the case for afforested peat lands (Hargreaves et al., 2003), it would be valid to assume that methane emissions from afforested organo-mineral soils will be negligible.
Forest harvesting
Assessment of the likely changes to SOC stocks due to afforestation of organo-mineral soils has to consider possible effects of forest harvesting in commercially managed plantations. Johnson and Curtis (2001) have recently undertaken a meta-analysis of the effects of forest management on SOC storage. The harvesting database
includes 73 entries. No UK data are included but there are results from a few European, mainly Scandinavian, studies. The meta-analysis explicitly excluded effects of harvesting on soil carbon pools in the surface O horizon. The authors argued that available data were inadequate to assess the outcome of the complex set of factors which determine the O horizon response. These include, amongst others: harvesting residue management, site decomposition rate and the nature of the vegetative regrowth.
The meta-analysis concluded that forest harvesting generally had little effect on SOC storage either in the A horizon (uppermost mineral soil) or in the whole mineral soil profile. For the A horizon, stem-only harvesting increased SOC whereas a decrease was found for whole tree harvesting. Within the stem-only harvesting category, there was a significant species effect, with conifers producing more soil carbon after harvest than hardwoods and mixed stands which both showed a decrease in SOC. Several studies in the meta-analysis pointed to the importance of harvest residue management for mineral soil carbon; leaving residues on site had a largely positive effect for mineral soil carbon beneath conifers but little or no effect beneath hardwood and mixed stands. Another significant factor in the assessment was time since harvest. A general trend observed in many studies was that, in the short term, soil C increased as high C/N ratio harvest residues were incorporated in the soil. However, over the longer term, soil carbon re-equilibrated to lower levels, with C/N ratios approaching background values. A study across four sites in the United States confirmed these observations, noting that differences in litter carbon content due to harvest residues had neither a long-term nor a lasting effect on SOC stocks (Johnson et al., 2004). Rather, where long-term effects of harvest residues were observed, these were mainly seen as differences between sites in biomass carbon rather than in SOC stocks (Johnson et al., 2002).
Within the UK, most of the biogeochemical studies of forest harvesting have focused on conifer plantations and
Table 10. DOC fluxes (gC m2
yr1
) beneath harvest residues and the forest floor from adjacent clearfelled Sitka spruce stands on peaty podzol and peaty gley soils at Plynlimon (CEH unpublished data).
Podzol site Year 1 Year 2
the likely consequences for water quality in acid sensitive areas. As a result, measurements relating to carbon have tended to be patchy and relatively short-term. Several catchment studies in the UK provide information on the response of stream water DOC concentrations to clearfelling (Neal et al. 1998, 2003, 2005; Reynolds et al., 2004). In general, there is only a small, relatively short-term response in stream water and groundwater DOC concentrations to stem only harvesting which can be hard to separate from background fluctuations (Neal et al., 2005). A larger stream water DOC response has been observed at some sites on wetter, peaty gley and surface water gley soils (Neal et al., 1998). Over the longer term, increases in DOC concentrations at felled sites are generally indistinguishable from trends observed more widely in UK rivers (Neal et al., 2005).
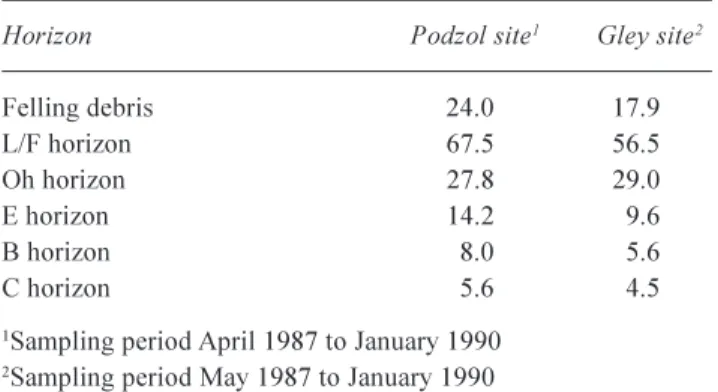
The stream water response is not consistent with the large short-term increases in the concentrations of DOC observed in surface organic horizon soil waters at felled sites on organo-mineral soils (Hughes et al., 1990). The soil water response can be attributed to site disturbance, an increase in summer soil temperatures due to a change in micro-climate following removal of shade and an increase in nutrient supply from the felling debris stimulating microbial activity in the organic surface horizons (Zech et al., 1994). Field data from Plynlimon indicate that large amounts of DOC are also released from decomposing harvest residues (Table 10) whilst mobilisation of DOC from the forest floor is more significant in the second year following harvesting. It seems that the DOC in soil waters is not reaching surface or groundwaters, suggesting that it may be mineralised en route or immobilised in the mineral soil horizons (Table 11; Hughes et al., 1990 and Zech et al., 1994). In the latter case, the carbon would be largely retained on site although
the efficiency of this process may be impeded by saturation of sorption sites by the increased DOC flux. At sites subject to acid deposition, loss of sorption sites due to acid buffering by iron and aluminium oxides/hydroxides and competition for sorption sites by sulphate may also occur (Zech et al., 1994).
Losses of riverine particulate material have also been studied in catchments subject to harvesting. As noted above, large increases in riverine suspended sediment fluxes can accompany felling operations within a catchment and one of the main sources of this material is forest road erosion (Leeks and Marks, 1997). However, harvesting practice can also be a significant factor determining soil loss from sites. Whole tree harvesting can make soils vulnerable to large erosion losses, especially on steep slopes. In a small plot study on a steeply sloping site in Scotland, Lewis and Neustein (1971), reported losses of 13.6 g m2 yr1 of soil
organic matter from a felled site which increased to 20.3 g m2 yr1 when harvesting residues were removed. Whilst
this was a short-term, small scale study, it illustrates the potential problems with this type of harvesting. These are addressed in detail in the current good practice guidelines for whole tree harvesting, along with proposals for preventative and remedial action (Nisbet et al., 1997). For example, leaving harvest residues in place reduces the risk of soil erosion in high rainfall areas, even on slopes as steep as 35° (Lewis and Neustein, 1971).
Soil methane emissions from established forests are low, reflecting the drier soil conditions beneath the forest canopy compared with open moorland. Harvesting of trees allows more water to enter the site as evapotranspiration losses are reduced. The increase in soil moisture status, which may be accompanied by a raising of the water table, can increase methane emissions from the soil substantially (Smith and Conen, 2004). The effect on net CO2 exchange is less clear. Initially, the clear-felled sites might become a net source of CO2 to the atmosphere due to soil disturbance and decomposition of harvest residues. The magnitude of this effect will depend on site factors such as nutrient status, soil type, prevailing climate and residue management (e.g. accumulation of brash into piles). Clear-felled sites, in particular those where harvest residues have been removed, re-vegetate rapidly. Within three years of felling at Beddgelert forest, there was 84% vegetation cover on whole tree harvested plots compared with <60% on stem-only harvested plots (Stevens et al., 1995). This will increase the strength of the CO2-carbon sink and may be sufficient to make the site a net sink for atmospheric CO2.
Table 11. DOC concentrations (mgC l-1
)in leachate beneath harvest residues and in soil waters from adjacent clearfelled Sitka spruce stands on peaty podzol and peaty gley soils at Plynlimon (CEH unpublished data).
Horizon Podzol site1 Gley site2
Felling debris 24.0 17.9 L/F horizon 67.5 56.5 Oh horizon 27.8 29.0
E horizon 14.2 9.6
B horizon 8.0 5.6
C horizon 5.6 4.5
1
Sampling period April 1987 to January 1990
2
Climate change, nitrogen deposition
and increased forest productivity
Most of the work on soil carbon and UK forests has been undertaken over the last two decades. More recently, there has been a growing awareness that forest productivity has increased across continental Europe and the UK (Spiecker et al., 1996; Cannell et al., 1998) but there is scientific debate and uncertainty about why forests growing on a given site type are now more productive than earlier in the last century. The change has been attributed to the effects of increased atmospheric CO2 concentrations (Mellilo et al., 1993), increased atmospheric nitrogen deposition (Nadelhoffer et al., 1999) and increased temperatures (Myneni et al., 1997) either singly or in combination. In the UK, improvements in silvicultural techniques and the use of better genetic material have also been proposed as an explanation (Cannell et al., 1998). Using two process-based forest growth models with very different process representation, Cannell et al. (1998) predicted that up to one half of the increase in General Yield Class in plantation forests observed in the 20th century could be accounted for by the combined effects of nitrogen deposition, CO2 concentration and temperature. Individually, nitrogen deposition and CO2 concentration accounted for about 714% of the increased productivity but their combined effect was approximately additive. The effect of warming in combination with CO2 concentration was relatively modest.
The fate of the carbon sequestered as a result of increased forest productivity is also the subject of intense debate. In particular, this debate has focused on the fate of the increased amounts of atmospheric nitrogen deposition to forests (Nadelhoffer et al., 1999; Jenkinson et al. 1999; Sievering, 1999). If the additional N inputs to forests are primarily taken in as woody biomass with high C/N ratios (200500), then the effect on forest carbon uptake will be large. If, however, the nitrogen is taken up mainly into the soil with low C/N ratios (1030), the effect on carbon sequestration will be relatively minor. Using data from 15N isotope studies
at nine sites across North America and Europe, Nadelhoffer et al. (1999) concluded that the latter was the case; this was in direct contrast to mass balance and modelling studies which predicted a larger effect for carbon sequestration by forest biomass (e.g. Holland et al., 1997). An important consequence of the debate is that if the increased amounts of carbon sequestered by forests reside mainly in the above-ground biomass rather than the long-term soil carbon pool, the effect will be transitory because other factors such as water and nutrient availability may ultimately limit productivity. However, the feed-back mechanisms and interactions are complex and more work is required to
elucidate fully the nature of the response.
Conclusions what are the likely
effects of land-use change for carbon
in upland organo-mineral soils?
EVIDENCE FROM DIRECT MEASUREMENT OF SOC STOCKS
In the context of organo-mineral soils in the UK uplands, the evidence from direct measurements of SOC change, following a change in land use from semi-natural grassland/ moorland to forestry, was inconclusive about a major effect on SOC stocks. International studies suggest that planting broadleaved trees will have little effect on SOC stocks, whereas conifers, especially in high rainfall areas, may deplete SOC stocks. Few relevant UK data sets address the issue and, in the light of the inherent problems of soil heterogeneity and vertical gradients in organic matter content and bulk density, these must be considered uncertain. Furthermore, the extent to which results from other systems, for example peat lands and lowland agricultural soils, can be extended to upland organo-mineral soils is uncertain. Rooting patterns and tree growth rates will differ considerably and the effects of tree species must also be taken into account.
There is evidence that organic matter accumulates at the surface of organo-mineral soils in conifer plantations, but the long-term fate of this material depends on the extent to which it is incorporated into the long-term, stable carbon pool within the soil profile (Pataki et al., 2003). This is likely to depend on the tree species, soil type, site nutrient status, site hydrology and climate. Furthermore, any assessment of the change in SOC resulting from afforestation must take account of potential losses of pre-existing soil organic carbon from the sub-soil which may offset some of the carbon gained from litter inputs at the soil surface.
EVIDENCE FROM FLUX STUDIES
The questions addressed by flux measurements essentially come down to how much of the carbon exchanged with the atmosphere finds its way into the stable, long-term SOC store and how much do the other flux pathways offset the carbon sink?
To summarise the previous discussions, a simple matrix has been developed which provides a qualitative indication of the likely effects of forestry development on individual fluxes (Table 12).
The summary suggests that overall, there may be little net effect of forest development on many of the carbon fluxes, particularly for DOC and DIC, although the latter is uncertain. POC fluxes are likely to be enhanced at all stages of the forest cycle but, as noted above, changes in forest management practice in line with current guidelines should constrain these losses.
The effect of forest harvesting on net CO2 exchange may be neutral depending on whether carbon, lost to the atmosphere from increased decomposition rates and microbial activity, is subsequently balanced by uptake of carbon in re-growing vegetation. This is likely to be very site-specific and will be determined to a great extent by harvest residue management and site environmental conditions. However some measurement campaigns similar to those conducted during the afforestation of peat land sites would provide useful data.
Overall, changing land use on organo-mineral soils, from semi-natural/grazed grassland and moorland to forest, is likely to have a relatively small effect on SOC storage; this
is in agreement with the assumptions made by the UK national carbon inventory. The main uncertainties which deserve further research effort are:
(i) the relative magnitude of the sink for atmospheric carbon as trees grow and mature compared with that lost during site preparation and harvesting, given that the other fluxes are relatively small or of the same magnitude and direction, irrespective of land use or can be controlled by site management
(ii) the extent to which carbon, newly fixed during forest growth and deposited as litter, either at the ground surface or within the soil profile, is transferred to the long-term, stable soil carbon pool.
Acknowledgements
The work was funded by the Scottish Executive and the Welsh Assembly Government. The author would like to thank Dr Barnaby Smith for the provision of suspended sediment data from the Plynlimon catchments.
References
Billett, M.F., FitzPatrick, E.A. and Cresser, M.S., 1990. Changes in the carbon and nitrogen status of forest soil organic horizons between 1949/50 and 1987. Environ. Pollut., 66, 6779. Billett, M.F., Palmer, S.M., Hope, D., Deacon, C., Storeton-West,
R., Hargreaves, K.J., Flechard, C. and Fowler, D., 2004. Linking land-atmosphere-stream carbon fluxes in a lowland peat land.
Global Biogeochem. Cycle., 18, GB1024, doi: 10.1029/2003/ GB002058, 2004.
Table 12. Likely effects of forest development on carbon fluxes in organo-mineral soils.
Preparatory Forest growth Harvesting Comments phase
net CO2 exchange + / + / + + / + harvesting effects depend on residue management and re-vegetation
methane emissions / + / + + / 0 soil flux relatively minor in relation to overall carbon balance
DOC + / + + / 0 + / 0
POC + / + + / + + / + can be controlled by good site management? DIC / CO2 evasion + / 0 + / 0 + / 0 uncertain with few measurements
Symbols:
Bradley, R.I., Milne, R., Bell, J., Lilly, A., Jordan, C. and Higgins, A., 2005. A soil carbon and land use database for the United Kingdom. Soil Use Manage., 21, 363369.
Cannell, M.G.R. and Dewar, R.C., 1995. The carbon sink provided by plantation forests and their products in Britain. Forestry, 68, 3548.
Cannell, M.G.R., Dewar, R.C. and Pyatt, D.G., 1993. Conifer plantations on drained peat lands in Britain: a net gain or loss of carbon? Forestry, 66, 353369.
Cannell, M.G.R., Thornley, J.H.M., Mobbs, D.C. and Friend, A.D., 1998. UK conifer forests may be growing faster in response to increased N deposition, atmospheric CO2 and temperature.
Forestry, 71, 277296.
Cannell, M.G.R., Milne, R., Hargreaves, K.J., Brown, T.A.W., Cruickshank, M.M., Bradley, R.I., Spencer, T., Hope, D., Billett, M.F., Adger, W.N. and Subak, S., 1999. National inventories of terrestrial carbon sources and sinks: the UK experience. Climatic Change, 42, 505530.
Clark, J.M., Chapman, P.J., Heathwaite, A.L. and Adamson, J.K., 2005. Suppression of DOC by SO4 induced acidification during
simulated droughts. In: Acid Rain 2005, Conference Abstracts,
I. Hunova, Ostatnicka, Z. Dostalova and T. Navratil (Eds.), Czech Hydrometeorological Institute, Prague. 445pp. Clymo, R.S. and Pearce, D.M.E., 1995. Methane and carbon
dioxide production in, transport through and efflux from a peat land. Phil. Trans. Roy. Soc. Lond., 350, 249259.
Conen, F., Zerva, A., Arrouays, D., Jolivet, C., Jarvis, P.G., Grace, J. and Menucuccini, M., 2004. The carbon balance of forest soils: detectability of changes in soil carbon stocks in temperate and boreal forests. In: The Carbon Balance of Forest Biomes, H. Griffiths and P.G. Jarvis (Eds.), Bios Scientific Press, London, UK. 235249.
Dawson, J.J.C., Billett, M.F., Neal, C. and Hill, S., 2002. A comparison of particulate, dissolved and gaseous carbon in two contrasting upland streams in the UK. J. Hydrol.,257, 226 246.
Dewar, R.C. and Cannell, M.G.R., 1992. Carbon sequestration in the trees, products and soils of forest plantations: an analysis using UK examples. Tree Physiol., 11, 4971.
Emmett, B.A., Cosby, B.J., Ferrier, R.C., Jenkins, A., Tietema, A. and Wright, R.F., 1997. Modelling ecosystem effects of nitrogen deposition: simulation of nitrogen saturation in a Sitka spruce forest, Aber, Wales, UK. Biogeochemistry, 38, 129148. Evans, C.D., Monteith, D.T. and Cooper, D.M., 2005. Long-term
increases in surface water dissolved organic carbon: observations, possible causes and environmental impacts.
Environ. Pollut., 137, 5571.
FitzPatrick, E.A., 1951. A study of effects of the nature of the parent material on the development of the soil profile with special reference to an area in North-east Scotland. PhD thesis, University of Aberdeen, UK.
Forestry Commission, 1998. The UK Forestry Standard. Forestry Commission, Edinburgh, UK. 74pp.
Freeman, C., Evans. C.D., Monteith, D.T., Reynolds, B. and Fenner, N., 2001. Export of organic carbon from peat soils. Nature, 412, 785.
Freeman, C., Fenner, N., Ostle, N.J., Kang, H., Dowrick, D.J., Reynolds, B., Lock, M.A., Sleep, D., Hughes, S. and Hudson, J., 2004. Export of dissolved organic carbon from peat lands under elevated carbon dioxide levels. Nature, 430, 195198. Freibauer, A., Rounsevell, M.D.A., Smith, P. and Verhagen J.,
2004. Carbon sequestration in the agricultural soils of Europe.
Geoderma,122, 123.
Guo, L.B. and Gifford, R.M., 2002. Soil carbon stocks and land use change: a meta analysis. Glob. Change Biol., 8, 345360.
Hargreaves, K.J. and Fowler, D., 2000. In: Carbon Sequestration in Vegetation and Soils Report, Section 4, Part 2, April 2000. Report to Department of the Environment, Transport and the Regions. Centre for Ecology and Hydrology Edinburgh, UK. 1524.
Hargreaves, K.J., Milne, R. and Cannell, M.G.R., 2003. Carbon balance of afforested peat land in Scotland. Forestry, 76, 299 317.
Harrison, A.F., Jones, H.E., Howson, G., Garnett, J.S. and Woods, C., 1997. Long-term changes in the carbon balance of afforested peat lands. Final Report to the Department of the Environment Contract EPG1/1/3. 13pp.
Heath, J., Ayres, E., Possell, M., Bardgett, R.D., Black, H.I.J., Grant, H., Ineson, P. and Kerstiens, G., 2005. Rising atmospheric CO2 reduces sequestration of root-derived soil carbon. Science, 309, 17111713.
HMSO, 2003. Forests and Water Guidelines, Fourth Edition. Forestry Commission, Edinburgh. HMSO, UK. 66pp. Holland, E.A., Braswell, B.H., Lamarque, J-F., Townsend, A.,
Sulzman, J., Müller, J-F., Dentener, F., Brasseur, G., Levy, H., Penner, J.E. and Roelofs, G-J., 1997. Variations in the predicted spatial distribution of atmospheric nitrogen deposition and their impact on carbon uptake by terrestrial ecosystems. J. Geophys. Res., 102, 1584915866.
Hope, D., Billett, M.F. and Cresser, M.S., 1994. A review of the export of carbon in river water: fluxes and processes. Environ. Pollut., 84, 301324.
Hope, D., Palmer, S., Billett, M.F. and Dawson, J.C., 2001. Carbon dioxide and methane evasion from a temperate peat land stream.
Limnol. Oceanogr., 46, 847857.
Hughes, S., Reynolds, B. and Roberts, J.D., 1990. The influence of land management on concentrations of dissolved organic carbon and its effect on the mobilization of aluminium and iron in podzol soils of Mid-Wales. Soil Use Manage., 6, 137144. Huntington, T.G., Ryan, D.F. and Hampburg, S.P., 1988. Estimating
soil nitrogen and carbon pools in a northern hardwood forest ecosystem. Soil Sci. Soc. Amer. J., 52, 11621167.
Hutchinson, S.M., 1995. Use of magnetic and radiometric measurements to investigate erosion and sedimentation in a British upland catchment. Earth Surf. Process. Landf., 20, 293 314.
Immirzi, I.S.A., Maltby, E. and Clymo, R.S., 1992. The Global Status of Peat Lands and their Role in Carbon Cycling. Report for Friends of the Earth by the Wetland Ecosystems Research Group, Department of Geography, University of Exeter. Friends of the Earth, London, UK.
Jenkinson, D.S., 1971. The accumulation of organic matter in soil left uncultivated. In: Rothamsted Experimental Station Report for 1970, Part 2, Lawes Agricultural Trust, Harpenden, Herts, UK. 113137.
Jenkinson, D.S., Goulding, K. and Powlson, D.S., 1999. Reply to: Nitrogen deposition makes a minor contribution to carbon sequestration in temperate forests. Nature, 400, 629.
Johnson, D.W. and Curtis, P.S., 2001. Effects of forest management on soil C and N storage: meta analysis. Forest Ecol. Manage.,
140, 227238.
Johnson, D.W., Knoepp, J.D., Swank, W.T., Shan, J., Morris, L.A., Van Lear, D.H. and Kapeluck, P.R., 2002. Effects of forest management on soil carbon: results of some long-term sampling studies. Environ. Pollut., 116, S201S208.
Jones, D.L., Hodge, A. and Kuzyakov, Y., 2004. Plant and mycorrhizal regulation of rhizodeposition. New Phytol., 163,