MACROECONOMIC EVOLUTION IN ROMANIA’S DEVELOPMENT
REGIONS WITHIN THE CURRENT ECONOMIC- FINANACIAL CRISIS
Ph.D. Senior researcher Mariana B LAN1, Ph.D Candidate Assistant Alina SOLOMON 2
1 Institute for Economic Forecasting-NIER, Romanian Academy, [email protected]
2 ”Dimitrie Cantemir” Christian University of Bucharest, Faculty of Finances, Banks and Accountancy,
Abstract: Development disparities between regions and within Romania have existed both in the period before Romania joined the European Union and after January 1, 2007. This phenomenon has gained momentum because of the impact of economic restructuring, particularly in mono-industrial areas, whose population has been affected by unemployment due to closure of unprofitable state enterprises. Financial crisis and economic impact of accession on growth in the eight development regions of Romania in 2007 produced no changes in their rankings as the index of regional disparity, even though for some, its value has increased from 2006.
This paper presents a comparative analysis of developments in macroeconomic indicators in developing regions of Romania.
Keywords: development regions, administrative-territorial structures, regional disparities, aging, educational level.
JEL Classification: I21, J11, J21, J60, P25
1. INTRODUCTION
In the last decade there have been major changes in global economic system mainly due to the economic development of Central and Eastern European countries, and also to employment in the accelerated economic development of countries with large populations (China and India - 1/3 of world population). In this context, the balance of energy markets, raw materials, capital, labor and the global ecological balance has been and will be affected.
Housing crisis in various developed countries, oil and gas price fluctuations, inflation, the crisis in the agrofood sector, the crisis in financial markets, reduction of the pace of economic development in some countries are aspects of adjustment/self-regulation of "a worldwide phenomena”.
Generally, tightening credit conditions and increased costs, the lack of liquidity are already affecting operators in different economic sectors in Romania.
However, in all economic activity there are manifestations of restraint in expanding business and investment and some units have reduced production rate amid lower orders, especially for export.
2. SHORT OVERVIEW OF EVOLUTION OF MACROECONOMIC INDICATORS IN THE MAJOR REGIONS OF ROMANIA
Administrative-territorial structure of Romania is made up of 320 towns (103 of which are municipalities) and 2856 small towns.
In 1998, there passes Law no. 151 on regional development, a regulatory document setting out the institutional framework, objectives, competences and specific instruments for regional development policy in Romania. To achieve the basic objectives of regional development policy, Law no.151/1998 allowed the establishment of the 8 development regions - appropriate to statistic level NUTSII, through voluntary association of counties.
There are differences between regions in terms of population density. Without taking into account the Bucharest-Ilfov Region which has 1222.4 inhabitants per km2 –due to the presence of Urban Capital congestion- the highest population density recorded is in North-East (101.1 inhabitants per km2), the region with the largest demographic dynamism in the country, and the lowest density is in the West Region, Romania (60.1 inhabitants per km2) - the region with the largest decrease in population and mostly mountainous. The degree of urbanization in these regions is also different. Except for the Region Bucharest-Ilfov, the most urbanized regions of Romania are the West and the Center regions, which have more than 60% of urban population.
By contrast, in the east of the country (Northeast Region) and throughout the South (South Muntenia and South-West Oltenia regions) the rural population is predominant due to plain areas where agricultural activities prevail.
After decades when the number of people in cities has risen significantly in the period 1990-2007, the urban population has decreased continuously in all developing regions.
The main cause of decreasing urban population was represented by migration to both rural areas and abroad. This was prompted by economic decline, followed by the residents who have left the cities due to unemployment. In parallel, to the decrease of urban population there has contributed there demographic phenomena as well (for example: negative natural increase), but their magnitude was much smaller. Following these developments, the network structure of cities has changed: the number of small towns has increased and the number of cities has decreased. Distribution in territory of the cities is relatively balanced and has remained a distinctive feature of Romanian town network.
100 /loc. PIB
/loc. PIB
na reg
⋅ (1)
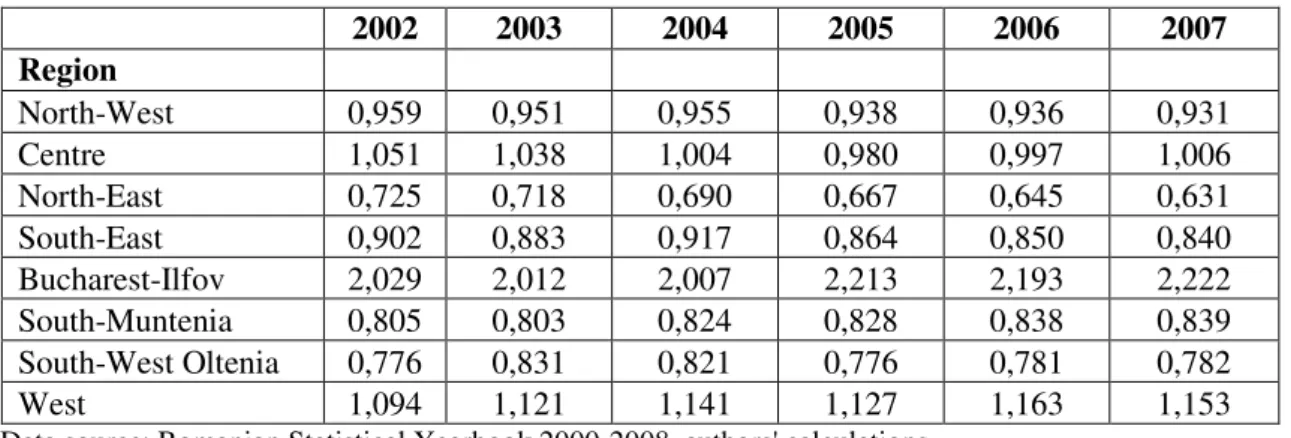
Table nr.1 RegionalDisparity Indicators
2002 2003 2004 2005 2006 2007 Region
North-West 0,959 0,951 0,955 0,938 0,936 0,931
Centre 1,051 1,038 1,004 0,980 0,997 1,006
North-East 0,725 0,718 0,690 0,667 0,645 0,631
South-East 0,902 0,883 0,917 0,864 0,850 0,840
Bucharest-Ilfov 2,029 2,012 2,007 2,213 2,193 2,222 South-Muntenia 0,805 0,803 0,824 0,828 0,838 0,839 South-West Oltenia 0,776 0,831 0,821 0,776 0,781 0,782
West 1,094 1,121 1,141 1,127 1,163 1,153
Data source: Romanian Statistical Yearbook 2000-2008, authors' calculations
Analysis of data from Table 1 highlights decreases recorded by North – East regions (from 0.725 in 2002 to 0.631 in 2007) and Center (from 1051 in 2002 to 0.980 in 2004), increasing since 2006 and the leap of the Bucharest-Ilfov region (from 2.029 in 2002 to 2.222 in 2007).
Financial crisis and economic impact of accession on growth in the eight development regions of Romania in 2007 produced no changes in their rankings in the index of regional disparity, even though for some, its value has increased from 2006.
In terms of net average earning, discrepancies between regions have started to decrease since 2004. If in 2003, the net average earning in the most developed region (South-West) was 1.17 over the region with the minimum (Northeast region), in 2006 the gap reached 1.09.
Year 2007 meant an increase in net monthly earnings at CANE in each region (Figure 2); however, regional disparities in income are complemented by the maintenance discrepancies in terms of unemployment, although this phenomenon knew a reduction in recent years.
0 200 400 600 800 1000 1200 1400 1600
Nord - Vest Centru Nord - Est Sud - Est Bucure ti - Ilfov Sud - Muntenia Sud - Vest Oltenia Vest
2006 2007
Source: Romanian Statistical Yearbook 2000-2008, authors' calculations.
Figure 2 Evolution of monthly earnings at CANE
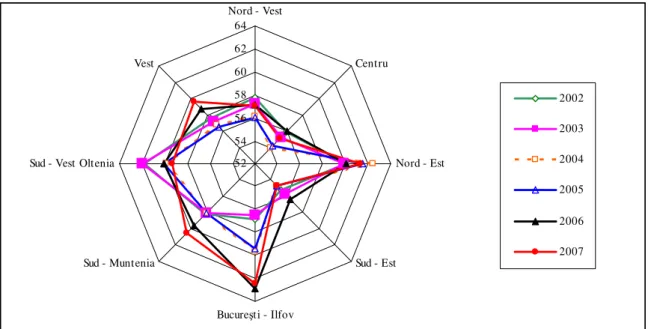
North – East region employment rose by 2.3 percentage points while in the South - West Oltenia it fell by 4.35 percentages. Compared to 2006, only South-Muntenia regions, West and Northeast are highlighting employment rate increases.
52 54 56 58 60 62 64 Nord - Vest
Centru
Nord - Est
Sud - Est
Bucure ti - Ilfov Sud - Muntenia
Sud - Vest Oltenia Vest
2002
2003
2004
2005
2006
2007
Source: Romanian Statistical Yearbook 2000-2008, authors' calculations.
Figure 3 Employment paths on major development regions of Romania during 2002-2007
During 1992 - 2007 Romania's population decreased by 6%, while EU-15 population increased by 1.02%. Decreased population of Romania is due to strong decrease in fertility, increased mortality and emigration (especially during 1991-1992). South Muntenia and South-West - Oltenia regions have the largest share of population of 65 years old and older than 65 in total population (16.6% and 16.3% on July 1, 2007). The highest share of young population is registered by the North-East region, in which on July 1, 2007, there were 17.9% of the population aged 0-14 years old, a negative record is held by the Bucharest-Ilfov region with a share of population couples to only 11.9%.
If the country recorded a surplus of young to the elderly population, there are regions where this proportion is reversed: the Bucharest-Ilfov, South-Muntenia, Southwest and West Oltenia regions. However, the demographic dependency ratio records the highest values in North-East region, because of the high level of young people aged 0-14 "pressure" on adults over 26%, while the highest pressure exerted by the elderly is recorded in the South-West Oltenia and South Muntenia, ie 24 to 100 elderly adults. Bucharest-Ilfov Region, while noting the large number and share of elderly, in terms of demographic dependency, presents a good situation, whereas the proportion of adults, 73.7% of the total in 2007 was highest in the whole country. Capital has always been a strong magnet in internal migration because of economic and social development level of the area.
Regionally, in 2007, average life expectancy will be 71.7 years in North West region and about 74.1 years in Bucharest-Ilfov Region, distinguishing sharply in terms of area of residence and sex.
In the regional profile, the level of education with the biggest increase in terms of school population is comprised of higher education, particularly since 2000, after the emergence of private education and dissemination of public education by opening private universities or their subsidiaries in cities. Thus, compared to the 1990-1991 school year, 2007-2008 school year shows a 3-fold increase in the share of public tertiary education in total school population in Bucharest-Ilfov, North East, West, the 4 times in South-West Oltenia and North-West, 8 times in South-East, 6 times in center Muntenia and South. Most developed regions (with the highest level of GDP per inhabitant) are also the most important universities - the largest share of public tertiary education contained within the total school population in 2007-2008 is in Bucharest-Ilfov (56% here and the school population has increased compared with the level in the 2000/2001 school year 30%) and West (22%). These two regions are centers of immigration to other regions in terms of higher education. In Bucharest, school population share that follows higher education is much greater than for other types of education, much of the school population included in this type of education is mainly from southern and eastern regions, regions with lower share of the school population that entered higher education (compared with regions of west and center).
After 2000, there is a return of vocational education, given the fact that the population share in this type of education in 2004-2005 increased slightly in all regions except the region of Bucharest-Ilfov. In the North-East and South East regions, the importance of vocational education is the largest in the country (5.7% school population recorded in 2007/2008) increased this year compared with the 1990-1991 school year, although it has continued to reduce since 2000. It also notes a similar trend of importance of secondary education. The largest share in this type of education was met in 2007-2008 in the regions: Centre (region with the largest share of this type of education after 1990), 1.44%, Bucharest-Ilfov 1.43% and South-West Oltenia, 1.29%. High school recorded in 2004-2005 school population shares between 17% and 18.5%, excluding the least developed regions - North East - where the school population ratio was 15.33%. Perhaps the early school after graduating from the 8th grade is higher than the rest of the country, school population enrolled in vocational secondary education alternative, being much higher in comparison with other regions. In school year 2007/2008, there was a slight improvement in the situation of the school population included secondary education, 17% of school population in North-East region was included in this type of education, however there is an almost 3-point reduction percentage (compared to the year 2000/2001) of students registered in secondary schools in the region Bucharest - Ilfov (from 16.87% to 13.3%).
Working abroad is an important source of income for a large proportion of the population. Currently, one in ten Romanian households receives income from international migration. Migrant households have more long-term assets than households that have the same socio-economic profile, but without migration experience. Nationally, about 10% of each type of investment in the past five years is carried out with international migration income. Regarding the type of expenditure - the most important are investments in housing (expansion/ modernization, but also construction or purchase), followed by the purchase of household goods, cars and other long-term assets. Productive activities financed with money from migration are different depending on the residential environment - rural money is invested mainly in agricultural type activities, while urban money is invested in other types of businesses.
The phenomenon has intensified especially after 2002, with free circulation within the Schengen area for Romanian. Currently, the phenomenon of temporary departure to work abroad is approximately three times higher than in 2002. Moldova, Muntenia and Oltenia are historical regions in which temporary migration for work precede tourism- temporary visiting, more frequently in Banat, Transylvania and Bucharest, Dobrogea
Migration flows have a more balanced territorial distribution compared to immigration, the main sources of emigration in 2005-2007 were the Centre region, north-east and the Bucharest-Ilfov region. Modest levels of emigration were recorded in this period in the South and Southwest.
Although it makes sense that areas with higher unemployment rates than average have an increased potential for labour migration, however, the Bucharest-Ilfov region is characterized by a small number of unemployed and at the same time significant emigration source, but it differs from other parts of the country.
Bucharest-Ilfov is a region where a high proportion of migrants in a number of people have a higher professional qualification. People who decide to leave the country are more likely motivated by the assertion training and high earning compared to those from Romania. Young people are also attracted by prospects of further education or specialization in better conditions.
There are several arguments for further reducing of future permanent emigration, temporary migration for employment and return of some Romanians who left to work abroad:
economic downturn that is emerging more clearly in Europe, growth forecasts are becoming more pessimistic in countries that most Romanian immigrants live. Building sites, which have attracted far many Romanian migrant workers, are among the first industries affected by reduced economic activity, with negative consequences on employment of immigrants already felt. Italy and Spain, two of the priority destinations for Romanian migrants, are not currently attractive. The economic downturn begins to make its presence felt in Spain, where construction, engine of the Spanish economy went into decline, resulting in a significant increase in the number of unemployed, including many Romanians. In addition, there was the opening campaign in Italy against immigrants, which led many Romanians to reconsider the decision to migrate / stay in Italy.
labour shortages in the country, particularly in construction and continued growth of salaries, related largely to the shortage. Sustained economic growth in recent years and the emigration of a large part of the workforce have created a labor shortage in many sectors of Romania (construction, textiles and footwear, food, trade, health, etc.).
Maintaining economic growth forecast for the coming years (although recently revised lower growth rates) raises the question of compensation for the deficit in the labor market in Romania with qualified personnel from other countries (migrant workers) to support further economic development; decreasing and aging population, combined with massive emigration of Romanians in the future will favor immigration for employment, while raising issues of managing a relatively new phenomenon for Romania.
Thus, the negative impact it has on the size and quality of labor employed in Romania is manifested in several ways: going abroad for a significant proportion of highly skilled labor (brain drain), brain-loss ratio - Brain-win is disadvantageous for Romania as part of quality, given that the skill levels of people coming to Romania is lower than those leaving the country, the processes of brain circulation and brain regain, aging workforce in some sectors activity (e.g. Research & Development), which is partly influenced by migration, etc.
(79.53%). Unemployment increased in counties: Vaslui by 1.8 pp, Harghita by 1.1 pp, Covasna, Dolj and Alba by 0.8 pp, Calarasi by 0.7pp, Tulcea, Mehedinti and Satu Mare by 0.6 pp.
The largest number of unemployed (allowances) comes from construction, agriculture and related industries.
Decreases in unemployment rate occurred in 3 districts namely: Maramures, Ilfov and Dambovita by 0.2 percentage points, while in Bucharest the rate was unchanged compared with the previous month. The highest unemployment rate was achieved in Vaslui (10.2%), followed by counties: Mehedinti (9.3%), Dolj (8.4%), Teleorman (8.0%), Gorj (7.4%), Covasna (7.2%) and Alba (7.0%).
Minimum unemployment rate in December 2008 of 1.4% was registered in Ilfov county. Amplitude, 8.8 percentage point increased over November of 2008 by 1.5 percentage points due to the maximum held by Vaslui.
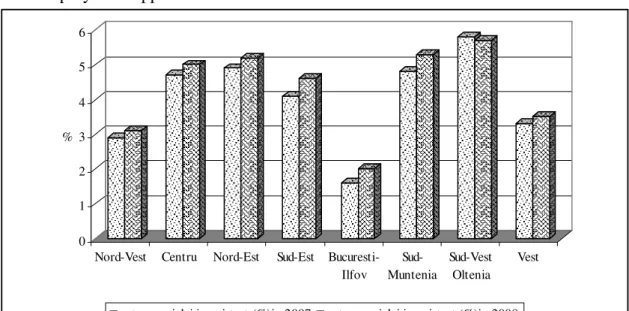
Statistical regions with highest unemployment rates were South West (7.0%), Northeast (5.3%) and center (5.2%), regions where rural activities are predominant. There are disparities within regions, where predominantly agricultural counties coexist with the most developed. For example, in North-East region there have been discrepancies between districts in terms of unemployment rate, as follows: the maximum level was reached in Vaslui (10.2%) and minimum in Botosani county (3.5%), the spread is 6.7% percentage points (Figure 4).
Analyzing the graph of Figure 4 reveals the fact that in 2008 in almost all regions of the country's unemployment rate is in upward progress, Bucharest and Northwest regions recording the lowest levels of unemployment, 1.7%, respectively 3.3%. In the Bucharest region there is the largest labor market in the country, also direct investments are higher in this region providing increased employment opportunities.
0 1 2 3 4 5 6
%
Nord-Vest Centru Nord-Est Sud-Est Bucuresti-Ilfov
Sud-Muntenia
Sud-Vest Oltenia
Vest
rata somajului inregistrat (%)in 2007 rata somajului inregistrat (%)in 2008
Data source: National Agency for Employment
Figure 4 Evolution of the average rate of unemployment, by region, 2007 and 2008
South-West region recorded also during 2008 the highest unemployment rate, followed by South-Muntenia. There is a predominance of agricultural activities in certain parts of the region or county economic restructuring, in early 2000, when there were closed unprofitable state enterprises, especially in mono-industrial areas. This is characteristic for regions with high rates of unemployment.
environment of origin in 2008, the regions that had the highest increase in the number of employed persons were North-East (78,890) and South-Muntenia (68,000), in 2007, maintaining the same growth for the same region, namely North-East (90,768) and South-Muntenia (87.987). Regions which registered decreases in terms of the recruitment in 2008 are: Bucharest-Ilfov (18.621) and center (43.599) and in 2007, regions which showed a decrease in the number of employed people are Bucharest-Ilfov (23,579) and Northwest (54.703).
In 2008, out of the 412,922 people who were employed, 41.04% are women, while the remaining 58.96% are men, the proportion being slightly similar in 2007 when there were the following: 39.78% for women and 60.22% for men. Most of women were placed in counties like Hunedoara - 10.262, Bucharest - 9600, Timisoara - 8947, Neamt - 8787, and the regions where most women are employed are: South Muntenia - 27,099, North East - 26,444, West - 25.807 followed by North West - 22.023 and South-West Oltenia - 20.753.
The information and counseling measurement in 2008 holds a share of 16.04% of total people employed, by 3.64 percentage points higher than 2007. Regions with the highest share in total extent are: Northwest (23.15%), center (18.58%), Northeast (% 17.43) and Bucharest-Ilfov region with the lowest value, namely 0, 55%.
Labor migration requires the development of at least three relevant issues: the management of legal migration, illegal migration and integration of legal migrants in receiving societies. Thus, in 2008, the number of mediated workers, for countries with which bilateral agreements were signed between the government institutions in the field (Germany, Spain, France and Switzerland) was 52,389, while during the same period of 2007, the number of workers was 37,639, representing an increase of 39.19% compared to 2007.
Regarding the area of origin of mediated workers, both in 2008 and in 2007, most applicants who have a contract of employment abroad came from the geographical center (14.747 respectively 6.790) representing 28.15% of total mediated workers respectively 18,04% (Fig. 5). Most employment contracts obtained by the mediated workers have been employed for the purpose of Germany, in 2008 the number of employment contracts obtained for destination Germany increased by 59.22% compared with 2007.
0 2000 4000 6000 8000 10000 12000 14000 16000
p
e
rs
o
an
e
Nord-Vest Centru Nord-Est Sud-Est Bucuresti-Ilfov
Sud-Muntenia
Sud-Vest Oltenia
Vest
2007 2008
Data source: National Agency for Employment
Figure 5 The number of media workers in developing regions 2007-2008
In terms of employment contracts obtained for Romanian workers with destination Spain, it fell by 54.98%.
Regarding age, the people who have obtained an employment contract, a total of 18,744 contracts of employment were obtained from people in the age group 26-35, representing a 35.78% share of all employment contracts followed by age group: 36-45 years (31.11%).
In 2007, most employment contracts, namely 15,679, were obtained from individuals belonging to age group between 36-45, representing a 41.66% share of total employment contracts obtained in this period, followed by those in the age group 26-35 (34.86%).
In 2008 the number of employment contracts obtained by private employment agency was of 11,380. Most contracts were obtained for the United States, 2660 contracts representing 23.37% of the total number of contracts, Cyprus, Italy, United Kingdom of Great Britain and Germany.
SELECTED BIBLIOGRAPHY
1 Ciotea F. i Georgescu Maria-Ana, (2006),Demography and social investigation methods “Petru Maior”University, Tg.Mure ;
2 Cre u A., Stanef R., (2006), Operationalization strategy employment job in Romania - the objective of EU integration, Theoretical and Applied Economics, pp 89-94;
3 Ghet u V., (2000), Population and society, Bucharest, Expert Publishing House
4 Ghe u V., Year 2050:Will Romania's population reach more than 16 million?, Demographic Research Center Vladimir Trebici, National Institute of Economic Research, Romanian Academy, www. ccd.ince.ro
5 Halus R., (1995),Aging population and elderly population in recent decades development Romanian Statistical Review, nr. 10, CNS, Bucharest;
6 Nicolae M, Pan C., Radu B., (2007), The Impact of Romanian Accession to the EU on Regional Migration, Vol. 1, Aeternitas Publishing Kouse, Alba-Iulia, Romania ;
7 Nicolae M. Balan Gh., (2007), Socio-Economic Implications of Labour Force Migration and Persons at Regional Level. Case of Romania, Vol. 1, Aeternitas Publishing Kouse, Alba-Iulia, Romania;
8 Nicolae M., Albu L., Pan C., (2005), Models of people mobility and labor force - volume “Work force migration and durable development of Romania. Theoretic-methodological approaches. Indicators systems and models for analyze, Expert Publishing House, Bucharest;
9 Trebici V., (1985), Small encyclopedia of demography, Technical Publishing, Bucharest; *** Romanian Statistical Yearbook - 2008 National Institute of Statistics;
*** Statistical Bulletin on Labour and Social Solidarity, 2003-2009,Ministry of Labor and Social Solidarity –Romania, www. mmuncii.ro
*** European social statistics – Population statistics, 2006 edition. Eurostat, www. epp.eurostat.ec.europa.eu/cache/ITY.../KS-DZ-08-001-EN.PDF
*** evelopments in unemployment and social protection of unemployed, year 2008, National Agency for Employment, www.anofm.ro
*** Main macroeconomic projection for the period 2009 – 2014,