O USO DE REDES DE SENSORIAMENTO
PARTICIPATIVO NO ESTUDO DO
ANA PAULA GOMES FERREIRA
O USO DE REDES DE SENSORIAMENTO
PARTICIPATIVO NO ESTUDO DO
COMPORTAMENTO DE TURISTAS
Dissertação apresentada ao Programa de Pós-Graduação em Ciência da Computação do Instituto de Ciências Exatas da Univer-sidade Federal de Minas Gerais como req-uisito parcial para a obtenção do grau de Mestre em Ciência da Computação.
Orientador: Antônio Alfredo Ferreira Loureiro
Coorientador: Thiago Henrique Silva
Belo Horizonte
ANA PAULA GOMES FERREIRA
USING PARTICIPATORY SENSING IN THE
STUDY OF TOURISTS BEHAVIOUR
Dissertation presented to the Graduate Program in Computer Science of the Fed-eral University of Minas Gerais in partial fulfillment of the requirements for the de-gree of Master in Computer Science.
Advisor: Antônio Alfredo Ferreira Loureiro
Co-Advisor: Thiago Henrique Silva
Belo Horizonte
c
2016, Ana Paula Gomes Ferreira. Todos os direitos reservados.
Gomes Ferreira, Ana Paula
F383u Using Participatory Sensing in the Study of Tourists behaviour / Ana Paula Gomes Ferreira. — Belo
Horizonte, 2016
xxii, 71 f. : il. ; 29cm
Dissertação (mestrado) — Federal University of Minas Gerais
Orientador: Antônio Alfredo Ferreira Loureiro
1. Partipatory Sensing Networks. 2. Pervasive Social Computing. 3. Social Media. 4. Mobility. 5. Tourism. I. Título.
Dedico esse trabalho a todos que acreditam em mim.
Acknowledgments
Esse é um dos momentos interessantes na vida: diante da realização de um sonho, começa a passar um filme desde ter uma ideia para algo que se tornou realidade. Algumas pessoas foram fundamentais nesse caminho longo e árduo e por isso hoje eu tenho motivos de sobra para agradecer.
Agradeço ao meu orientador Antônio Loureiro por ensinar sobre colaboração e humildade. Agradeço também ao Thiago Silva pelo tempo e esforço investido em me explicar tantas coisas; sua pesquisa foi uma inspiração. Eu tive a sorte de trabalhar ao lado de dois grandes pesquisadores.
Agradeço a minha família por todo o suporte dado, por acreditarem nas minhas decisões e serem a minha motivação. Agradeço a minha Bahia por sempre manter em mim a garra e o bom humor. Muito obrigada também aos amigos que deixei por lá, sempre corujas e compreensivos nos meus momentos de ausência. A crença em Deus me faz acreditar que o amanhã poderá melhor. Sou grata por esse otimismo incurável! A comunidade nordestina na UFMG, representada pela Bahia e pelo Ceará, tem a minha gratidão. Foram muitas idas ao Cabral e muitas conversas; algumas felizes e outras tristes, mas sempre boas. Agradeço também aos amigos que Belo Horizonte me deu; vocês tornaram e tornam os meus dias mais leves e felizes. Obrigada ao WISEMAP, o laboratório com o melhor capital humano da UFMG. Obrigada por me ensinarem tanto e pelas risadas ao longo do caminho. Obrigada também ao BOAS Esporte, melhor time de futsal feminino do DCC, pelas amizades que me trouxe e tantos momentos divertidos.
Olhando pra trás e para o tempo presente é incrível poder dizer: eu consegui!!! Muito obrigada a todos que colaboraram para isso ser possível.
“Meu caminho pelo mundo eu mesmo faço A Bahia já me deu régua e compasso...”
(Gilberto Gil)
Abstract
Tourism has become a global economic force, being responsible for approximately 10% of total world GDP. For this reason, offering better services to tourists is indispensable. With this goal in mind, in this work we study how tourists move through time and space and the factors that influence their movements in four major cities: London, Rio de Janeiro, New York and Tokyo. To perform this study we use data from social networking platforms, which are being massively and pervasively used, thanks to mobile devices with powerful networking and computing capabilities. We perform a large scale study of tourists mobility from several aspects. For example, we use a spatio-temporal graph model to study urban mobility of tourists, identifying where and when places are more important to users in the studied cities. In addition, we propose a new methodology, based on a topic model, that enables the automatic identification of mobility pattern themes, which, ultimately, leads to the better understanding of the profile of users. Our results have implications in several segments. In fact, we demonstrate possible uses of our results in a new itinerary recommendation system and how business owners could explore them to offer better service to tourists in different locations that could be culturally distinct.
Keywords: Partipatory Sensing Networks, Location-Based Social Networks, Social Media, Mobility, Tourism, Foursquare.
List of Figures
2.1 Illustration of a Participatory Sensor Network. This image was obtained from [Silva et al., 2014a] . . . 7
3.1 Tweet with check-in information. In 1) the check-in URL, 2) the time and date, 3) geolocalization from Twitter. . . 14 3.2 Swarm’s/Foursquare’s page with check-in details. In 1) User name and 2)
the name and link of the venue. . . 14 3.3 Venue page on Swarm’s/Foursquare’s page . . . 14 3.4 Illustration of the complete process to collect check-in data . . . 15
4.1 Distribution of the number of check-ins performed by tourists (green) and residents (blue) . . . 20 4.2 Distribution of the time interval (in hours) between the check-ins performed
by tourists (green) and residents (blue) . . . 21 4.3 Places where tourists (green) and residents (blue) performed check-ins . . . 23 4.4 Temporal check-in sharing pattern throughout the day by tourists and
res-idents during weekdays . . . 26 4.6 Check-ins frequency for each category by tourists and residents by city . . 26 4.5 Temporal check-in sharing pattern throughout the day by tourists and
res-idents during weekend . . . 27 4.7 Foreigners and Domestics Tourists by city . . . 28 4.8 Places where foreigns (blue) and domestics (red) performed check-ins . . . 29 4.9 Temporal check-in sharing pattern throughout the day by domestic and
foreign tourists during weekdays . . . 30 4.10 Check-ins frequency in each category by foreigns and domestics tourists by
city . . . 31
5.1 Distribution of Displacement of Tourists and Residents . . . 34 5.2 Distribution of Radius of Gyration of Tourists and Residents . . . 35
5.3 Visualization of the movement of users for different values of radius of
gy-ration in Tokyo. . . 51
5.4 Illustration of the graph model considered . . . 52
6.1 Distribution of the time interval (in hours) between the check-ins performed by Starbucks (green) and other Coffee Shops (brown) at New York . . . . 54
6.2 Subgraph of places visited by New York residents before and after other Starbucks . . . 55
6.3 Subgraph of places visited by New York tourists before and after other Starbucks . . . 56
6.4 Subgraph of places visited by New York residents before and after other Coffee Shops . . . 57
6.5 Subgraph of places visited by New York tourists before and after other Coffee Shops . . . 57
6.6 Yankee Stadium, New York . . . 60
6.7 Jardim Suspenso do Valongo, Rio de Janeiro . . . 61
6.8 Victoria and Albert Museum, London . . . 62
6.9 Kanda Myojin Shrine, Tokyo . . . 63
List of Tables
3.1 Number of check-in and unique users by dataset . . . 15
3.2 Number of check-in by city and dataset . . . 15
3.3 New classification to each category group of Foursquare . . . 16
3.4 Number of tourists identifyied in each city . . . 16
4.1 Ranking of most popular venues for Tourists . . . 24
4.2 Ranking of most popular venues for Residents . . . 25
5.1 Ranking of degree centrality of New York . . . 38
5.2 Ranking of degree centrality of Rio de Janeiro . . . 41
5.3 Ranking of closeness centrality of London . . . 42
5.4 Ranking of betweenness centrality of Rio de Janeiro . . . 44
5.5 Comparative ranking of degree centrality of the resident’s graph and null model graph of New York . . . 45
5.6 Ranking of closeness centrality of the tourist’s graph and null model graph of London . . . 46
5.7 Ranking of betweenness centrality of the resident’s graph and null model graph of Rio de Janeiro . . . 46
5.8 Profiles of residents in Tokyo according to venues subcategory . . . 47
5.9 Profiles of tourists in Tokyo according to venues subcategory . . . 47
5.10 Profiles of residents in Rio de Janeiro according to venues subcategory . . 48
5.11 Profiles of tourists in Rio de Janeiro according to venues subcategory . . . 48
5.12 Profiles of residents in New York according to venues subcategory during weekdays . . . 48
5.13 Profiles of residents in New York according to venues subcategory during weekends . . . 49
5.14 Profiles of tourists in New York according to venues subcategory during weekdays . . . 49
5.15 Profiles of tourists in New York according to venues subcategory during
weekdays . . . 49
6.1 Profiles of customers of Starbucks who lives in New York . . . 59
6.2 Profiles of customers of Starbucks who visits New York . . . 59
6.3 Recommended places to go based on New York tourists’ . . . 60
6.4 Recommended places to go based on Rio de Janeiro tourists’ . . . 61
6.5 Recommended places to go based on London tourists’ . . . 62
6.6 Recommended places to go based on Tokyo tourists’ . . . 63
Contents
Acknowledgments xi
Abstract xv
List of Figures xvii
List of Tables xix
1 Introduction 1
1.1 Motivation . . . 1
1.2 Objectives . . . 2
1.3 Contributions . . . 2
1.4 Work Organization . . . 4
2 Related Work 5 2.1 Contextualization . . . 5
2.1.1 Human as Sensors . . . 5
2.1.2 Participatory Sensor Networks . . . 6
2.2 Understanding Mobility . . . 7
2.2.1 Studying Mobility Through Traditional Data . . . 7
2.2.2 Studying Mobility Through Social Data . . . 8
2.2.3 Mobility of Tourists and Residents . . . 9
2.3 Applications based on tourist mobility . . . 9
2.4 Discussion . . . 10
3 Data Collection and Processing 13 3.1 Datasets . . . 13
3.2 Identifying tourists and residents . . . 16
3.3 Data limitations . . . 17
4 Behavior of tourists in different cities worldwide 19 4.1 Number and time interval of check-ins . . . 19 4.2 Places visited . . . 21 4.3 Routines . . . 23 4.4 Preferences of tourists . . . 25 4.5 Domestic and foreign tourists . . . 28 4.6 Discussion . . . 32
5 Understanding Tourist’s Mobility 33
5.1 Displacement measures . . . 33 5.1.1 Mean user displacement . . . 33 5.1.2 Radius of Gyration . . . 34 5.2 Centrality metrics on spatio-temporal urban mobility graphs . . . 36 5.2.1 Spatio-temporal urban mobility graphs . . . 36 5.2.2 Popular venues in the city . . . 37 5.2.3 Spreading information . . . 41 5.2.4 Bridge Places . . . 43 5.2.5 Validating the results . . . 44 5.3 Profiles of Tourists Based on Mobility Patterns . . . 45 5.4 Discussion . . . 50
6 Applications 53
6.1 Profile of consumers . . . 53 6.2 Where should I go? . . . 59 6.3 Discussion . . . 64
7 Conclusion 65
Bibliography 67
Chapter 1
Introduction
1.1
Motivation
We are in an era where social networking platforms are being massively and pervasively used, thanks to mobile devices with powerful networking and computing capabilities. Among these capabilities, resources like GPS has been used widely and in a global level. Some social networks support geolocalization features that allows users to share useful data about urban environments. These networks can be seen as a source of social sensing, called Participatory Sensor Networks, and it enables new research opportu-nities, such as those related with new patterns of users interactions in the city. For instance, Foursquare, one of the most popular PSN, allows users to share visited loca-tions, enabling unprecedented opportunities for the large scale study of urban social behavior [Silva et al., 2014a].
Tourism truly has become a global economic and social force [Staab et al., 2002]. Tourists may have different desires from those in their home routines. In addition, factors such as cost, distance and personal preferences influence activities a tourist conducts in the visited city. Understanding how tourists move through time and space, and the factors that influence their movements, has important implications in several segments, ranging from transport development to destination planning.
The study of tourist movements is an under-explored facet of tourism scholarship [Lew and McKercher, 2006; Fennell, 1996]. Despite some efforts in the area, very few have attempted to model the actual movement patterns of tourists in large scale [Zheng et al., 2009; Yoon et al., 2010]. In this work, we show how we can use data shared by Foursquare users, the so-called check-ins, to better understand mobility of tourists that would be hard using traditional methods, such as surveys. A check-in is an action performed by the user to register and share his/her location at any given time. It is a
2 Chapter 1. Introduction
voluntary contribution provided by the user that allows the study of human behavior at different granularities, leading to a better understanding of urban areas, such as the identification of popular places [Silva et al., 2014a].
We consider spatio-temporal aspects of the behavior of tourists and residents. Spatial patterns are related to the different types of places available in the city. It is important to analyze this dimension because, for example, the number of check-ins at a given location may vary according to its popularity and category (i.e., a type of place, for instance, restaurant). Temporal patterns are related to events that occur at certain time slots. This is also another important dimension, since the behavior of users may vary, for instance, during different moments of the day. The joint treatment of these two dimensions is critical to understand the behavior of users and the dynamics of the city where a given person is.
1.2
Objectives
The main objective of this study is to answer the question: is it possible to use partic-ipatory sensor networks to study the behavior of tourists? To that end, a fundamental step is to evaluate the potential of using participatory sensor networks to extract use-ful properties of tourists and residents behavior in a city. Thus, we tackle the main objective of this study answering three different questions:
1. Which and when places are more important to tourists and residents? The tem-poral property influentiate on spatial choices?
2. Can we find unique properties of behavior of these two classes of users?
3. Can the mobility inside of cities to bring new information about tourists and residents behaviour?
4. Can we explore these properties for new services and applications?
1.3
Contributions
The contributions of this work can be summarized as follows:
1.3. Contributions 3
and routines in four popular cities around the world in four continents: London, New York, Rio de Janeiro, and Tokyo. Besides that, we perform a large scale study of tourists mobility from several aspects. For example, we use a spatio-temporal graph model to study urban mobility of tourists of the studied cities. We show that it is possible to find popular transitions among tourists, and typical time that tourists visit certain places. This model also allows to identify central places in the tourist mobility and how they could be explored to evolve the urban computing area;
• We propose a new methodology, based on a topic model, that enables the auto-matic identification of mobility pattern themes, which, ultimately, leads to the better understanding of users’ profile. In this methodology, a user is considered a document, and the categories of places visited by him/her are the words de-scribing the documents. With that, we are able to extract topics that describes typical user movements;
• We demonstrate the applicability of our results in two particular cases: 1) new itinerary recommendation system, based on the mobility pattern themes and the spatio-temporal graph model, that not only suggests a place, but, which place to go after a certain one and a certain time; 2) we also show that our methodology could be used for business owners to understand how to offer a better service for tourist in different locations that could be culturally distinct.
Part of the contributions of this work was reported in the papers:
• FERREIRA, A. P. G.; SILVA, T. H. ; LOUREIRO, A. A. F. . Beyond Sights: Large Scale Study of Tourists’ Behavior Using Foursquare Data. In: Workshop on Mobility Analytics from Spatial and Social. Proceedings of IEEE International Conference on Data Mining (ICDM). Atlantic City, United States. 2015;
• FERREIRA, A. P. G.; SILVA, T. H. ; LOUREIRO, A. A. F. . Você é o seu check-in: entendendo o comportamento de turistas e residentes usando dados do Foursquare. In: Simpósio Brasileiro de Sistemas Multimídia e Web (WebMedia). João Pessoa, Paraíba, Brazil. 2014;
4 Chapter 1. Introduction
Some contributions derived from this study was also explored in the following collaborations:
• Silva, Thiago H.; CUNHA, F. D. ; TOSTES, A. I. J. ; BORGES NETO, J. ; CELES, C. S. F. S. ; MOTA, V.F.S. ; FERREIRA, A. P. G. ; MELO, P. O. S. V. ; Almeida, J. ; Loureiro, A. A. F. . Users in the Urban Sensing Process: Challenges and Research Opportunities. Chapter in Next Generation Platforms for Intelligent Data Collection. 1ed. v.1 , p. 45-95. Elsevier (Amsterdam). 2016;
• SILVA, T. H. ; FERREIRA, A. P. G. ; BORGES NETO, J. ; RIBEIRO, A. I. J. T. ; CELES, C. S. F. S. ; CUNHA, F. D. ; MACHADO, K. L. S. ; MOTA, V. F. S. ; MINI, R. A. F. ; MELO, P. O. S. V. ; LOUREIRO, A. A. F. . Redes de Sensoriamento Participativo: Desafios e Oportunidades. Minicursos / XXXIII Simpósio Brasileiro de Redes de Computadores e Sistemas Distribuídos. Sociedade Brasileira de Computação. V1, p. 266-315. 2015.
1.4
Work Organization
Chapter 2
Related Work
This section is organized as follows. Section 2.1 introduces Human as sensor. In Section 2.2 it discuss related work on behaviour of human mobility. In Section 2.3 it shows some applications related to tourist mobility and touristic places recommendations. Finally, in Section 2.4 we discuss the topics presented and how they are related with our work.
2.1
Contextualization
2.1.1
Human as Sensors
The Internet was one of the greatest revolutions in communication in the history. Since it was a project for academic and military purposes to a means of communication between any computer in the world, we have witnessed what can be achieved when there is collaboration. Through e-mail lists to a collaborative encyclopedia, the Internet helped us to solve many problems of everyday life with collaboration and information. The evolution of the Internet has spread beyond computers: other devices have been added to the lives of people and the connection with the world. Today it is possible to connect with smartphones, watches, cars and televisions, having access to information in real time and anywhere.
Combined with the devices and increased Internet availability and connection speed, the services also followed the evolution. In addition to sites with listings of jobs and products for sale, for example, we have also websites that connect people: the social networks. Social networks are a structure that connects individuals in specific types of interdependency, such as friendship, common interests and knowledge sharing [Zheng,
6 Chapter 2. Related Work
2011]. Networks like Facebook1
, G+2
and Twitter3
became a channel of communication between people and their friends and between people and their interests. Books, movies, technology forums - many groups that share the same interests were formed and joined with the help of the Internet.
All areas were affected with the use of computers and the Internet, from large to small businesses. While large companies have automated their processes and improved communication through computers, small business and restaurants were able to increase their visibility through the reviews on specialized sites to list places in cities. Through collaboration sites emerged to share photos, reviews and also tourist itineraries.
Considering people and the sharing of different types of data we can say that human beings act as a kind of sensor. To understand more about this subject in Section 2.1.2 we talk about Participatory Sensor Networks.
2.1.2
Participatory Sensor Networks
Social networks allow many people to share information much more quickly. This allows to discover new places and their characteristics from what people post on these networks in real time. Considering the growth in the use of mobile devices such as smartphones, Location-based Social Networks (LBSNs) have become quite popular, especially because they help to reduce the gap between the real world and online services based on social network [Zheng, 2012].
Location-based Social Networks are social networks that include information about the location on the content that is voluntarily shared by users [Roick and Heuser, 2013]. The concept of location can be represented by: 1) geographical position, repre-sented by latitude and longitude; 2) a region (approximate position) and 3) a nominal location (such as home, work, shopping) [Zheng, 2012]. These networks allow users to share information about where they are.
The data from social networks based on location can be seen as a valuable source of sensing, where the sensors are the users (humans as sensors), who share information about their context from their mobile devices. Users send information similarly to sensors in a traditional sensor network on a voluntary basis. In fact, LBSNs are the most popular examples of Participatory Sensor Networks (PSNs), sensing network where sensor nodes are formed by users, who use their mobile devices to send data about their context [Silva et al., 2014b]. Figure 2.1 can view a representation of the PSNs and its interaction with users from the study by [Silva et al., 2014a].
2.2. Understanding Mobility 7
Figure 2.1. Illustration of a Participatory Sensor Network. This image was obtained from [Silva et al., 2014a]
Some examples of PSNs are: Instagram4
for photo sharing, Waze5
for sharing problems in traffic and Foursquare6
for location sharing. All these services use geo-graphic data to provide services / useful information to its users. Data such as weather, photos or the sport a user is practicing can be shared in real time on these networks.
Each shared data in a participatory sensor network is associated with the pref-erences and habits of users. Such data make it possible to study large-scale urban behavior of people and the dynamics of cities [Silva et al., 2014a]. In this work we consider the temporal and spatial aspects of the data shared in PSNs for our analysis.
2.2
Understanding Mobility
This section discusses studies about the use of PSN data to discover how people be-have and their habits inside cities, including patterns of mobility. We divided the work into three groups: mobility studies with traditional data, such as GPS traces (Section 2.2.1); works that study mobility with social data, such as PSNs data (Sec-tion 2.2.2); and studies that focus specifically on the study of mobility of tourists in cities (Section 2.2.3).
2.2.1
Studying Mobility Through Traditional Data
This section discusses studies that investigate human mobility and how it works inside of the cities. Human mobility is a fundamental aspect of the dynamics of a city and is the object of study of other areas, such as anthropology and biology. One approach
4
https://www.instagram.com/
5
https://www.waze.com
6
8 Chapter 2. Related Work
to perform this type of study is use digital traces from users, such as GPS traces. In the literature, there are several studies about users’ habits and routines in a city using digital traces. Some of them analyzed GPS data and cellular footprints of users to understand, for instance, their usual trajectories [Choujaa and Dulay, 2009; González et al., 2008].
Some researchers used the Levy Walk, pattern of movements of the animal king-dom that combines long paths with short ranking-dom movements, to study human move-ment with GPS data[González et al., 2008; Karamshuk et al., 2011; Kung et al., 2014]. However, only the drive is not enough to understand the context of the user at that time. According to [Karamshuk et al., 2011], human movements are highly predictable but it is crucial to take into account the spatial and temporal patterns regular. It is difficult to gather traditional data of users’ mobility, this work focused on alternative sources. Work related to the use of these sources are discussed in the next section.
2.2.2
Studying Mobility Through Social Data
Other studies used data shared in participatory sensor networks, such as check-ins from Foursquare, to understand several aspects of urban social behavior and mobility [Cheng et al., 2011; Pianese et al., 2013; Long et al., 2013; Preo and Cohn, 2013; Lv et al., 2013; Cho et al., 2011].
Aware that human beings are endowed with similar behaviors in their mobility, the authors [Cheng et al., 2011] used 22 million check-ins shared on Twitter7
to extract a pattern of mobility in shares, and it showed that users adopt periodic behavior and they are influenced by their social, geographical and economic status. In addition to the spatial knowledge discovery potential, messages (e.g. tips) in check-ins can also reveal interests and feelings. In the same direction, [Pianese et al., 2013] used check-ins shared on Foursquare to group and discover communities and places of interest.
Some works are dedicated to the study of habits and user routines in a city. Through GPS records and signals of cellular networks it is possible to understand with good accuracy which way users perform often, as we discussed in Section2.2.1. Other studies performed studies in this area using data from social networks [Lv et al., 2013; Preo and Cohn, 2013; Pianese et al., 2013]. However, finding patterns from data from social networks brings a greater challenge, since there is an irregularity in the distribution of data over time among users [Pianese et al., 2013] also not always users are encouraged to share data [Lindqvist et al., 2011]. Despite that, several studies have found evidence that the realization of this type of study using data from social
7
2.3. Applications based on tourist mobility 9
networks is possible. For instance, [Pianese et al., 2013] was able to identify patterns in days and times in the activities of users and [Preo and Cohn, 2013] identified user behavior profiles.
2.2.3
Mobility of Tourists and Residents
This section shows some of the main studies about how tourists move and which pat-terns are recognized in their mobility. Tourism is one of the important economic activi-ties that promotes regional economic growth [Staab et al., 2002]. It is the displacement of their place of residence to a different one, where there is a meeting of cultures and the search for new experiences. A tourist may have different needs than you are used to your routine. In addition, factors such as cost, climate and personal preferences influence the activities to be carried out by the tourist visited city. Thus applied to the tourism economy can understand the factors that influence this decision consumption [Sharpley and J, 2002].
Despite the efforts in understanding urban mobility mentioned in Sections 2.2.1 and 2.2.2 very few studies investigated urban tourist mobility in large scale [Lew and McKercher, 2006; Fennell, 1996]. [Zheng et al., 2009] analyzed 107 GPS logs of users during a period of one year. They concluded that the movement of tourists and resi-dents are different and the behavior of tourists is influenced by their traveling experience and their personal relationships.
There are also many proposals that consider data from social data shared in PSNs. For example, [Silva et al., 2013b] showed how to extract touristic sights using shared photos on Instagram. In addition to the locations, you can also extract information from events that attract tourists to the cities. Besides that, [Hallot et al., 2015] used check-ins performed at the Art Institute of Chicago to show evidences that it is possible to use this source of data to infer the behavior of tourists. In the same direction, [Long et al., 2013] investigated traveler mobility patterns by mining the latent topics of users’ check-ins performed in one city in the United States.
[Long et al., 2013] investigated the categories and latent topics related to tourists in a city on Foursquare and identified characteristics of the city that were related to the interests of tourists.
2.3
Applications based on tourist mobility
10 Chapter 2. Related Work
smarter destination planning and urban planning to better support tourists. In this section we introduce some applications focused on tourist mobility and places recom-mendation for this segment of users.
In the same direction of personalized itineraries, [Yoon et al., 2010] proposed an architecture of the recommendation itineraries for tourists, considering the length of the stay and their interest. [Diplaris et al., 2012] created the SocialSensor, a framework that integrates the user’s interests and real-time search context. [Zheng, 2014] proposed a recommendation system that exploits the interests of users and similarity between different users, using a collaborative filtering approach and TripAdvisor Data8
. Still following the studies that were based on social data we can quote [Choudhury et al., 2010] and [Majid et al., 2012] who used photos from Flickr9
to automatically generate tourist itineraries. [Shi et al., 2011] use the same approach but focused on recommendations of Landmarks and adding data from Wikipedia10
to enrich the rec-ommendation. [Hsieh et al., 2012] developed TripRec, an application to recommend tourist itineraries based on check-ins.
Exploring more user preferences, [Basu Roy et al., 2011] developed an application where users give feedbacks and iteratively construct their itineraries based on personal interests and available time. [Yerva et al., 2013] proposed an itineraries recommenda-tion system based on user preferences, using data from Lonely Planet, Foursquare and Facebook to suggest locations. [Baraglia et al., 2013] a prediction is made of the next point of interest to the tourist, based on his/her historic, and with this, recommend the next Point of Interest (POI) to the user.
Observing other aspects, such as the perspective of the business area [Karamshuk et al., 2013] have identified the best solution for retail, using social networking data, demonstrating the usefulness of such data for business. From the perspective of events with a tourist view, [Morais and Andrade, 2014] investigated the relevance of messages shared by tourists and residents during a massive event tour on an famous brazilian event.
2.4
Discussion
A differential of our work is consider people as sensors in cities and examine how they behave, either as tourists or as residents, watching in the spatio-temporal perspective. As we discussed, several studies differ from ours since they are based on GPS logs,
2.4. Discussion 11
whereas we use sensed data from PSNs and our focus is on better understanding the behaviour of tourists and residents.
Related studies that use social data to study mobility and preferences of tourists focused, typically, on just one city. Our work goes beyond the study of the mobility and preferences of tourists in a place or a city; It is a large-scale study of these aspects in four different cities considering tourists and residents. When considering various different cities different regions of the world, we can visualize the behavior patterns that emerge, and to understand how the cultural traits shape these behaviors.
Chapter 3
Data Collection and Processing
This section describes the dataset used in this work, as well as how we collect and filter the data, and the procedures used to identify tourists.
3.1
Datasets
We collected check-in from Foursquare, nowadays one of biggest LBSNs with 60 milions of users registered. To retrieve the check-in performed on Foursquare we used the Twitter service, where they are publicly available. This was only possible for Foursquare users who shared their check-in on Twitter, which provides a streaming API1
to obtain tweets in real time. Today Foursquare company is divided in two apps, one app, called Swarm2
, is responsible to register just check-in of the users. The other app, which is named Foursquare, is focused on recommend places to users. Because during the time we collected the data this changes in the Foursquare company had not yet happened, we will not mention Swarm anymore in the remainder text. In Figure 3.1 we can see an example of check-in shared on Twitter and in Figure 3.2 we can see the check-in page (accessed through the URL shared on Twitter). In the check-in URL we can also get the venue URL as shown in Figure 3.3.
After retrieved tweets with check-in, we performed an extra collection using the Foursquare API3
to retrieve information about the venue, such as the name and reason of the visit. The complete data collection process is displayed in Figure 3.4.
We gathered data from different cities around the world: London/United King-dom, New York/United States, Rio de Janeiro/Brazil and Tokyo/Japan. We chose
1
https://dev.twitter.com/docs/streaming-apis
2
https://www.swarmapp.com
3
https://foursquare.com/api
14 Chapter 3. Data Collection and Processing
Figure 3.1. Tweet with check-in information. In 1) the check-in URL, 2) the time and date, 3) geolocalization from Twitter.
Figure 3.2. Swarm’s/Foursquare’s page with check-in details. In 1) User name and 2) the name and link of the venue.
3.1. Datasets 15
Figure 3.4. Illustration of the complete process to collect check-in data
those cities because they represent distinct regions of the world, representing, potten-cially, users with cultural differences as well.
We collected data in April, June and July of 2014. Table 3.1 presents more details about number of check-in and users. In table 3.2 the number of check-in is specified by city.
Table 3.1. Number of check-in and unique users by dataset
# of check-in # of users April, June and July of 2014 151.501 13.356
Table 3.2. Number of check-in by city and dataset
London New York Rio de Janeiro Tokyo
5.884 32.554 61.886 51.177
Each check-in has the following attributes: check-in ID, user ID, time and geo-graphic coordinate (latitude and longitude), category and subcategory of the check-in’s location, i.e., the type of place where it occurred. The Foursquare categorizes places in 10 categories: Arts & Entertainment, College & University, Food, Professional & Other Places, Nightlife Spots, Residences, Great Outdoors, Shops & Services, Travel & Transport, Events. Each of these categories has subcategories, totaling more than 350 subcategories. The Foursquare categorization sometimes might group subcategories that are very specific subcategories. For example, Travel & Transport contains the subcategories Hotels and Train Stations. In order to have a clear view of the users’ habits, we created a classification of places, grouping subcategories that are more re-lated to each other. For instance, we created the two new categories: transport and travel. Transport contains the subcategories like Airport, Bus Stop and Rental Car Lo-cation, and Travel contains the subcategories like Bed & Breakfast, Hostel and Resort. Table 3.3 shows this classification.
16 Chapter 3. Data Collection and Processing
Category by Foursquare New Category
Arts & Entertainment arts
College & University school
Event entertainment
Food / Nightlife Spot drink
Food fastfood
Food restaurants
Nightlife Spot / Event entertainment
Outdoors & Recreation outdoors
Outdoors & Recreation sports
Professional & Other Places city
Professional & Other Places health
Professional & Other Places professional
Professional & Other Places religion
Residence home
Shop & Service services
Shop & Service shopping
Travel & Transport transport
Travel & Transport travel
Table 3.3. New classification to each category group of Foursquare
3.2
Identifying tourists and residents
After collecting the data we needed to separate data coming from tourists and residents. For this we identified the city where the user spent most time, with at least 21 days of stay, based on check-in intervals4
. From the check-in sequence performed in each city we check how many days were spent on them. For example, if a user performed a check in on city A on 5/may/2016 and another check-in the same city on 30/may/2016, we assume that he/she stayed 25 days in city A. Eventually, a user may have been in different cities for more than 21 days, in this case we consider the user’s city where he spent most time. If a user give a check-in in a city different of his home he is considered a tourist on that city. This tourist identification process has also been used by other researchers in the work [Paldino et al., 2015; Choudhury et al., 2010]. We used this process in all datasets considered in this work.
City Tourists Residents
New York 737 2.584
Rio de Janeiro 498 3.550
London 584 514
Tokyo 629 4.260
Table 3.4. Number of tourists identifyied in each city
For cities chosen for the analysis we filter all check-in belonging to each of them using the geographic coordinates of check-in. Then we divide the data among tourists and residents, using the residence criteria identified in the process described above. In table 3.4 it is possible to find the number of unique users identified. Users that
4
3.3. Data limitations 17
we could not identify his/her resident because of lack of data were excluded from the analysis.
3.3
Data limitations
Conducting research using social networking data allows us to capture what is happen-ing in the world in near real time. The use of this data is provhappen-ing to be increashappen-ingly powerful for the study of urban behavior [Silva et al., 2013a; Zheng et al., 2014], provid-ing advantages, for example faster responses and cheaper cost, over other traditional methods for this purpose, such as surveys and interviews. Although it has many advan-tages, data from social networks may have limitations. One is the amount of data that can be collected from those services. For example, the Twitter API has a limitation of 1 % of the total volume of data produced, this means that we can not have all the data we want for a given application. In addition, less than 25% of Foursquare users push their check-in Twitter [Long et al., 2013].
Chapter 4
Behavior of tourists in different
cities worldwide
Tourists can behave differently at different cities, depending on the purpose of their visit. Rio de Janeiro, London, Tokyo and New York have particular characteristics, such as different dynamics and local culture, and because of that they may attract tourists with different tastes. Since the behavior of tourists in different cities may be different it is interesting to study tourists’ behavior separately for each city considered in this study. For that, in this chapter we show how we can use Foursquare check-ins to understand how tourists behave in different cities.
Analysing tourists and residents in Rio de Janeiro, London, Tokyo, and New York, we observe significant differences between the behavior of those classes of users in several cases. This chapter is organized as follows. Section 4.1 presents a temporal analysis of the check-ins shared by users. Section 4.2 presents differents places visited by each class of user. Section 4.3 presents the behavioral properties of tourists and residents in differents routines. Section 4.4 shows the preferences of tourists inside the cities. Section 4.5 studies the behavior of domestic and foreign tourists. Finally, Section 4.6 presents the discussion of this chapter.
4.1
Number and time interval of check-ins
Figures 4.1 and 4.2 show the distribution of the number of check-ins and distribution of interval time (in hours) of check-ins made by the same user, tourists and residents, in each city, respectively.
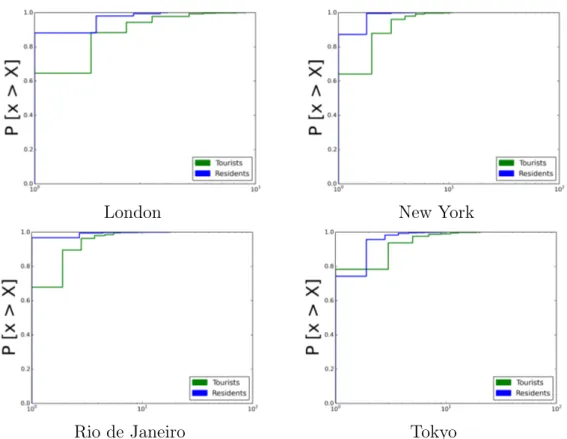
With the help of Figure 4.1 we can see that all the cities analyzed have more tourists than residents performing check-ins. Although there is a difference between the
20 Chapter 4. Behavior of tourists in different cities worldwide
(a)
London New York
Rio de Janeiro Tokyo
Figure 4.1. Distribution of the number of check-ins performed by tourists (green) and residents (blue)
cities, almost all of them follow the same pattern of behavior of tourists and residents. We believe that this behavior is directly related to people’s motivation to do check-ins during the trips because they are more motivated by the new experiences and places that they are discovering and want to share it with their friends [Bilogrevic et al., 2015]. Unlike the distribution of the number of check-ins, the distribution of check-ins range shown in the Figure 4.2, given in hours, varies between cities. New York and Tokyo have similar behaviors, with tourists and residents share check-ins at similar intervals. Many of the users who check-ins in these cities perform check-ins on a long space. In London and in Rio de Janeiro are similar behavior among themselves, tourists and residents tend to share in a smaller amount of time when compared to Tokyo and New York. However, in London and in Rio de Janeiro tourists share more frequently and in a shorter time interval. These differences can be seen as evidence of the tourist behavior characteristics while they are in these cities.
4.2. Places visited 21
(a)
London New York
Rio de Janeiro Tokyo
Figure 4.2. Distribution of the time interval (in hours) between the check-ins performed by tourists (green) and residents (blue)
4.2
Places visited
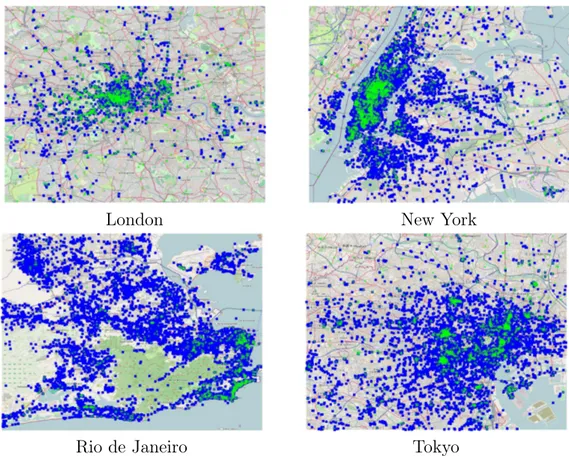
Study the visited sites also helps us to improve our understanding of the diferences in these classes of users, which can be useful for government and tourism stakeholders. With this information the government can, for example, know more precisely what places should receive more or less investment or advertising to improve tourism in the city, and what should be improved in the city to allow access to these places.
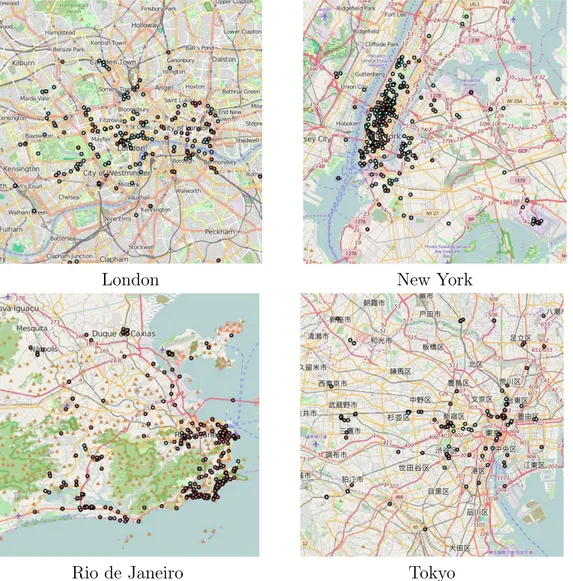
In this direction, Figure 4.3 shows the places where tourists (green) and residents (blue) performed check-ins in London, New York, Rio de Janeiro, and Tokyo. As we can see, certain areas are more visited by tourists than others. For example, in Rio de Janeiro, most of the tourist activity is concentrated by the sea in a specific area (bottom-right of the figure), where most of the tourist attractions are located, whereas in New York, Manhattan island is the most popular destination of tourists.
22 Chapter 4. Behavior of tourists in different cities worldwide
expected, such as Times Square and the Empire State Building in New York, Oxford Street and The Buckingham Palace in London. Other places also very popular might not be traditional sights, such as FIFA Fan Fest in Rio de Janeiro, which is a special place created in the city for tourists and residents during the 2014 FIFA World Cup, event that the city hosted, attracting many tourists. This examples illustrates auto-matically identified dynamic changes in the popularity of places for tourists in the city, including new places and the ones that may exist only for a short period of time.
Looking at the ranking of residents (Table 4.2) we can identify places that are also frequented by tourists, such as airports, shopping malls and parks. However, one can view a different pattern in the types of places. Residents tend to go more in places related to daily routines, such as universities, places to practice sport and restaurants.
Tokyo is a peculiar example in our dataset. The most popular places among tourists and residents are train stations. The rail network in Tokyo is one of the world’s largest, which explains the large volume of check-ins of tourists and residents in their stations, using the system either to explore the city or move to perform daily routines. Even though we do not have sights as the top places in that city, those stations give hints of what are the preferences of tourists. Some stations are the same for the two classes, for example, Akihabara, Tokyo and Shinjuku Station. This was expected because around those stations there are several places that attracts tourists and residents. For example, Shinjuku Station arehat world’s busiest railway station, handling more than two million passengers every day. Around Shinjuku Station there is large entertainment, business and shopping area. West of the station is Shinjuku’s skyscraper district, home to many of Tokyo’s tallest buildings, including several premier hotels and the twin towers of the Metropolitan Government Office, whose observation decks are open to the public for free. Besides that, there are stations that are more popular among tourists, such as Ueno Station. Next to this station is Ueno Park, a large public park that attracts thousands of tourists. Today Ueno Park is famous for the many museums sssettled on its grounds, especially the Tokyo National Museum, the National Museum for Western Art, the Tokyo Metropolitan Art Museum and the National Science Museum. It is also home to Ueno Zoo, Japan’s first. Additionally, Ueno Park is one of Tokyo’s most popular and lively cherry blossom spots with more than 1000 cherry trees lining its central pathway1
.
We have seen that the most visited by tourists and residents provides valuable information for understanding the behavior and motivation in the city. However, there are other factors, such as time, which can provide an additional perspective on this
1
4.3. Routines 23
(a)
London New York
Rio de Janeiro Tokyo
Figure 4.3. Places where tourists (green) and residents (blue) performed check-ins
understanding. And exploring this is the aim of next sections.
4.3
Routines
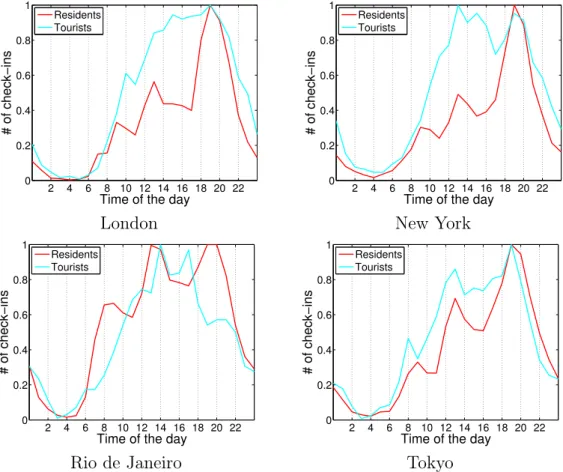
Tourists and residents perform similar activities in the city, such as eating [Colombo et al., 2012], however there may be differences in the pattern of behavior in performing those activities. Figure 4.4 show the temporal variations of the number of check-ins shared throughout the hours of the day for weekdays and Figure 4.5 show this information for weekends.
24 Chapter 4. Behavior of tourists in different cities worldwide
Rio de Janeiro London New York Tokyo
Aeroporto do Galeão
Starbucks John F.
Kennedy Air-port
秋葉原駅 (Aki-habara Sta.)
Aeroporto San-tos Dumont
Harrods Times Square 東京駅 (Tokyo
Sta.) Estádio
Mara-canã
The London Eye LaGuardia Air-port
新 宿 駅 (Shin-juku Sta.)
Praia de Co-pacabana
London Starbucks 渋谷駅 (Shibuya
Sta.) Rio de Janeiro Piccadilly
Cir-cus
Apple Store 池 袋 駅
(Ike-bukuro Sta.)
Starbucks Oxford Street Empire State
Building
和 光 市 駅
(Wakoshi Sta.) (TJ-11/Y-01/F-01) Terminal Rodoviário Novo Rio London Euston Railway Station Museum of Modern Art
JR 東海道新幹
線 東京駅
FIFA Fan Fest Hyde Park American
Mu-seum of Natural History
品川駅 (Shina-gawa Sta.)
Praia de
Ipanema
Buckingham Palace
Yankee Stadium JR 品川駅
Shopping RioSul British Museum The Metropoli-tan Museum of Art
上 野 駅 (Ueno
Sta.)
Table 4.1. Ranking of most popular venues for Tourists
tourists follows more similarly the behavior of residents, because of the three peaks of activity in common. Note, however, that the activity of tourists tend to be more intense during the day. This might mean that Tokyo attracts a different kind of tourist that tend to perform activities in a regular way, for example having lunch in the same time of residents of Tokyo, helping to explain the observed pattern and understand better the city tourists.
4.4. Preferences of tourists 25
Rio de Janeiro London New York Tokyo
FIFA Fan Fest Cineworld Starbucks 秋葉原駅
(Aki-habara Sta.)
McDonald’s Vue Cinema Equinox 新 宿 駅
(Shin-juku Sta.) BarraShopping Starbucks LaGuardia
Air-port
渋谷駅 (Shibuya Sta.)
Outback Steak-house
BFI Southbank John F.
Kennedy Air-port
池 袋 駅
(Ike-bukuro Sta.)
Universidade Estácio de Sá
Hyde Park Planet Fitness 東京駅 (Tokyo
Sta.) Aeroporto do
Galeão
The O2 Arena New York Sports Club
東京国際展示場
(東京ビ ッ グ サ
イ ト/Tokyo Big
Sight) Estádio
Mara-canã
The King Fahad Academy
Crunch 吉 祥 寺 駅
(Kichijoji Sta.) Universidade
Veiga de
Almeida
Harrods Blink Fitness ヨドバシカメラ
マ ル チ メ デ ィ アAkiba
Starbucks InMobi Citi Field 原宿駅
(Hara-juku Sta.)
NorteShopping Soho Square New York
Health & Rac-quet Club
中野駅 (Nakano
Sta.)
Table 4.2. Ranking of most popular venues for Residents
4.4
Preferences of tourists
26 Chapter 4. Behavior of tourists in different cities worldwide
(a)
2 4 6 8 10 12 14 16 18 20 22 0 0.2 0.4 0.6 0.8 1
Time of the day
# of check−ins
Residents Tourists
London
2 4 6 8 10 12 14 16 18 20 22 0 0.2 0.4 0.6 0.8 1
Time of the day
# of check−ins
Residents Tourists
New York
2 4 6 8 10 12 14 16 18 20 22 0 0.2 0.4 0.6 0.8 1
Time of the day
# of check−ins
Residents Tourists
Rio de Janeiro
2 4 6 8 10 12 14 16 18 20 22
0 0.2 0.4 0.6 0.8 1
Time of the day
# of check−ins
Residents Tourists
Tokyo
Figure 4.4. Temporal check-in sharing pattern throughout the day by tourists and residents during weekdays
Figure 4.6. Check-ins frequency for each category by tourists and residents by city
4.4. Preferences of tourists 27
(a)
2 4 6 8 10 12 14 16 18 20 22
0 0.2 0.4 0.6 0.8 1
Time of the day
# of check−ins
Residents Tourists
London
2 4 6 8 10 12 14 16 18 20 22
0 0.2 0.4 0.6 0.8 1
Time of the day
# of check−ins
Residents Tourists
New York
2 4 6 8 10 12 14 16 18 20 22 0 0.2 0.4 0.6 0.8 1
Time of the day
# of check−ins
Residents Tourists
Rio de Janeiro
2 4 6 8 10 12 14 16 18 20 22 0 0.2 0.4 0.6 0.8 1
Time of the day
# of check−ins
Residents Tourists
Tokyo
Figure 4.5. Temporal check-in sharing pattern throughout the day by tourists and residents during weekend
by tourists, such as hotels, airports and monuments, whereas others such as houses, markets, colleges and universities were expected to be more popular among residents. Depending on the city, the number and popularity of certain categories vary. In Tokyo, for example, it is not popular for residents to perform check-ins in places such as their
residence, unlike other cities, where residents typically perform check-ins places that belongs to that category. This is the case of Brazil, where residents perform many check-ins in the category home, indicating a minor concern about their privacy. These results could be explained by cultural differences.
28 Chapter 4. Behavior of tourists in different cities worldwide
Residents in New York City visited significantly baseball stadiums, a very popular sport in that city. In Rio de Janeiro, the subcategory related to barbecue restaurants received many visits, reflecting a typical habit of the local culture. London is known for its pubs and nightlife, beyond the great historic sites, and this behavior is reflected in the category of places visited by tourists and residents. This results are interesting because they reflect typical cultural differences among the studied cities, fact that could be explored, for instance, in new recommendation systems.
4.5
Domestic and foreign tourists
Analyzing the tourists within the cities, we can also separate them into two different classes: domestic tourists and foreign tourists. Domestic tourists are tourists who come from cities in the same country, and foreign tourists come from different countries. Through the process of classification of tourists and residents explained in section 3.2) it is possible to classify where people are originally from. A tourist is classified as domestic if his/her city of origin belongs to the same country of the city he/she is visiting and as foreign if his/her home city is outside the country of the city where he/she is considered a tourist.
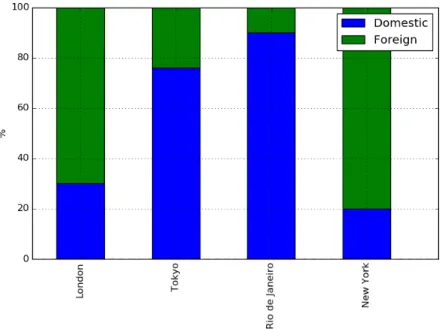
Figure 4.7. Foreigners and Domestics Tourists by city
4.5. Domestic and foreign tourists 29
for example, receive more domestic tourists, more than 75% in both cities. While in London and New York, most tourists are foreigners.
(a)
London New York
Rio de Janeiro Tokyo
Figure 4.8. Places where foreigns (blue) and domestics (red) performed check-ins
30 Chapter 4. Behavior of tourists in different cities worldwide
All these facts might prevent a portion of foreign tourists to move around by themselves in those cities.
Besides those insights, studing the amount of foreign tourists in the cities gives us a sense of how cosmopolitan a city is. In order to dig further the behavior of those classes we can study the temporal behavior of foreign and local tourists and also their preferences of places.
(a)
London New York
Rio de Janeiro Tokyo
Figure 4.9. Temporal check-in sharing pattern throughout the day by domestic and foreign tourists during weekdays
4.5. Domestic and foreign tourists 31
reasons, in Rio de Janeiro the violence rate is higher than in New York, these facts prevent many tourists from going out at night time in Rio.
Still analyzing the behavior during weekdays we can see that most peaks of ac-tivities tend to be displaced for an hour. This is an evidence that foreigners may be bringing their habits to the city where they are. We omitted the results for week-ends because the differences are not very significative, and the main message passed analyzing weekdays are still valid.
Figure 4.10. Check-ins frequency in each category by foreigns and domestics tourists by city
Understanding which are preferred places for domestic and foreign tourists helps us also to realize what the characteristics of each profile of tourists are in those cities. Figure 4.10 shows a radar chart representing the popularity of category of places for foreigners (left figure) and domestic (right figure). The popularity of categories of places was measured as we explained above.
Studying this result we can see that domestic tourists preference restaurants in Tokyo, while foreigners prefer shopping activities. Domestic tourists in Rio de Janeiro prefer outdoors and places to drink. Foreigners in Rio de Janeiro prefer places related to shopping, restaurants and arts. In London, the foreigners preference is more towards sports, while among the locals preference is greater for shopping. While foreigners like to attend places under outdoor category in New York, domestic tourists prefer entertainment places, which might demand greater knowledge of the city.
32 Chapter 4. Behavior of tourists in different cities worldwide
4.6
Discussion
Some of the challenges to the understanding of useful properties on the behavior of tourists is to find appropriate metrics. To begin our study, our hypothesis was that tourists have more free time (no predefined routine) while residents have tied behavior to daily routines.
Beyond the time aspect, the places visited say a lot about the tourist and the purpose of visit. As from a spatial analysis of activity in the city we could see which regions the tourists were more concentrated and also the locations of the top most visit sights in each city, which showed what the most visited places in each city are.
Chapter 5
Understanding Tourist’s Mobility
The user mobility within cities can bring rich information about the dynamics of the urban environment, as well as habits of these users on their routines in the city. Using spatial data that implicitly express the preferences of users by specific locations in the city, such as check-ins, we have the possibility to know where people come from and where they go. This, as we show in this chapter, enables us to distinguish the profile of these users mobility within cities, which can be quite distinct between different cities. In this chapter we studied the mobility of tourists from different perspectives. In section 5.1 we analyze the movement of tourists in the city using two well known metrics for this purpose. In section 5.2 we use complex networks centrality metrics in spatial-temporal graphs that capture the movement of users throughout the hours of the day. Finally, in section 5.3 we demonstrate that it is possible to extract different mobility profiles based on observed movement of users.
5.1
Displacement measures
In this section we present an spatial analysis of tourists movements using the mean user displacement as shown in 5.1.1 and radius of gyration as shown in 5.1.2. These two metrics are useful to study human mobility and its implications.
5.1.1
Mean user displacement
Thinking about mobility, it is interesting to analyze the displacement of the users inside the cities. To do that, we start with a study of the mean user displacement. The mean user displacement is the mean of the cumulative distance traveled by an user. To discovery that we calculate the total distance-based displacement of consecutive
34 Chapter 5. Understanding Tourist’s Mobility
check-ins vn made by users and divide this value by the total number of check-ins N the user has performed. The check-ins was ordered by chronological order performed by the users. The Mean Displacement User is defined by Equation 5.1:
du = [distance(v1, v2) +...+distance(vn−1, vn)]/N , (5.1)
where V is the set of visited locations and N is the total number of check-ins. Figure 5.1 shows the cumulative distribution of mean user displacement of tourists and residents. Studying the distance traveled by tourists, we realize that tourists tend to travel a shorter distances, while the probability of residents travel long distances is higher. Although this behavior is different between tourists and residents when we examine each city it is possible to see some variations. In Rio de Janeiro, for example, tourists move more, while in London 80% of the tourists move short distances, up to 5
km.
(a)
0 5 10 15 20 25 0 0.1 0.2 0.3 0.4 0.5 0.6 0.7 0.8 0.9 1
Mean distance (Km)
P [x > X]
Rio New York Tokyo London
Tourists
0 5 10 15 20 25 30 35 0 0.1 0.2 0.3 0.4 0.5 0.6 0.7 0.8 0.9 1
Mean distance (Km)
P [x > X]
Rio New York Tokyo London
Residents
Figure 5.1. Distribution of Displacement of Tourists and Residents
Among the residents we have a higher average displacements, indicating greater distances traveled within the city. Many residents do not reside close to their jobs and usually have greater knowledge of the city they tend to explore it in different ways, including further and hidden places in the city. A possible cause for the smaller displacement among tourists is the concentration in some regions, that it may be resulted by limitation of time and knowledge of the city, making tourists travel less within the city.
5.1.2
Radius of Gyration
5.1. Displacement measures 35
gyration indicates the area where the user was concentrated according to the points where he/she visited. With this metric we can understand the differences between the area of concentration of tourists and residents in the four studied cities, important information for urban planning and the better understanding of the dynamic of cities under this perspective.
We can calculate the radius of Gyration using Equation 5.2.
rg =
s
1 N
X
i∈L
ni(ri−rcm)2, (5.2)
where N is the total number of check-ins, L is the set of visited sites, ni if the number of check-ins at a place i, ri represents the geographical coordinates, and rcm is the center of mass of the individual (average coordinates). For this analysis were considered users that performed at least 5 check-ins, disregarding users that used the application sporadically.
(a)
Tourists Residents
Figure 5.2. Distribution of Radius of Gyration of Tourists and Residents
Figure 5.2 shows a cumulative distribution function of radius of gyration for tourists and residents in the four cities analyzed. For the tourists of the cities studied we observe a smaller radius of gyration than among residents. This means that the area of concentration of tourists tend to be smaller than the area where the residents tend to concentrate. Among the cities there are some differences, which can be ex-plained by geographic features and available transportation infrastructure. Tokyo, for example, has a similar behavior between tourists and residents, while Rio de Janeiro has a difference in the area of concentration of tourists and residents more expressive difference.
36 Chapter 5. Understanding Tourist’s Mobility
go to more places but with a smaller displacement. The distance of the touristic sites and public transportation available may be a factor that influences the concentration of tourists in a location, as well as the workplace and place of residence may also influence the displacement of residents in cities.
Figure 5.3 shows the movement of users, including tourists and residents, for different values of radius of gyration in Tokyo. The position of the nodes in the graph is in line with the real geographic coordinates of each site. For residents and tourists the smallest radius gyration found was 0.1, but we can see a difference in movement between them. Although they have been moving within the same range, tourists went to different and more places. This intuitively makes sense because tourists tend to visit more places in the new environment where they are.
Studying the largest radius of gyration of tourists and residents, we have 7 differ-ent places visited by a residdiffer-ent against 15 visited by a tourist. Meanwhile, the radius of gyration was 14.3 km for the resident and 11.6 km for the tourist. This corroborates with the observation pointed out above, that tourists tend to visit more places, despite not moving longer distances on average compared to residents.
This metric is useful to understand how tourists move within cities and also help to improve recommendation systems for places to tourists. If a tourist have an explorer profile, who likes explorer distant places, we can suggest places in a larger area; following the same idea, if the tourist is more conservative regarding to the distances he usually travels in the city, the suggestion of places should stay in a smaller radius.
5.2
Centrality metrics on spatio-temporal urban
mobility graphs
Linked to spatial data, another important factor to understand users mobility is the time. The movement of users might change according to the day of the week and time. For this reason in this section we perform analysis considering the time dimension in the study of mobility of tourists and residents.
5.2.1
Spatio-temporal urban mobility graphs
5.2. Centrality metrics on spatio-temporal urban mobility graphs 37
at some point in time an user performed a check-in at a venue vj after performing a check-in in vi.
In our model, we use a 24-hour time interval starting at 5:00 a.m. (instead of 12:00 p.m.). Our goal was to capture nightlife activities using this strategy. The label of vertices follows a simple rule: the name of the location concatenated with the integer hour of the check-in. For instance, a check-in at Times Square at 10:00 a.m. would be “Times Square [10]”. When another user has performed the same trajectory, is incremented one to the weight of the edge. In other words, the weight w(i, j) of an edge is the total number of transitions that occurred from node vi to nodevj . Isolated vertices were removed from the graph, since there is no movement associated with that particular vertex.
Figure 5.4 depicts our graph model with locations and temporal attributes. It is possible to notice the movement between different locations from the directed edge (with continuous line). The dashed line represents a link between the same location and the temporal distance between consecutive check-ins at that location. The directed edge represents two consecutive check-ins performed by the same user and the weight of the edge the number of users that performed this same tuple of check-ins. For example, in the figure the edge that connects the vertices “Corcovado[10]” and “Maracanã[14]”, both in Rio de Janeiro, represents consecutive check-ins performed at Corcovado at 10:00 a.m. and then at Maracanã Stadium at 2:00 p.m. ten different times.
In a city, there may be thousands of different combination of movements between places, and some of them tend to be more popular than others. Our graph model enables to study the movement of users along the time, and it can also be used to find important places in the cities. The importance of these places can be seen from different perspectives, such as, for instance, popularity in terms of number of visits or best places to disseminate information in the city. For those perspectives there are centrality metric of complex networks that help us understand the importance of the places in the cities, and we discuss some of them next.
5.2.2
Popular venues in the city
38 Chapter 5. Understanding Tourist’s Mobility
where and when places are more important to users (tourists and also residents) in different cities.
In a city might be possible to find thousands of different combination of move-ments between places, and some of them tend to be more popular than others. Our graph model enables to study the movement of users along the time, and it can also be used to find important places in the cities. It is possible to find central nodes (that represent places) in the graph. To illustrate this idea, we evaluate the degree centrality measure to identify the most important locations in the cities according to this metric. In a graph G, the degree centrality of a vertex v is the number of incident edges on v normalized by dividing by the maximum degree in the graph. Vertices with a higher degree centrality have a higher number of connections to other vertices of the graph. In the urban mobility graphs of tourists and residents, the higher the degree of vertices, the greater their popularity in the graph.
Table 5.1 (left side) shows the top ten places with the highest degree centrality of the residents’ graph of New York City. Subcategories of places express the behavior of residents, such as neighborhoods, bus station and buildings. We can see that such places are typically visited by people who live in the city and choose places related to their daily activities.
Residents Tourists
Venue[time] Subcategory Venue[time] Subcategory
Times Square[16] Plaza John F. Kennedy
Interna-tional Airport (JFK)[8]
Airport
Times Square[17] Plaza Brooklyn Beer & Soda[19] Food & Drink
Shop
New York Times
Build-ing[16]
Office Wall Street[18] Street
New York State DMV[18] Government
Building
Times Square[22] Plaza
Herald Square[17] Plaza National September 11
Memorial & Museum[19]
Historic Site
Boi Noodles[16] Vietnamese
Restaurant
LaGuardia Airport
(LGA)[6]
Airport
Dunkin’ Donuts[16] Coffee Shop New-York Historical Society
Museum & Library[13]
Museum
Herald Square[18] Plaza Brooklyn Brewery[23] Brewery
Port Authority Bus Termi-nal[16]
Bus Station Charging Bull[18] Government
Building
Herald Square[21] Plaza Mike & Tony’s Pizza[19] Pizza Place
Table 5.1. Ranking of degree centrality of New York
![Figure 2.1. Illustration of a Participatory Sensor Network. This image was obtained from [Silva et al., 2014a]](https://thumb-eu.123doks.com/thumbv2/123dok_br/15583939.606853/29.892.257.664.161.333/figure-illustration-participatory-sensor-network-image-obtained-silva.webp)