Validation of the “Six Step Spot Test”
for gait among patients with
multiple sclerosis in Brazil
Karina Pavan1, Charles Peter Tilbery2, Sergio Lianza2,Bruna Eriko Matsuda Marangoni1
ABSTRACT
The clinical manifestations of multiple sclerosis (MS) are variable among patients, and the course of disease is not linear. Different symptoms are presented, with gradual accumulation of disability. These variations are difficult to quantify in clinical practice, and several studies have attempted to create instruments capable of measuring these disabilities. The Six Step Spot Test (SSST) was developed for quantitative evaluation of the lower limbs (LL) over time. Performance in this test reflects the complexity of sensory-motor function, including LL strength, spasticity, coordination and balance, going beyond vision and cognition. The aim of the present study was to validate the SSST in a population of MS patients in Brazil. This prospective study included 75 patients with MS, with EDSS 0 to 6.5 in the study group. Ninety-one healthy subjects were randomly selected for the control group. The results showed that the groups were similar, and that the SSST is a reliable and reproducible test. According to the statistical analysis on the data in this study, the SSST is a valid, reliable and reproducible tool for use in the Brazilian MS patient population.
Key words: gait, multiple sclerosis, disability evaluation, validation studies, reproducibility of results.
Validação do teste de marcha “Six Step Spot Test” em pacientes com esclerose múltipla no Brasil
RESUMO
As manifestações clínicas da esclerose múltipla (EM) são variáveis e o curso da doença não é linear, caracterizado por sintomas, acúmulo progressivo de incapacidades. Estas variações são difíceis de quantificar na prática clínica, motivo pelo qual surgiram diversos estudos para criação de instrumentos capazes de mensurar essas incapacidades. O Six Step Spot Test (SSST) foi desenvolvido para avaliar função dos membros inferiores (MMII) de forma quantitativa, mensurado no domínio tempo, avaliando a complexa função sensório-motora, como força em MMII, espasticidade, coordenação e equilíbrio, além da visão e cognição. Este estudo teve como objetivo validar o SSST para pacientes com EM no Brasil. Estudo prospectivo do qual participaram 75 pacientes com EM e EDSS de 0 a 6,5 no grupo de estudo e 91 indivíduos saudáveis no controle que foram selecionados aleatoriamente. Segundo os dados estatísticos deste estudo, o SSST é válido, confiável e reprodutível para pacientes com EM no Brasil.
Palavras-chave: marcha, esclerose múltipla, avaliação da deficiência, estudos de validação, reprodutibilidade dos testes.
Correspondence
Karina Pavan Av José Giorge 2031 06707-100 Cotia SP - Brasil E-mail: karpav@gmail.com
Received 24 June 2009
Received in final form 7 October 2009 Accepted 20 October 2009
Department of Neurology of the Santa Casa Sisters of Mercy Hospital of São Paulo, São Paulo SP, Brazil: 1Physical Therapist,
Santa Casa de Misericórdia de São Paulo, São Paulo SP, Brazil; 2Physician, Santa Casa de Misericórdia de São Paulo, São
Paulo SP, Brazil.
Multiple sclerosis (MS) is a disease that afects the central nervous system (CNS). MS can cause disability, with a consequent
sub-ject of several studies, since these are often related to dis-ease progression. Gait assessment in MS is problematic, since most instruments used are not speciic for MS, or have not been adapted to the Brazilian population. here-fore, the reliability of these tests is undermined. It is nec-essary to monitor the progress of patients and to seek sci-entiic evidence based on the various types of therapeu-tic interventions. hus, it is important to have gait assess-ment scales for MS1-3.
In order to obtain reliable measurement of disease progression, as well as a tool for assessment of treatment eicacy with scientiic credibility, it is necessary to con-sider certain psychometric properties using a valid and reliable method4.
Nieuwenhuis et al., in Denmark in 2006, developed a test for functional evaluation of the lower limbs that was speciic for MS patients. In order to be able to use this meth-od for Brazilian MS patients, the test must be validated5.
Method
he present prospective study was approved by the Ethics Research Committee of Irmandade Santa Casa de Misericórdia de São Paulo (ISCMSP), and was carried out under protocol number 380/07. he subjects were ran-domly selected among friends and relatives of patients attending the Neurology Clinic, Department of Rehabil-itation. he MS patient group was selected from the MS
Care and Treatment Center (Centro de Atendimento e
Tratamento da Esclerose Múltipla, CATEM).
One hundred and sixty-six participants in this study were divided into two groups, after signing the consent form: a study group (75) and a control group (91). On av-erage, the patients in the study group were aged 40.6 years (SD 11.1), while the individuals in the control group had an average age of 38 years (SD 13.3). he comparison of age between groups showed no statistically signiicant dif-ference (p=0.180).
Inclusion criteria for the study were:
– Control group: healthy subjects who were accom-panying CATEM patients or were employees of the
ISC-MSP. hey had no history of lower limb (LL) surgery, no alcohol consumption, no vertigo, no sensory abnormali-ties in the LL, no major visual deicit and no use of hyp-notic drugs, and they were all literate individuals.
– Study group: individuals with conirmed MS diag-nosis according to the McDonald criteria, without any re-striction on disease development, but with a grading be-tween zero and 6.5 in the Expanded Disability Status Scale (EDSS). hey had no history of LL surgery, no alcohol consumption, no vertigo and no visual impairment that prevented them from viewing the ield test. hey were not undergoing any relapse, they were not using any psycho-tropic drugs and they were all literate individuals.
he SSST, a test that quantitatively assesses LL func-tion measured over time, was conducted between July and September 2008, always in the morning, in a closed envi-ronment, without inluence from noise or visual stimu-lus. Non-slip paint was used to mark out the ield. he re-search subjects were instructed to wear comfortable shoes.
he test ield measured one by ive meters (width and length, respectively). In the middle of the width line (0.50 m), a circle of 20 cm diameter was placed in the proximal and distal areas of the line. On each lateral line, two cir-cles were placed at distances of one and three meters on the left. Another two circles were placed at two and four meters. Five wooden spheres with a diameter of 8 cm and a height of 4 cm, weighing 125 grams each were placed in the center of each circle, except in one of them, which was considered to be the starting point (Figure).
he subjects were instructed to walk on alternating sides and to push the sphere outside of the circle, alter-nating between the medial and lateral sides of the feet. he subjects were brought to the test as quickly as pos-sible, without running, and did the route four times. For the irst and third movements, moving the ball was done with the right lower limb (RLL), while for the second and fourth movements, it was done with the left lower limb (LLL). he test was timed and the result was the average of the four pathways. Before the test itself, the examiner showed the subjects how to perform the test, both
ly and in practice. he subjects practiced the SSST three times for proper assimilation and learning, and only af-ter ive minutes of rest did the subject really take the test. Two hours after performing it, a retest was carried out.
SSST qualitative values were compared using analy-sis of variance (ANOVA), Mann-Whitney test or Kruskal-Wallis test. he comparison of SSST between the test and the retest was conducted using the Wilcoxon test.
To assess the reliability of the instrument, the intrac-lass correlation coeicient (ICC) was calculated, with as-sessment of conidence intervals.
he signiicance level was considered to be 5% (0.05). The SPSS statistical package was used for evaluations (Statistical Package for Social Sciences), version 13.0.
Results
Comparison between groups
here were no diferences between the two groups re-garding race, education, marital status and dominance (p values equal to 0.220, 0.172, 0.921 and 0.171 respective-ly). When the groups were compared regarding gender, it was observed that there was a signiicant diference be-tween them (p=0.012). In order to verify whether this dif-ference could afect the reliability of the test, analysis of variance was used to compare the two groups in relation to gender, and for test and retest.
When gender was compared within each group, the inal average trend was similar for men and women.
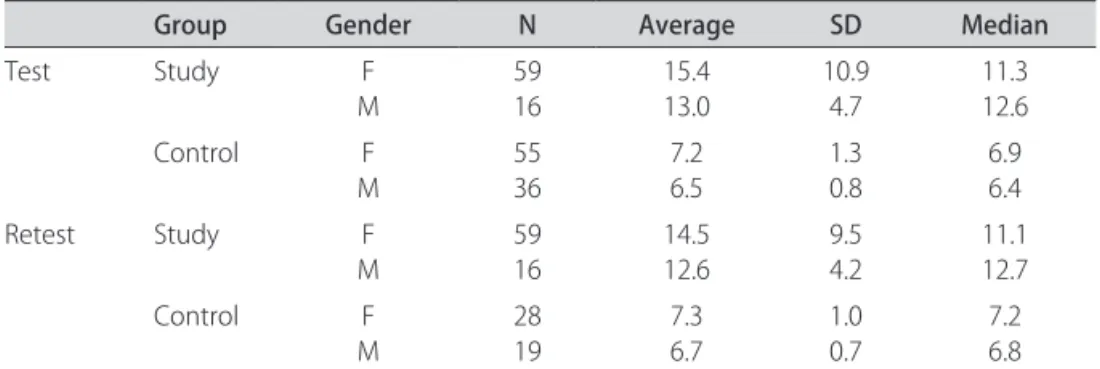
Comparison of average times in the test, controlled for gender and group, indicated that the diference be-tween the times was due only to the group (p<0.001), as conirmed by the analysis of variance. Gender did not in-terfere in test or retest time (Table 1).
Factors that may inluence the SSST
To study the factors that could inluence the time tak-en in the SSST, the Pearson correlation coeicitak-ent was calculated between the times for the test and retest and the delta of age and EDSS, in order to verify whether there was a diference in time for gender and education, as well as for EDSS. he study group was thus divided into two groups, according to the EDSS score. he irst group of individuals had EDSS varying from zero to 3 (48 subjects – 48%) and the second group had EDSS varying from 3.5 to 6.5 (27 subjects – 36%).
Table 2 shows the Pearson’s correlation coeicients for times and the delta for age, which were relatively low values. Since the times for the test and retest seemed to increase, the EDSS seemed to show the same tendency (0.619 and 0.635, respectively).
Table 3 shows a summary of the inal average mea-surements (test and retest), according to the group and schooling. he analysis of variance showed a signiicant diference (p<0.001) between the groups (study and con-trol). his diference was not observed when the school-ing variable was assessed in the test and retest, respec-tively (p=0.271, p=0.437).
Reliability test
To evaluate the reliability of the SSST, the test and re-test were applied in both groups. he results are present-ed in Tables 4 and 5.
Table 4 presents the summary of time measurements for SSST performance in the test and in the retest, ac-cording to the group. Although this table might suggest that the average and median times were very similar in each group, the values are signiicantly diferent in the
Table 1. Summary measurements of average final (test and retest) results in the groups, considering gender.
Group Gender N Average SD Median
Test Study F
M
59 16
15.4 13.0
10.9 4.7
11.3 12.6
Control F
M
55 36
7.2 6.5
1.3 0.8
6.9 6.4
Retest Study F
M
59 16
14.5 12.6
9.5 4.2
11.1 12.7
Control F
M
28 19
7.3 6.7
1.0 0.7
7.2 6.8
F: female; M: male; N: number of subjects; SD: standard deviation.
Table 2. Pearson’s correlation coeicients for time for the test and retest, and the delta for the two groups.
Variance 1 Variance 2 Study Control
SSST test Age
EDSS 0.270.62 0.43–
SSST retest Age
EDSS 0.240.64 0.38–
Delta Age
EDSS 0.240.27 0.18–
comparison between test and re-test (p<0.001 for the study group and p=0.021 for the control group).
According to the Pearson correlation between the times of testing and retesting, considering the lowest or the highest degree of EDSS, the value for EDSS 0 to 3 was 0.979, while for EDSS 3.5 to 6.5, the value was 0.960.
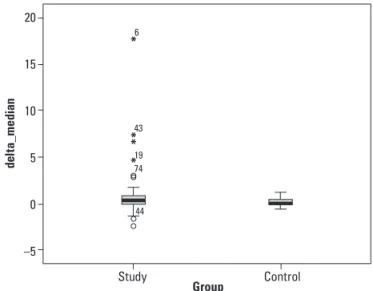
In order to understand the change of behavior for the test and retest, the diference between the two times was calculated and called “delta”. he closer to zero the value of delta was, the closer were the times between test and
re-test. Considering the mean and median values for the con-trol group, it seems that a lower delta is obtained in com-parison with the other group. his result was indepen-dent of the larger variability of the study group, as shown in the Graph. No statistically signiicant diference was observed when both groups were compared (p=0.063). he intraclass correlation coeicient (ICC) was calcu-lated in order to verify the reliability of the instrument.
Table 3. Summary measurements of average inal (test and retest) results in the groups, considering schooling.
Group Schooling N Average SD Median
Test Study Basic
High School Superior
6 35 34
11.4 13.5 17.0
2.3 6.5 13.0
11.1 11.0 11.5 Control Basic
High School Superior
16 35 40
7.7 7.0 6.6
1.7 1.0 0.8
7.1 6.8 6.3
Retest Study Basic
High School Superior
6 35 34
11.0 12.9 15.9
2.3 5.5 11.3
10.7 11.1 12.2 Control Basic
High School Superior
11 15 21
7.1 7.3 6.9
1.3 0.9 0.7
6.9 7.4 6.8
N: number of subjects; SD: standard deviation.
Table 4. Summary of SSST values according to EDSS categories for test and retest.
Variance
Study
P
N Average SD
EDSS 0.0 to 3.0 Test
Retest
48 48
10.5 10.2
2.5
2.4 <0.001* 3.5 to 6.5 Test
Retest 2727 22.821.1 13.011.0 0.019*
*Wilcoxon; SSST: Six Spot Step Test; EDSS: Expanded Disability Status Scale; N: number of subjects; SD: standard deviation.
Table 5. Summary measurements of time (in seconds) in SSST test and retest, for the study and control groups.
Summary measurements
Group
Study Control
Test retest Test retest
N 75 75 91 47
Average 14.91 14.12 7.22 7.04
Median 11.37 11.20 7.17 6.87
SD 9.94 8.64 1.00 0.94
Least 5.89 6.20 5.59 4.90
Maximum 63.59 64.10 10.18 9.70
p* <0.001 0.021
*Wilcoxon’s test ; N: number of subjects; SD: standard deviation.
20
15
10
5
0
–5
d
el
ta_med
ia
n
Study Control
Group
6
43
19 74
44
hese values could vary from zero to one, and the clos-er to one they wclos-ere, the greatclos-er the reliability of the in-strument was.
he value of 0.983 was obtained for the ICC of the MS patients group, with a 95% conidence interval (values ranging from 0.972 to 0.989). he ICC value for the con-trol group was 0.945 (95% CI range=0.902 to 0.970), thus demonstrating a high degree of reliability in both groups. he Pearson correlation coeicient between the times for the test and retest was calculated, and the value of 0.975 was obtained for the study group; while the value 0.898 was obtained for the control group. his result fur-ther strengthened the ICC results.
discussion
he relevance of MS studies focusing on gait lies in the characteristics of this progressive disease that afects young adults. After an evolution period of 10 years, 50% of these patients may be unit to perform their profession-al and personprofession-al activities, thus resulting in individuprofession-al and family sufering, associated with a great economic burden on society. hese patients may be lost to the workforce, at the same time that they generate a high cost with their prolonged course of treatment6-9.
With better-deined diagnostic criteria due to imag-ing advances, and with better understandimag-ing of the dis-ease, there have been increasing numbers of diagnoses. hus, a greater need for disability evaluations among MS patients has been created7,10-12.
Disability evaluation among MS patients has given rise to the challenge of constructing instruments that are able to translate this clinical parameter of MS13.
Although the EDSS is the most widely used scale for MS evaluation15, and is considered to be the gold
stan-dard, its application is limited only to doctors, since there is an evaluation of several functional systems. he authors agree with Nieuwenhuis et al., 20065 who said that this is
not a linear scale, and its psychometric properties are not reliable, since it is not entirely objective and incorporates some subjective variables. Parameters such as function-al bladder and bowel scores (self-reported by the patient) and the ability to walk (100 to 500 meters) may be unreli-able since the interview is carried out in an oice14.
Although the American Committee considers the Multiple Sclerosis Functional Composite Measure (MSFC) to be a standard test because it evaluates the mo-tor performance of the upper limbs (UL) and LL, along with cognition15,16, there are points that are not fully
cov-ered by this form of assessment, when gait is considcov-ered. A more complex test such as SSST may increase the sen-sitivity of this evaluation, but before it is fully used in Bra-zil, it needs to be validated.
he ability to walk is commonly used as a
measure-ment of the impact of disease among patients with MS17,18.
On average, two thirds of these patients retain the ability to walk for up to 20 years after the diagnoses. Due to oth-er associated disabilities such as weakness, spasticity, lack of coordination, fatigue and vestibular disorders, MS pa-tients may walk more slowly, for shorter distances. When they reach the disease phase that requires double support, there may also be a decreased range of motion in the an-kle, knee and hip1,19,20. Tests that can identify the inluence
of these factors could help detect changes in disease evo-lution, thereby allowing earlier interventions.
An ideal tool for use in clinical practice must be sensi-tive enough to assess what it proposes to evaluate. It also needs to be reproducible and easy to apply, understand and interpret, with low cost, taking into consideration the particular features of the population under evalua-tion. he authors believe that SSST has all of these char-acteristics for evaluating MS patients.
he time taken to walk is a common clinical measure-ment of mobility and function. Among patients with neu-rological disorders, the slower they move, the higher are the sensory-motor and cognitive dysfunctions3,20,21.
he SSST was the subject of this study because it is extremely important to have assessment tools that can be sensitive to the particular features of the disease being studied. his is exactly the case with this test, which takes into account the various changes that may be present in MS patients. he application of test and retest in order to verify its reliability showed that the time between them was diferent. However, despite being mathematically sig-niicant, both for average and median values, this difer-ence did not afect the clinical characteristics, since it was of the order of hundredths of a second (Table 5). Gait-re-lated spatial-temporal parameters in MS are highly vari-able between and among the days. However, there are no reports on the variability of gait parameters, which may explain this diference between test and retest2.
In general, the patients with MS had signiicantly difer-ent gait parameters, compared with healthy subjects. MS patients walked more slowly, as was conirmed by the SSST, showing that the study group had a median time of 11.37 seconds, while the control group had 7.17 seconds1,19,20.
In the original study using SSST, which was carried out in Denmark, the study group showed lower median values. Patients did the test in 10.7 seconds, while con-trols did it in 6.4 seconds, meaning that the population in Denmark performed the test a bit faster than the Brazil-ian subjects did. However, they can be considered to be similar. his diference may be due to the colder climate of Denmark, since heat decreases the nerve conduction, thereby slowing the movements.
In the study by Morris et al.1, gait and fatigue were
afternoon. hese authors found that there was little vari-ability in the gait pattern, despite the signiicant incre-ment in fatigue. Despite this result, the present study was carried out always in the morning, in order to avoid any inluence from another variable.
In analyzing our sample in order to verify the psycho-metric properties of the test, it was found that there was little diference between the test and the retest. In ana-lyzing this diference by calculating a delta value, it was observed that in the control group, this diference was closer to zero, meaning that the SSST time did not vary much. Although the control group showed similar test and retest results, the study group showed a higher dif-ference, due to greater variability relating to diferent lev-els of disabilities.
Temporal-spatial variability often occurs among in-dividuals with higher degree of disability measured by EDSS14. Individuals with EDSS scores of up to three may
walk without support or auxiliary devices for distances of more than 500 meters. his variability increases with the severity of MS, in parallel with an increase in the EDSS values. Individuals with EDSS over six need to use a cane, crutches or Zimmer frame to walk 100 meters5,18,20.
he median values of both groups were very close to zero, thus indicating that the SSST is reproducible for the two groups. herefore, in comparing the delta between the groups, there was no statistical diference. his was reinforced and assured by the ICC (0.983). his result in-dicates a high degree of reliability, with similar values to those obtained by Nieuwenhuis et al. in 20065, when they
developed the SSST (0.95).
Amato and Ponziane13 reported that individuals with
EDSS between 4 and 7.5 presented greater involvement of LL, relating to the maximum distance they could walk. In our study, it was found that individuals with EDSS between 3.5 and 6.5 needed longer times to perform the SSST due to these disabilities, thus indicating that the greater the disability was, the greater the time taken for the test.
In the sample assessed in this study, age did not have any strong correlation with time taken to do the SSST, although Nieuwenhuis et al.5 observed that the group of
patients between 20-39 years of age was the fastest, scor-ing 9.1 seconds. In their study, the group aged between 40-80 years performed the test in 13 seconds. hese val-ues are closer to the average age of our sample and, as re-ported in the literature, the higher the age is, the slower the gait is. he age-related speed reduction may be due to prolonged duration of double support use. he ind-ings of gait time reduction among individuals of difer-ent ages in the control group indicated an impairmdifer-ent of gait stability in these patients.
Regarding the variable of gender, men performed the test more quickly than women only in the control group.
he same result was reported by Tilbery et al.16 when
ex-amining 91 normal subjects for the Brazilian standardiza-tion of the Timed 25 Foot Walk (T25FW) for the MSFC. hat study investigated the relationship between the lev-el of education and time taken to complete the T25FW, and found that the higher the schooling was, the low-er the time taken for the test was. his was also the case in the present study regarding the control group, since it showed that individuals with higher schooling did the SSST in a shorter time (p=0.017). However, this did not occur in the study group, since their disability (measured by the EDSS) was the factor that inluenced test time.
he SSST is a reproducible, reliable and valid test for MS patients in Brazil. he authors agree with Nieuwen-huis et al.5 that this test is a good alternative for gait
as-sessment during rehabilitation. It is also worth remem-bering that this test is easy to apply, favored by easy un-derstanding, representation and low cost. his test can be applied by doctors and physiotherapists, thereby enabling its widespread use among MS patients in Brazil, for ob-serving the course of disease and managing pharmaco-logical or rehabilitation interventions.
he results from the present study have led the au-thors to propose a short study to be carried out soon, to modify the MSFC, since the LL motor item of the latter does not take into account the sensory-motor charac-teristics of the disease and the use of auxiliary resourc-es. herefore, the authors believe that this modiied test may be a replacement based on the SSST, perhaps allow-ing a more complete assessment of broader functional ca-pacity. his new, modiied instrument could increase the knowledge of MS in this ield.
According to the statistical results from the present study, the SSST is a valid, reliable and reproducible tool for Brazilian MS patients.
RefeRences
1. Morris ME, Cantwell C, Vowels L, Dodd K. Changes I gait and fatigue from morning to afternoon in people with multiple sclerosis. J Neurol Neurosurg Psychiatry 2002;72:361-365.
2. Albrecht H, Wötzel C, Erasmus LP, Kleinpeter M, König N, Pöllmann W. Day-to-day variability of maximum walking distance in MS patients can mislead to relevant changes in the Expanded Disability Status Scale (EDSS): average walking speed is a more constant parameter. Mult Scler 2001;7:105-109. 3. Savci S, Inal-Ince D, Arikan H, et al. Six-minute walk distance as measure of
functional exercise capacity in multiple sclerosis. Disabil and Rehabil 2005;27: 1365-1371.
4. Goulart F, Pereira LX. Uso de escalas para avaliação na doença de Parkinson em isioterapia. Fisioter Pesqu 2005;11:49-56.
5. Nieuwnhuis MM, Tongeren H Van, Sorensen PS, Ravnborg M. The Six Spot Test: a new measurement for walking ability in multple sclerosis. Mult Scler 2006;12:495-500.
6. Moreira MA, Felipe E, Mendes MF, Tilbery CP. Estudo descritivo de suas for-mas em 302 casos. Arq Neuropsiquiatr 2000;58:460-466.
disease-mod-ifying drugs utilized in the management of relapsing forms of multiple scle-rosis: a model evaluating the clinical and economic impact of current treat-ment options [abstract]. JMCP 2007;13:170.
9. Callegaro D, Goldbaum M, Moraes L, et al. The prevalence of multiple sclero-sis in the city of São Paulo, Brazil, 1997. Acta Neurol Scand 2001;104:208-213. 10. Luetic G. MS in Latin America. Int Mult Scler J 2008;15:6-11.
11. McDonald WI, Compston A, Edan G, et al. Recommended diagnostic crite-ria for multiple sclerosis: guidelines from the International Panel on the di-agnosis of multiple sclerosis. Ann Neurol 2001;50:121-127.
12. Polman CH, Reingold SC, Edan G, et al. Diagnostic criteria for multiple sclero-sis: 2005 Revisions to the “McDonald Criteria”. Ann Neurol 2005;58:840-846. 13. Amato MP, Ponziani G. Quantiication of impairment in MS: discussion of the
scales in use. Mult Scler 1999;5:216-219.
14. Fauchard-Renard C, Renard J-F, Miret N, Hannequin D, Mihout B, Weber J. Mesure de l’eicacité thérapeutique au cours d’une poussée de sclérose en plaques par l’analyse de la marche: comparasion avec le score EDSS. Rev Neurol 2001;157:649-654.
15. Hoogervorst ELJ, Zwemmer JNP, Jelles B, Polman CH, Uitdehaag BMJ.
Multi-ple Sclerosis Impact Scale (MSIS-29): relation to estabilished measures of im-pairment and disability. Mult Scler 2004;10:569-574.
16. Tilbery CP, Mendes MF, Thomaz RB, et al. Padronização da Multiple Sclerosis Functional Composite Measure (MSFC) na população brasileira. Arq Neurop-siquiatr 2005;63:127-132.
17. Martin CL, Phillips BA, Kilpatrick TJ, et al. Gait and balance impairment in ear-ly multiple sclerosis in the absence of clinical disability. Mult Scler 2006;12: 620-628.
18. Nilsagard Y, Lundholm C, Gunnarsson L-G, Denison E. Clinical relevance us-ing timed walk tests and “timed up and go” testus-ing in persons with multiple sclerosis. Physiother Res Int 2007;12:105-114.
19. Sheler LR, Hennessey MT, Knutson JS, Naples GG, Chae J. Functional efect of an ankle foot orthesis on gait in multiple sclerosis: a pilot study. Am J Phys Med Rehabil 2008;87:26-32.
20. Crenshaw SJ, Royer TD, Richards JG, Hudson DJ. Gait variability in people with multiple sclerosis. Mult Scler 2006;12:613-619.