Carla Antoni LuchiI Karen Glazer PeresI,II,III João Luiz BastosII Marco Aurélio PeresI,II,III
I Programa de Pós-Graduação de
Odontologia. Centro de Ciências da Saúde. Universidade Federal de Santa Catarina. Florianópolis, SC, Brasil
II Programa de Pós-Graduação em Saúde
Coletiva. Centro de Ciências da Saúde. Universidade Federal de Santa Catarina. Florianópolis, SC, Brasil
III Australian Research Centre for Population
Oral Health. School of Dentistry. University of Adelaide. Adelaide, Australia Correspondence:
Carla Antoni Luchi Rua Tilápias, 45 Campeche 88063-163 Florianópolis, SC, Brasil E-mail: [email protected] Received: 5/17/2012
Approved: 3/4/2013
Article available from: www.scielo.br/rsp
Inequalities in self-rated oral
health in adults
ABSTRACT
OBJECTIVE: To investigate the link between self-rated oral health and socio-demographic inequalities.
METHODS: Cross-sectional study, carried out with 2,016 adults between 20 and 59 years of age in 2009, in Florianopolis, SC, Southern Brazil. We adopted a two-stage sampling design (census tracts and households). Data were collected through face-to-face interviews, conducted in the participants’ households. The outcome was self-rated oral health. The exploratory variables were demographic characteristics, indicators of socioeconomic position, dental service utilization and adverse self-reported oral health conditions. Analysis was performed using multivariable poisson regression, which allowed the
estimation of prevalence ratios and 95% conidence intervals.
RESULTS: The prevalence of negative self-rated oral health was 33.2% (95%CI 29.8;36.6). In the adjusted analysis, being of an older age, self-classifying as light-skinned black, lower education, the most recent dental appointment being three years or more ago, attending public dental surgeries, having less than 10 natural teeth in at least one arch, self-reporting need for dental
treatment, reporting dry mouth, and dificulty eating due to tooth problems
were associated with negative self-rated oral health.
CONCLUSIONS: Self-rated oral health relects social inequalities in health, and it is associated with low socioeconomic status, less frequent use of dental services and poorer self-reported oral health conditions.
Oral health problems, such as tooth decay, periodontal disease and tooth loss are determined by demographic and socioeconomic factors and use of health care services.24 These health problems have a negative
impact on the daily life of the individual, as they create
functional dificulties, problems chewing and talking,
and problems with sociability, such as being unhappy
with appearance, dificulties being accepted socially
and limiting access to the job market.25
Oral health problems are measured using clinical indices. However, they tend not to measure the impact of oral health conditions on the individual’s daily life. A study with adults observed that aspects linked to oral health which were assessed using non-clinical parame-ters affected the daily life of 20.7% of participants, with 11.4% of respondents greatly affected. There have been
signiicant advances in the development of measures
that consider the impact of non-lethal health problems and subjective aspects associated with the concepts of health, well-being and satisfaction.
Using subjective measures to assess general and oral health is becoming increasingly important. Studies show that assessing oral health as one single item constitutes a summary measure of the individual’s oral health.9 This use means the individual’s and society’s
status of oral health can be diagnosed.7 Self-rated oral
health is linked to the general state of health and to functional capacity and contributes independently to long term well-being and satisfaction.12
Individuals who report more oral health symptoms, impairment and disabilities have worse self-reported oral health,9 whereas individuals who assess their
oral health as negative have worse clinical conditions compared with those who rate their oral health posi-tively.12 The prevalence of negatively self-rated oral
health was 40% higher in those who had periodontal disease in a study which assessed the link between periodontal disease and self-rated oral health.7 Using
self-rated oral health in population surveys, an easier measure than carrying out examinations, quickly
identiies the state of the population’s oral health and
associated factors,20 contributing to health care planning
according to the population’s needs.7
Obtaining information from adults on their oral health and its impact on their lives could contribute to reducing the social and physical consequences of oral health problems, with the goal of preventing tooth loss and improving health and quality of life in this age group.
This will be relected in the population’s future health,
considering the increase in life expectancy.23
INTRODUCTION
In research conducted in December 2011 using the Medline-PubMed database, the search terms (“Oral health”[mesh] AND (“self-concept”[mesh] OR “self-assessment”[mesh]), were found in 391 studies carried out with a variety of populations and age groups. Only one Brazilian epidemiological population based study was found using self-rated oral health as the objective of the investigation in adults.16 This study
aims to analyze the link between self-rated oral health in adults and socio-demographic inequalities.
METHODS
This study is part of the population based, base line cohort study EpiFloripa – Epidemiologic Study of the Health of the Adult Population of Florianópolis, SC, Southern Brazil, which took place between September 2009 and January 2010. Florianópolis, the state capital of Santa Catarina, has a population of 404,224 and a Human Development Index of 0.875,a placing it fourth
among Brazilian municipalities. The population studied was made up of adults aged between 20 and 59 at the time of the study, of both sexes, living in the commu-nity and resident in the urban area of the municipality.
The sample size was calculated using the formula to calculate prevalence for simple causal samples, adding the estimated relative value of design effect (due to it being cluster sampling) in two. As a variety of health outcomes were investigated, an outcome prevalence of 50%, error of four percentage points and 95%
conidence level were used, giving a sample of 1,198 individuals. The inal sample size was 2,016 individ -uals, with an added 10% to cover refusals and 20% to control for confounding factors in the multivariate analysis. This sample was deemed adequate to test the link between negative self-rated oral health and the factors in question in this study, with a power of 80%
(error type II, β = 20%) and error type I equal to 5% in
order to estimate the prevalence ratio of 1.3, considering the prevalence of negatively rated oral health among those not exposed to be equal to 24%.
Sampling was conducted in two stages. The irst sample
units were the 420 urban census tracts which make
up the municipality. The census tracts were stratiied
in ascending order of the head of the household’s income, 60 tracts were systematically selected with a sampling share equal to seven, giving six tracts for each income decile. The second sample units were the residences. The number of residences varied from 61 to 754 between the tracts. The tracts were reorganized by merging and splitting these units to reduce the
coef-icient of variation. The initial coefcoef-icient of variation
was 55% (n = 60 tracts) and the inal one was 32% (n = 63 sectors). These 16,755 residences made up the
63 sectors of the sample. The residences were selected with a sample share equal to eight, giving a total of 2,094 selected. Thus, a sample size of 2,016 adults, or 32 adults per census tract, was obtained.
Data were collected by 35 interviewers. The face-to-face interviews took place individually in the residences. The interviewers were trained and a pre-test of the question-naire was accomplished with 30 adults in the same age group as the population studied. A pilot study, in which each interviewer conducted at least three interviews,
was carried out. Approximately 15% (n = 248) of the
interviews were selected for quality control and the interviews were repeated using a questionnaire with a smaller number of questions. The reproducibility of the questionnaire was deemed to be satisfactory, with kappa
and coeficient of correlation values between 0.6 and 0.9.
The dependent variable was self-rated oral health, obtained by asking “Concerning your teeth, are you:
very happy, satisied, neither satisied nor dissatisied, dissatisied or very dissatisied”. The variable was dichotomized into positive (very happy, satisied) and negative (neither satisied nor dissatisied, dissatisied or very dissatisied) self-rated oral health. This form of
categorization has been used in various national14,16,20
and international studies.8
The independent variables were divided into blocks.
The irst was made up of the demographic variables:
sex, age in full years (in groups of ten years, from 20 to 59 years old), self-reported skin color (white, dark, black, yellow and indigenous).
The second block was made up of socioeconomic and education variables: per capita income in terciles (total income, in reais, of all household members in the month preceding the interview, divided by the number of household members; 3rd tercile ≥ R$ 1,314.00, 2nd tercile between R$ 561.00 and R$ 1,300.00, 1st tercile ≤ R$ 560.00) and schooling in full years studied (≥ 12, nine to 11, ive to eight and ≤ 4 years).
The third block contained variables concerning use of health care services: length of time since last dentist
appointment (< 1 year, one to two years and ≥ 3 years)
and type of appointment (private, public or other).
The last block constituted variables concerning self-re-ported oral health conditions: number of natural teeth (ten or more, fewer than ten or none in both dental arches).
The other variables concerning oral health conditions
were: a combination of responses in categories of ≥ 10
teeth in both dental arches, < 10 in at least one arch and no teeth. Perceived need for dental treatment (yes; no), use of complete denture (yes; no), dry mouth (never,
sometimes, often, always and unknown, categorized as never or occasionally – sometimes, often and always),
dificulty eating due to teeth (never, rarely, sometimes,
often, always and unknown, categorized as never or occasionally – sometimes, often, always) and toothache in the last six months (yes; no).
Sample weighting and design effect were considered in all of the analyses, using the svy command. Bivariate analysis, when appropriate, was carried out using the Rao Scott test.21 Variables which showed a statistical link
(p < 0.20 with the outcome were then subject to Poisson multivariate regression analysis, and prevalence ratios
(PR) and 95% conidence intervals were estimated.3
The variables were inputted for the multivariate anal-ysis, according to a hypothetical theoretical model for determining the self-assessment of oral health.26 The
model used (Figure) considers that the way in which an
individual evaluates their oral health is inluenced by
demographic and socioeconomic factors, by use of dental health care services and their oral health conditions.
The demographic conditions (ski color, sex and age) occupy a distal position in determining oral health
prob-lems, inluencing socioeconomic conditions (income
and schooling).2 Males and females, indigenous
popu-lations, blacks and whites occupy distinct positions in social hierarchies and also bring with them different
Age Self-reported skin color
Sex
Per capita income Schooling
Last visit to dentist Type of service for last visit
Self-rated oral health Number of teeth Need for dental treatment Use of complete dentures
Dry mouth Toothache Difficulty eating
experiences of being born, living, falling ill and dying.13
Skin color and sex can lead to discrimination and job and wage segregation, causing income disparities and affecting the population’s socioeconomic conditions.13
Income affects eating and living patterns, access to knowledge and health care, which have a direct effect on exposure to risk factors for various diseases, including oral health problems.5 Poor socioeconomic status and precarious living conditions make it dificult to prioritize oral health and lead to dificulties accessing orthodontic
services, with the consequence of poor quality dental care and tooth loss.17 The connection between the social
struc-ture and oral health could be due to material, behavioral and psychosocial bias.4 Although, in health outcomes,
causal relationships are not immediate, schooling plays an important role in understanding inequalities in the population’s levels of health,5 schooling is one of the
main barriers affecting the use of dental services.15
Using dental health care services inluences the popu -lation’s state of health, as the risk of disease is reduced through care and prevention. Using these services reduces unfavorable health conditions, by controlling and treating oral health problems, and access to health
care services is strongly inluenced by social conditions,
income and schooling.17 Oral health problems such
as tooth decay, periodontal disease and tooth loss are determined by demographic and socioeconomic factors and using dental health care services24 which, in turn,
negatively affect self-rated oral health.7,12
The data were analyzed using the Stata 9.0 program (Stata Corp, College Station, TX, USA).
The project was submitted to and approved by the Human Research Ethics Committee of the Universidade Federal de Santa Catarina (Process nº 351/08, on 15th December
2008). Participants signed an informed consent form.
RESULTS
Among the 1,720 interviewees (response rate of 85.3%), 33.2% rated their oral health negatively. This
condition was signiicantly more prevalent in those with
lower levels of income and schooling. Having fewer than ten teeth in at least one dental arch and perceived need for dental treatment were strongly associated with negatively self-rated oral health.
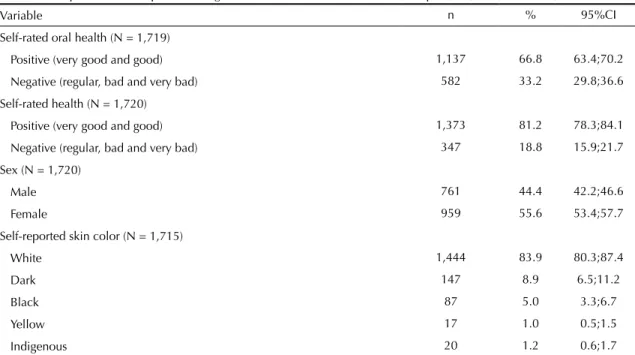
The interviewees were predominantly female (55.6%), with self-reported skin color white (83.9%), aged between 20 and 29 years old, in the upper income tercile
≥ R$ 1,314.00 and 12 or more years of schooling.
Most individuals had seen a dentist within the last year (76.3% privately); 82.0% of individuals had ten or more teeth in both dental arches and a little over half report needing dental treatment. A small proportion of the
sample used dentures, had dificulty eating and had had
toothache in the last six months (Table 1).
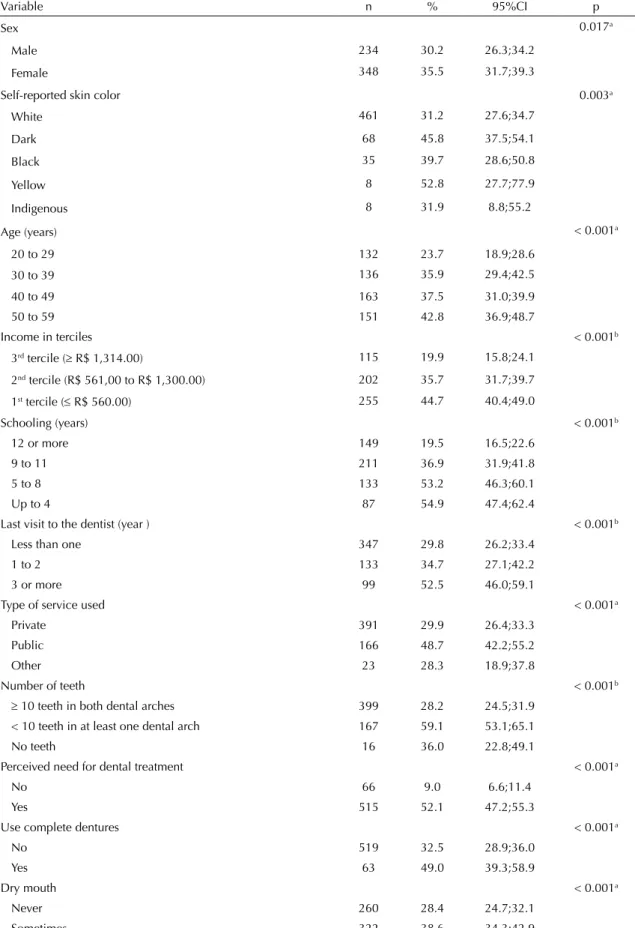
Negatively self-rated oral health was signiicantly
higher in those with lower incomes, lower schooling, who had not seen a dentist for three or more years, and used a public dental service.
Most interviewees perceived the need for dental treat-ment; and almost half of these reported toothache within
Table 1. Description of the sample according to the characteristics evaluated. Florianópolis, SC, Southern Brazil, 2009 to 2010.
Variable n % 95%CI
Self-rated oral health (N = 1,719)
Positive (very good and good) 1,137 66.8 63.4;70.2
Negative (regular, bad and very bad) 582 33.2 29.8;36.6
Self-rated health (N = 1,720)
Positive (very good and good) 1,373 81.2 78.3;84.1
Negative (regular, bad and very bad) 347 18.8 15.9;21.7
Sex (N = 1,720)
Male 761 44.4 42.2;46.6
Female 959 55.6 53.4;57.7
Self-reported skin color (N = 1,715)
White 1,444 83.9 80.3;87.4
Dark 147 8.9 6.5;11.2
Black 87 5.0 3.3;6.7
Yellow 17 1.0 0.5;1.5
Indigenous 20 1.2 0.6;1.7
the last six months. Those who reported having a dry
mouth and dificulty eating showed a higher prevalence
of negative self-rated oral health (Table 2).
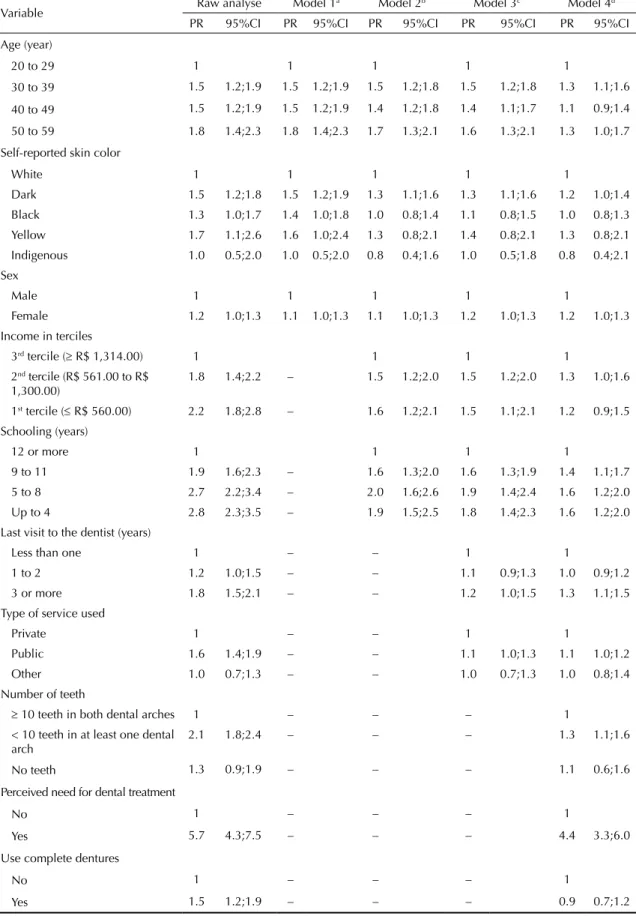
Being female (PR = 1.2; 95%CI 1.0;1.3), being aged between 30 and 39 (PR = 1.3, 95%CI 1.1;1.6) and
50 and 59 (PR = 1.3, 95%CI 1.0;1.7), having self-re
-ported dark skin (PR = 1.2, 95%CI 1.0;1.4),having up to four years schooling (PR = 1.6, 95%CI 1.2;2.0), between ive and eight years of schooling (PR = 1.6,
95%CI 1.2;2.0) and from nine to 11 years of schooling
(PR = 1.4, 95%CI 1.1;1.7) remained linked to negatively
Continuation
Age (years) (N = 1,720)
20 to 29 540 32.7 28.2;37.17
30 to 39 392 22.9 20.3;25.5
40 to 49 438 25.0 21.8;28.1
50 to 59 350 19.4 16.9;21.9
Income in terciles (N = 1,685)
3rd tercile (≥ R$ 1,314.00) 559 34.1 27.8;40.4 2nd tercile (R$ 561,00 to R$ 1,300.00) 562 33.3 29.6;36.9
1st tercile (≤ R$ 560.00) 564 32.6 26.1;39.0
Schooling (years) (N = 1,716)
12 or more 737 43.8 37.0;50.8
9 to 11 568 33.4 28.1;38.0
5 to 8 253 14.0 11.2;16.7
Up to 4 158 8.8 6.4;11.1
Last visit to the dentist (years) (N = 1,705)
Less than one 1,136 66.9 63.0;70.7
1 to 2 381 22.4 19.1;25.7
3 or more 188 10.7 8.6;12.8
Type of service used (N = 1,707)
Private 1,293 76.3 72.4;80.3
Public 331 19.0 14.9;23.0
Other 83 4.7 3.1;6.3
Number of teeth (N = 1,717)
≥ 10 teeth in both dental arches 1,394 82.0 79.1;84.9 < 10 teeth in at least one dental arch 279 15.6 12.9;18.2
No teeth 44 2.4 1.6;3.3
Perceived need for dental treatment (N = 1,715)
No 726 42. 7 38.9;46.4
Yes 989 57.3 53.5;61.0
Use complete dentures (N = 1,698)
No 1,575 92.9 91.1;94.7
Yes 123 7.1 5.2;8.9
Dry mouth (N = 1,716)
Never 888 52.5 47.8;57.1
Sometimes 676 47.5 42.8;52.2
Difficulty eating (N = 1,712)
Never or rarely 1,573 92.1 90.1;93.8
Sometimes 139 7.9 6.1;9.6
Toothache (N = 1,674)
No 1,422 85.2 83.2;86.7
Table 2. Prevalence of negative self-rated oral health, according to demographic, socioeconomic and behavioral variables and self-rated oral health in adults aged 20 to 59. Florianópolis, SC, Southern Brazil, 2009 to 2010.
Variable n % 95%CI p
Sex 0.017a
Male 234 30.2 26.3;34.2
Female 348 35.5 31.7;39.3
Self-reported skin color 0.003a
White 461 31.2 27.6;34.7
Dark 68 45.8 37.5;54.1
Black 35 39.7 28.6;50.8
Yellow 8 52.8 27.7;77.9
Indigenous 8 31.9 8.8;55.2
Age (years) < 0.001a
20 to 29 132 23.7 18.9;28.6
30 to 39 136 35.9 29.4;42.5
40 to 49 163 37.5 31.0;39.9
50 to 59 151 42.8 36.9;48.7
Income in terciles < 0.001b
3rd tercile (≥ R$ 1,314.00) 115 19.9 15.8;24.1
2nd tercile (R$ 561,00 to R$ 1,300.00) 202 35.7 31.7;39.7
1st tercile (≤ R$ 560.00) 255 44.7 40.4;49.0
Schooling (years) < 0.001b
12 or more 149 19.5 16.5;22.6
9 to 11 211 36.9 31.9;41.8
5 to 8 133 53.2 46.3;60.1
Up to 4 87 54.9 47.4;62.4
Last visit to the dentist (year ) < 0.001b
Less than one 347 29.8 26.2;33.4
1 to 2 133 34.7 27.1;42.2
3 or more 99 52.5 46.0;59.1
Type of service used < 0.001a
Private 391 29.9 26.4;33.3
Public 166 48.7 42.2;55.2
Other 23 28.3 18.9;37.8
Number of teeth < 0.001b
≥ 10 teeth in both dental arches 399 28.2 24.5;31.9 < 10 teeth in at least one dental arch 167 59.1 53.1;65.1
No teeth 16 36.0 22.8;49.1
Perceived need for dental treatment < 0.001a
No 66 9.0 6.6;11.4
Yes 515 52.1 47.2;55.3
Use complete dentures < 0.001a
No 519 32.5 28.9;36.0
Yes 63 49.0 39.3;58.9
Dry mouth < 0.001a
Never 260 28.4 24.7;32.1
Sometimes 322 38.6 34.3;42.9
self-rated oral health in the adjusted analysis. Not having
seen a dentist for three or more year (PR = 1.3, 95%CI
1.1;1.5), using a public dental service for the most
recent dental appointment (PR = 1.1, 95%CI 1.0;1.2)
and having fewer than ten teeth in at least one dental
arch (PR = 1.3, 95%CI 1.1;1.6) remained associated
with poor self-rated oral health. Reporting the need for
dental treatment (PR = 4.4, 95%CI 3.3;6.0), having a dry mouth (PR = 1.2, 95%CI 1.1;1.5) and dificulty eating (PR = 1.3, 95%CI 1.2;1.5) remained associated with
negative self-rated oral health after adjustment (Table 3).
DISCUSSION
A third of those questioned reported their self-rated oral health to be negative. Those who were older, dark skinned and had fewer years of schooling, who had gone a longer time without visiting the dentist, with teeth, perceiving themselves as needing dental treatment, those who reported experiencing dry mouth
and dificulty chewing were associated with negative
self-rated oral health in the adjusted analysis.
The study had a higher response rate than other studies on the subject with similar methodology.7 The response rate
was similar for all income groups. Demographic charac-teristics; income and schooling were similar throughout the population of the municipality, suggesting that there was no selection bias. Possible confounding factors were able to be controlled using multivariate analysis, contributing to pinpointing the effects of different factors on self-rated oral health in the adult population.
Studies with a similar methodology indicate rates of prevalence of negative self-rated oral health of between 44.6%19 and 53.3%,18 higher than those in
this study (33.3%). This may occur because the sample was composed of a population with higher income and levels of schooling. A limitation of the study is that self-rated measures vary according to cultural aspects and individual expectations, and thus do not totally correspond with clinical assessments of the conditions investigated.
Problems related to oral health, such as difficulty chewing, talking or pain are more commonly reported by women,11 with a prevalence of negatively self-rating
their oral health 20.0% higher than among men. However, there is no consensus in the literature regarding this result and studies have reported no difference between the sexes.14,22
Older individuals have a positive perception of their oral health conditions.14,21,23 However, in this study, they
showed a higher prevalence of negatively self-rating their oral health, indicating greater perception of oral health problems compared to younger individuals.
Research carried out in the United States show that whites report their oral health more positively than non-whites8 and than blacks.6 The stress experienced
daily by blacks and dissatisfaction with their situations lead to changes in the quality of life, as well as increasing vulnerability to disease.13 Those who reported themselves
to be dark skinned had a prevalence rate of negatively self-rating their oral health 20.0% higher than white indi-viduals, irrespective of gender. This association remained after adjusting for socioeconomic variables (income and schooling) and other possible factors linking skin color and perceived oral health.
Individuals who report more oral health symptoms, impairment and disabilities assess their oral health more negatively.12 Experiencing dry mouth and dificulty eating were linked to higher prevalence of negative self-rated oral health. Both dificulty eating11 and experiencing dry mouth may relect oral health
problems. Unfavorable clinical oral health conditions, like tooth decay17 and periodontal disease,7 are
asso-ciated with negatively self-rated oral health. Having fewer teeth increased the prevalence of negative self-rated oral health by 30.0%; reporting the need for dental treatment was strongly linked to a
nega-tive perception of oral health, relecting the neganega-tive
impact perceived by those who suffer from tooth loss and dental problems.
The percentage of negative self-rated oral health among individuals with levels of income and schooling
relects the link between oral health and social inequal -ities. Economically disadvantaged adults tend to perceive greater negative impact of problems with their teeth, mouth or dentures, report greater tooth loss and assess oral health less favorably than adults in better Continuation
Difficulty eating < 0.001
Never or rarely 476 29.6 26.5;32.8
Sometimes 103 73.8 66.3;81.3
Toothache (N = 1,674) < 0.001
No 447 30.7 27.1;34.3
Yes 119 47.2 39.2;55.1
a Rao Scot test21
Table 3. Association between negative self-rated oral health according to socioeconomic and demographic variables, use of service self-reported oral health conditions. Poisson raw and multivariate analysis. Florianópolis, SC, Southern Brazil, 2009 to 2010.
Variable Raw analyse Model 1
a Model 2b Model 3c Model 4d
PR 95%CI PR 95%CI PR 95%CI PR 95%CI PR 95%CI
Age (year)
20 to 29 1 1 1 1 1
30 to 39 1.5 1.2;1.9 1.5 1.2;1.9 1.5 1.2;1.8 1.5 1.2;1.8 1.3 1.1;1.6
40 to 49 1.5 1.2;1.9 1.5 1.2;1.9 1.4 1.2;1.8 1.4 1.1;1.7 1.1 0.9;1.4
50 to 59 1.8 1.4;2.3 1.8 1.4;2.3 1.7 1.3;2.1 1.6 1.3;2.1 1.3 1.0;1.7
Self-reported skin color
White 1 1 1 1 1
Dark 1.5 1.2;1.8 1.5 1.2;1.9 1.3 1.1;1.6 1.3 1.1;1.6 1.2 1.0;1.4 Black 1.3 1.0;1.7 1.4 1.0;1.8 1.0 0.8;1.4 1.1 0.8;1.5 1.0 0.8;1.3 Yellow 1.7 1.1;2.6 1.6 1.0;2.4 1.3 0.8;2.1 1.4 0.8;2.1 1.3 0.8;2.1
Indigenous 1.0 0.5;2.0 1.0 0.5;2.0 0.8 0.4;1.6 1.0 0.5;1.8 0.8 0.4;2.1 Sex
Male 1 1 1 1 1
Female 1.2 1.0;1.3 1.1 1.0;1.3 1.1 1.0;1.3 1.2 1.0;1.3 1.2 1.0;1.3
Income in terciles
3rd tercile (≥ R$ 1,314.00) 1 1 1 1
2nd tercile (R$ 561.00 to R$
1,300.00)
1.8 1.4;2.2 – 1.5 1.2;2.0 1.5 1.2;2.0 1.3 1.0;1.6
1st tercile (≤ R$ 560.00) 2.2 1.8;2.8 – 1.6 1.2;2.1 1.5 1.1;2.1 1.2 0.9;1.5
Schooling (years)
12 or more 1 1 1 1
9 to 11 1.9 1.6;2.3 – 1.6 1.3;2.0 1.6 1.3;1.9 1.4 1.1;1.7
5 to 8 2.7 2.2;3.4 – 2.0 1.6;2.6 1.9 1.4;2.4 1.6 1.2;2.0 Up to 4 2.8 2.3;3.5 – 1.9 1.5;2.5 1.8 1.4;2.3 1.6 1.2;2.0 Last visit to the dentist (years)
Less than one 1 – – 1 1
1 to 2 1.2 1.0;1.5 – – 1.1 0.9;1.3 1.0 0.9;1.2
3 or more 1.8 1.5;2.1 – – 1.2 1.0;1.5 1.3 1.1;1.5 Type of service used
Private 1 – – 1 1
Public 1.6 1.4;1.9 – – 1.1 1.0;1.3 1.1 1.0;1.2
Other 1.0 0.7;1.3 – – 1.0 0.7;1.3 1.0 0.8;1.4
Number of teeth
≥ 10 teeth in both dental arches 1 – – – 1
< 10 teeth in at least one dental arch
2.1 1.8;2.4 – – – 1.3 1.1;1.6
No teeth 1.3 0.9;1.9 – – – 1.1 0.6;1.6
Perceived need for dental treatment
No 1 – – – 1
Yes 5.7 4.3;7.5 – – – 4.4 3.3;6.0
Use complete dentures
No 1 – – – 1
Yes 1.5 1.2;1.9 – – – 0.9 0.7;1.2
economic conditions.11 Likewise, a higher level of
education is associated with better health, suggesting a direct relationship between years of schooling and good self-rated oral health.12
The use of dental services, and the frequency of their use affects oral health conditions. Individuals who had visited the dentist within the last year or once every two years perceived their oral health more positively compared with those who had not seen a dentist in a longer time. Not visiting the dentist for routine check-ups1 or waiting more than three years between
visits increases the prevalence of negative self-rated oral health,14 as oral health problems may progress
without professional care, causing pain, discomfort and irreversible damage to teeth.1 Using a public dental
service for the most recent appointment increased the prevalence of negative self-rated oral health by 10.0%, even after adjusting for socioeconomic and demo-graphic variables. The public dental services’ greater burden of oral health problems and limited ability to
resolve them may partially explain these indings.
By identifying factors associated with self-rated oral health, those groups whose oral health care should be
prioritized can be identiied and, consequently, public
resources can be better allocated. Distal (age, skin color, schooling, frequency of visiting the dentist and
type of service used) and proximal factors (number of teeth in the dental arches, reported need for dental treatment, experiencing dry mouth and difficulty eating) were linked to negative self-rated oral health.
Negative self-rated oral health relects inequalities
in the population’s oral health and is linked to worse socioeconomic conditions, lower use of health care services and worse oral health conditions. More studies using self-rated oral health are needed so that it becomes better understood and so it can be more widely used in assessing health.
ACKNOWLEDGEMENTS
Thanks to the technicians at the Instituto Brasileiro de Geografia e Estatística (IBGE) for supporting and training the interviewers with regards improving the approach to the participants in households; to Professor Nilza Nunes da Silva, of the Department of Epidemiology, Faculdade de Saúde Pública, Universidade de São Paulo, for her contributions to the sampling procedure; to the Secretaria Municipal de Saúde, Florianópolis, for the help in carrying out the research; and to the students on the Post-Graduate Programs in Public Health, Physical Education and Nutrition, of the Universidade Federal de Santa Catarina, for their contribution to supervising the study. Continuation
Dry mouth
Never 1 – – – 1
Sometimes 1.4 1.2;1.6 – – – 1.2 1.1;1.5
Difficulty eating
Never or rarely 1 – – – 1
Sometimes 2.5 2.1;2.9 – – – 1.3 1.2;1.5
Toothache
No 1 1
Yes 1.5 1.2;1.9 1.1 0.9;1.3
a Adjusted for demographic variables (sex, skin color and age) b Adjusted for socioeconomic variables (income and schooling)
c Adjusted for variables of dental service use (last visit and type of service used)
d Adjusted for variables of self-reported oral health (number of teeth, need for dental treatment, use of complete denture, dry
mouth and difficulty eating)
1. Afonso-Souza G, Nadanovsky P, Chor D, Faerstein E, Werneck GL, Lopes CS. Association between routine visits for dental checkup and self-perceived oral health in an adult population in Rio de Janeiro: the Pró-saúde study. Community Dent Oral Epidemiol. 2007;35(5):393-400. DOI:10.1111/j.1600-0528.2006.00343.x
2. Barbato PR, Nagano HCM, Zanchet FN, Boing AF, Peres MA. Perdas dentárias e fatores sociais,
demográficos e de serviços associados em adultos brasileiros: uma análise dos dados do Estudo Epidemiológico Nacional (Projeto SB Brasil 2002-2003). Cad Saude Publica. 2007;23(8):1803-14. DOI:10.1590/S0102-311X2007000800007 3. Barros AJ, Hirakata VN. Alternatives for logistic
regression in cross-sectional studies: an empirical comparison of models that directly estimate the prevalence ratio. BMC Med Res Methodol. 2003;3:21. DOI:10.1186/1471-2288-3-21
4. Bastos JLD, Gigante DP, Peres KG, Nedel FB. Determinação social da odontalgia em estudos epidemiológicos: revisão teórica e proposta de um modelo conceitual. Cienc Saude Coletiva. 2007;12(6):1611-21. DOI:10.1590/S1413-81232007000600022
5. Boing AF, Peres MA, Kovaleski DF, Zange SE, Antunes JL. Estratificação sócio-econômica em estudos epidemiológicos de cárie dentária e doenças periodontais: características da produção na década de 90. Cad Saude Publica. 2005;21(3):673-8. DOI:10.1590/S0102-311X2005000300002
6. Borrell LN, Taylor GW, Borgnakke WS, Woolfolk MW, Nyquist LV. Perception of general and oral health in White and African American adults: assessing the effect of neighborhood socioeconomic conditions. Community Dent Oral Epidemiol. 2004;32(5):363-73. DOI:10.1111/j.1600-0528.2004.00177.x
7. Cascaes AM, Peres KG, Peres MA. Periodontal disease is associated with poor self-rated oral health among Brazilian adults. J Clin Periodontol. 2009;36(1):25-33. DOI:10.1111/j.1600-051X.2008.01337.x
8. Coulter I, Yamamoto JM, Marcus M, Freed J, Der-Martirosian C, Guzman-Becerra N, et al. Self-reported oral health of enrollees in capitated and fee-for-service dental benefit plans. J Am Dent Assoc. 2004;135(11):1606-15.
9. Kieffer JM, Hoogstraten J. Linking oral health, general health, and quality of life. Eur J Oral Sci. 2008;116(5):445-50. DOI:10.1111/j.1600-0722.2008.00564.x
10. Lacerda JT, Castilho EA, Calvo MCM, Freitas SFT. Saúde bucal e o desempenho diário de adultos em Chapecó, Santa Catarina, Brasil. Cad Saude Publica. 2008;24(8):1846-58. DOI:10.1590/S0102-311X2008000800013
11. Locker D, Clarke M. Payne B. Self-perceived oral health status, psychological well-being, and life satisfaction in an older adult population. J Dent Res. 2000;79(4):970-5. DOI:10.1177/00220345000790041301
12. Locker D, Mscn EW, Jokovic A. What Do Older Adults’ Global Self-ratings of Oral Health Measure? J Public Health Dent. 2005;65(3):146-52.
DOI:10.1111/j.1752-7325.2005.tb02804.x
13. Lopes F. Beyond the numbers barrier: racial inequalities and health. Cad Saude Publica. 2005;21(5):1595-601. DOI:10.1590/S0102-311X2005000500034
14. Martins AMEBL, Barreto SM, Pordeus IA. Objective and subjective factors related to self-rated oral health among the elderly. Cad Saude Publica. 2009;25(2):421-35. DOI:10.1590/S0102-311X2009000200021
15. Matos DL, Lima-Costa MF, Guerra HL, Marcenes W. Projeto Bambuí: estudo de base
populacional dos fatores associados com o uso regular de serviços odontológicos em adultos. Cad Saude Publica. 2001;17(3):661-8. DOI:10.1590/S0102-311X2001000300020
16. Matos DL, Lima-Costa MF. Auto-avaliação da saúde bucal entre adultos e idosos residentes na Região Sudeste: resultados do Projeto SB-Brasil, 2003. Cad Saude Publica. 2006;22(8):1699-707. DOI:10.1590/S0102-311X2006000800018
17. Moreira TP, Nations MK, Alves MSCF. Dentes da desigualdade: marcas bucais da experiência vivida na pobreza pela comunidade do Dendê, Fortaleza, Ceará, Brasil. Cad Saude Publica. 2007;23(6):1383-92. DOI:10.1590/S0102-311X2007000600013
18. Nunes CIP, Abegg C. Factors associated with oral health perception in older Brazilians. Gerodontology. 2008;25(1):42-8. DOI:10.1111/j.1741-2358.2007.00163.x
19. Pattussi MP, Olinto MTA, Hardy R, Sheiham A. Clinical, social and psychosocial factors associated with self-rated oral health in Brazilian adolescents. Community Dent Oral Epidemiol. 2007;35(5):377-86. DOI:10.1111/j.1600-0528.2006.00339.x
20. Pattussi MP, Peres KG, Boing AF, Peres MA, Costa JSD. Self-rated oral health and associated factors in Brazilian elders. Community Dent Oral Epidemiol. 2010;38(4):348-59. DOI:10.1111/j.1600-0528.2010.00542.x
21. Rao JNK, Scott AJ. The analysis of categorical data from complex sample surveys: chi-squared tests for goodness-of-fit and independence in two-way tables. J Am Stat Assoc. 1981;76:221-230.
22. Sanders AE, Spencer AJ. Social inequality in perceived oral health among adults in Australia. Aust N Z J Public Health. 2004;28(2):159-66. DOI:10.1111/j.1467-842X.2004.tb00930.x
23. Silva DD, Souza MLR, Wada RS. Saúde bucal em adultos e idosos na cidade de Rio Claro, São Paulo, Brasil. Cad Saude Publica. 2004;20(2):626-31. DOI:10.1590/S0102-311X2004000200033
24. Silva DD, Rihs LB, Sousa MLR. Factors associated with maintenance of teeth in adults in the State of São Paulo, Brazil. Cad SaudePublica. 2009;25(11):2407-18. DOI:10.1590/S0102-311X2009001100011
25. Vargas AMD, Paixão HH. Perda dentária e seu significado na qualidade de vida de adultos usuários de serviço público de saúde bucal do Centro de Saúde Boa Vista, em Belo Horizonte. Cienc Saude Coletiva. 2005;10(4):1015-24. DOI:10.1590/S1413-81232005000400024
26. Victora CG, Huttly SR, Fuchs SC, Olinto MTA. The role of conceptual framework in epidemiological analysis: a hierarchical approach. Int J Epidemiol. 1997;26(1):224-7. DOI:10.1093/ije/26.1.224
This study was supported by the Conselho Nacional de Desenvolvimento Científico e Tecnológico (Process No. 485327/2007-4 – Edital Universal 2007) and by the Coordenação de Aperfeiçoamento de Pessoal de Nível Superior, 2010.
The study was based on the Master’s dissertation by Luchi C. A., entitled: “Desigualdades na autoavaliação da saúde bucal em adultos”, presented to the Post-Graduate program in Dentistry, Universidade Federal de Santa Catarina, in 2012.