Léia Cristiane L FernandesI Andréa D BertoldiI
Aluísio J D BarrosII
I Programa de Pós-Graduação em Saúde Coletiva. Universidade do Vale do Rio dos Sinos. São Leopoldo, RS, Brasil
II Departamento de Medicina Social. Faculdade de Medicina. Universidade Federal de Pelotas. Pelotas, RS, Brasil Correspondence:
Andréa D. Bertoldi Av. Unisinos, 950
93022-000 São Leopoldo, RS, Brasil E-mail: [email protected] Received: 08/15/2008
Revised: 12/09/2008 Approved: 12/16/2008
Health service use in a
population covered by the
Estratégia de Saúde da Família
(Family Health Strategy)
ABSTRACT
OBJECTIVE: To analyze health service use patterns in communities covered by the Estratégia de Saúde da Família (Family Health Strategy).
METHODS: Population-based cross-sectional study with a sample of 2,988 individuals, of all ages, living in areas covered by the Estratégia de Saúde
da Família, in the city of Porto Alegre, Southern Brazil, between July and September 2003. Pre-coded questionnaires about demographic, socioeconomic and health information were applied to all residents of selected households. Prevalence ratios and 95% confi dence intervals were calculated and chi-square tests were applied in the analyses. Poisson regression was used in the multivariable analysis to control for potential confounding factors.
RESULTS: Females, persons aged 60 years or older, white, with better socioeconomic level, without health care plan coverage and with poor health self-perception were more likely to use the local family health unit. Regarding users of other health services, a similar pattern for sex, age and health self-perception was observed. However, greater use was found among people with better socioeconomic level and with health care plan coverage.
CONCLUSIONS: Use of a local family health unit was greater among people from a lower socioeconomic level and without health care plan coverage, revealing the poorer individuals to be the priority of governmental actions. Model changes made to health care with the implementation of the Estratégia
Saúde da Família tend to progressively improve the health conditions of the poorer population, with consequent reduction of health inequalities.
DESCRIPTORS: Family Health. Health Services Accessibility. Health Services Needs and Demand. Health Services. Cross-Sectional Studies. Single Health System.
INTRODUCTION
Health service use is a complex type of behavior resulting from a set of determi-nants that includes sociodemographic and health characteristics, health service organization, and the epidemiological profi le, which can lead to a greater or lower use of services.10,12,13,17,18 Likewise, proximity of services and resources
In 1994, the Programa Saúde da Família (PSF – Family Health Program) was proposed as a strategy to reorient the health care model, aiming to: strengthen the effort to change the treatment-centered approach into a preven-tive and comprehensive one; prioritize health educa-tion and promoeduca-tion activities; and reorganize health service, seeking universality, comprehensiveness and equality.23,a,b The program’s proposal, currently known
as Estratégia de Saúde da Família (ESF – Family Health Strategy), follows an approach of high popula-tion coverage, ease of access and comprehensive care for individuals in their family context.9
Population-based studies on health service use performed in Brazil5,7,13 have provided important information about
action planning and defi nition of priorities, once they identify inequality as a characteristic present in the services. Different socioeconomic variables point in the same direction in a study on medical consultations in the previous year, indicating that the average number of consultations in higher social classes is greater than in the lower ones.7Another study, by analyzing the social
differ-ences in medical consultations for different levels of need, during a period of two months, showed inequality concentrated in the lower income group, a situation that can be changed when there is interaction with schooling. Thus, if the poorest group shows any level of education, they are more likely to visit doctors.13
Even though several studies show greater health service use in general for those with higher socioeco-nomic level,7,8,16,18 the profi le of use by people living
in areas covered by the ESF needs further study, once one of the strategy’s proposals is to offer coverage to the poorer portions of the population and reduce health service inequality.
Local authorities are currently responsible for the user’s comprehensive care, and knowledge about service use and health requirements is essential for health service managers. Identifi cation of the most vulnerable groups enables the development of educational and preventive actions for health situations involving higher service demand, identifying groups excluded from the system and, as a result, meeting the primary SUS mission, related to free and universal health care access.
In general, studies on health service use focus on current service demand, demographic characteristics and more prevalent health problems. Thus, this type of research excludes people who do not seek such services and limit actual knowledge at the population level.6
The present study aimed to analyze health service use patterns among people who live in areas covered by the ESF, and not only those who seek health services.
a Ministério da Saúde. Departamento de Atenção Básica. Atenção básica e a saúde da família [Internet]. [cited 2007 Feb 6]. Available from: http://dtr2004.saude.gov.br/dab/atencaobasica.php
b Ministério da Saúde. Saúde da Família: uma estratégia para a reorientação do modelo assistencial. Brasília (DF); 1997. METHODS
A cross-sectional study with 2,988 individuals of all ages, living in areas covered by the ESF, in the urban area of Porto Alegre, Southern Brazil, between July and September of 2003. Calculations of maximum error allowed for prevalence estimates and minimum rela-tive risks of the sample studied were made, considering an 80% power and 95% confi dence interval to detect associations between independent variables and the outcome. The minimum relative risk of the sample was 1.31 for skin color, considering a 27% prevalence of health service use in the last 15 days.
The sampling process was designed with the purpose of obtaining a representative sample of the population living in the city’s urban area covered by the ESF. According to the Censo Demográfi co de 2000 (2000 Brazilian Demographic Census), the city of Porto Alegre had 2,157 census tracts, of which 230 (10.7%) were covered by the ESF in 2003. The ESF reached about 45,700 families, with an average of 800 families per team. Of all the 62 existing units, 45 units, which had been operating for over six months, were selected by systematic sampling with probability proportional to size. In each sample unit, 20 households were selected, totaling 900. All residents in the selected households were included in the sample.
Trained interviewers applied pre-coded question-naires to all household residents. In the case of chil-dren younger than 13 years of age, the questionnaire was answered by those responsible, preferably the mothers.
The following dependent variables were analyzed: general health service use in the 15 days prior to inter-view; exclusive use of local family health unit; and use of other health services. All health services available were considered as health service use in general. Local family health unit was considered independently. In terms of use of other health services, the following were considered: other health centers and clinics, company outpatient clinics, unions, churches, public university or hospital outpatient clinics or practices, private hospital outpatient clinics or practices, private medical prac-tices or medical insurance companies, private dental practices or dental insurance companies, practices of other professionals (psychologists and phonoaudiolo-gists, for example), emergency departments, inpatient hospitals, laboratories, complementary exam hospitals, and pharmacies, among other health services.
a Instituto Brasileiro de Geografi a e Estatística. Pesquisa nacional por amostra de domicílios 2003 [Internet]. Rio de Janeiro; 2003[cited 2007 Feb 10]. Available from: http//www.ibge.gov.br
(quintiles), employment in the last 30 days, health plan coverage, and self-rated health (very good, good, fair, poor, and very poor).
The Indicador Econômico Nacional (IEN – National Economic Index)4 based on the Brazilian 2000
Demographic Census (IBGE – Brazilian Institute of Geography and Statistics),a and developed from 12
household assets and the head of the family’s level of education, was used as the socioeconomic level indicator. Individuals were distributed into reference quintiles for the city, with the fi rst quintile including individuals belonging to the population’s poorest 20%, and so on. Only individuals aged 20 years or older were considered in the “employment in the last 30 days” variable. Adjusted analysis with this variable was not performed, due to the different sample size.
Prevalence ratios and 95% confidence intervals were calculated, and chi-square tests for linear trend and heterogeneity of proportions were applied. All variables included in the crude analysis, except for “employment in the last 30 days”, entered the adjusted analysis model. Poisson multiple regression analysis was performed with Stata 9.0 software, considering possible confounding factors.3 A theoretical framework
was developed on three hierarchical levels.22 On the fi rst
level, the demographic and socioeconomic variables (sex, age, skin color and socioeconomic level) were simultaneously included. On the second level, the health plan coverage variable was included, and, on the third level, the self-rated health variable. As regards the criteria to remain in the model, all variables were adjusted for those on the upper levels and those on the same level that had a p-value <0.2. All analyses took the sampling design into account.1
The study was approved by the Comissão de Ética da Prefeitura Municipal de Porto Alegre (Porto Alegre City Hall Ethics Committee) and by the Comitê de Ética em
Pesquisa da Faculdade de Medicina da Universidade Federal de Pelotas (Pelotas Federal University School of Medicine Ethics Committee).
RESULTS
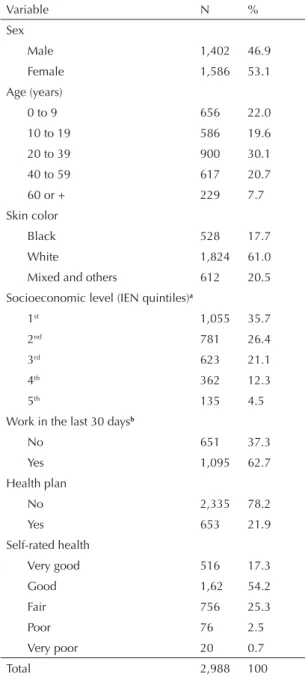
A total of 3,126 individuals were identifi ed from the 900 sampled households. Of these, 138 (4.4%) could not be contacted or did not agree to participate in the study. A total of 2,988 individuals of all ages were interviewed, of which 41.6% were younger than 20 years, 50.8% were between 20 and 59 years, and 7.7% were 60 years or older. Individuals who were female (53.1%) and white (61.0%) predominated. Regarding socioeconomic level, 62.1% were in the 1st and 2nd reference quintiles, 21.1% were in the 3rd quintile, and 16.8% were in the
4th and 5th quintiles, with the sample represented by predominantly poor people. In terms of employment in the last 30 days, 62.7% of interviewees aged 20 years or older worked in the last 30 days. About 80.0% were not covered by a health plan. The percentage of individuals who considered their health very good or good was 71.5%, whereas 25.3% considered it fair, and 3.2% poor or very poor (Table 1).
Table 1. Sample description, according to demographic, socioeconomic and health variables. City of Porto Alegre, Southern Brazil, 2003. (N = 2,988)
Variable N %
Sex
Male 1,402 46.9
Female 1,586 53.1
Age (years)
0 to 9 656 22.0
10 to 19 586 19.6
20 to 39 900 30.1
40 to 59 617 20.7
60 or + 229 7.7
Skin color
Black 528 17.7
White 1,824 61.0
Mixed and others 612 20.5
Socioeconomic level (IEN quintiles)a
1st 1,055 35.7
2nd 781 26.4
3rd 623 21.1
4th 362 12.3
5th 135 4.5
Work in the last 30 daysb
No 651 37.3
Yes 1,095 62.7
Health plan
No 2,335 78.2
Yes 653 21.9
Self-rated health
Very good 516 17.3
Good 1,62 54.2
Fair 756 25.3
Poor 76 2.5
Very poor 20 0.7
Total 2,988 100
a Indicador Econômico Nacional (National Economic Index)
for the city of Porto Alegre
Prevalence of health service use in general in the 15 days prior to interview was 26.6% (95% CI: 25.0;28.1) and prevalence of use of local family health unit and other health services was 13.5% (95% CI: 12.3;14.7) and 13.1% (95% CI: 11.8;14.3), respectively.
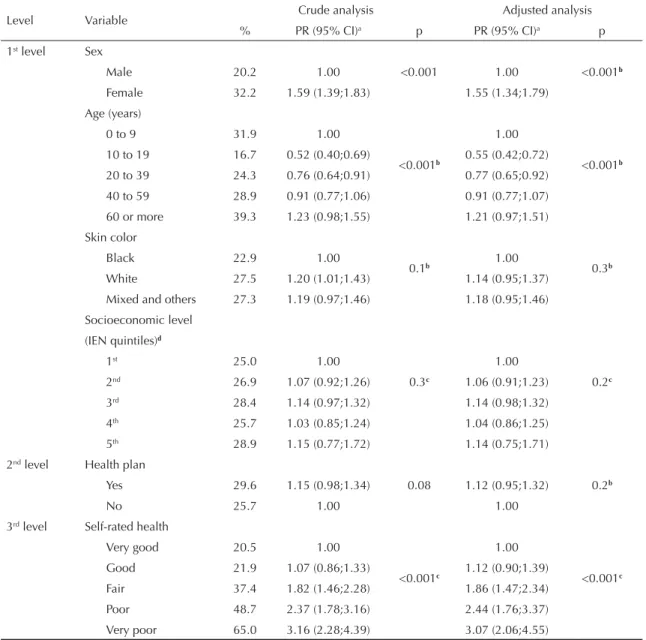
After adjusted analysis, women showed a general health service use 55% higher than men’s. Probability of health service use increased according to age (except for the zero-to-nine-year age group). Individuals in the 60-year-or-older age group were 21% more likely to use general health services than those in the zero-to-nine year age group. People with very poor self-rated
health were three times more likely to use general health services than those who considered their health very good. Skin color, socioeconomic level and health plan coverage were not statistically signifi cant either in the crude or in the adjusted analyses (Table 2).
Exclusive use of local family health unit was greater among females, aged 60 years or older, with lower socioeconomic level, without health plan coverage and with very poor self-rated health, showing a signifi cant association with all variables, in both crude and adjusted analyses. In other health services, practically the same variables were associated, except for ethnicity (greater
Table 2. Prevalences and crude and adjusted prevalence ratios of health service use in general in the 15 days prior to interview, according to demographic, socioeconomic and health variables. City of Porto Alegre, Southern Brazil, 2003. (n = 2,988)
Level Variable Crude analysis Adjusted analysis
% PR (95% CI)a p PR (95% CI)a p
1st level Sex
<0.001 <0.001b
Male 20.2 1.00 1.00
Female 32.2 1.59 (1.39;1.83) 1.55 (1.34;1.79)
Age (years)
<0.001b <0.001b
0 to 9 31.9 1.00 1.00
10 to 19 16.7 0.52 (0.40;0.69) 0.55 (0.42;0.72)
20 to 39 24.3 0.76 (0.64;0.91) 0.77 (0.65;0.92)
40 to 59 28.9 0.91 (0.77;1.06) 0.91 (0.77;1.07)
60 or more 39.3 1.23 (0.98;1.55) 1.21 (0.97;1.51)
Skin color
0.1b 0.3b
Black 22.9 1.00 1.00
White 27.5 1.20 (1.01;1.43) 1.14 (0.95;1.37)
Mixed and others 27.3 1.19 (0.97;1.46) 1.18 (0.95;1.46)
Socioeconomic level
0.3c 0.2c
(IEN quintiles)d
1st 25.0 1.00 1.00
2nd 26.9 1.07 (0.92;1.26) 1.06 (0.91;1.23)
3rd 28.4 1.14 (0.97;1.32) 1.14 (0.98;1.32)
4th 25.7 1.03 (0.85;1.24) 1.04 (0.86;1.25)
5th 28.9 1.15 (0.77;1.72) 1.14 (0.75;1.71)
2nd level Health plan
0.08 0.2b
Yes 29.6 1.15 (0.98;1.34) 1.12 (0.95;1.32)
No 25.7 1.00 1.00
3rd level Self-rated health
<0.001c <0.001c
Very good 20.5 1.00 1.00
Good 21.9 1.07 (0.86;1.33) 1.12 (0.90;1.39)
Fair 37.4 1.82 (1.46;2.28) 1.86 (1.47;2.34)
Poor 48.7 2.37 (1.78;3.16) 2.44 (1.76;3.37)
Very poor 65.0 3.16 (2.28;4.39) 3.07 (2.06;4.55)
a Prevalence ratios and 95% confi dence intervals b Chi-square test for heterogeneity of proportions c Chi-square test for linear trend
use among white people). However, the socioeconomic level and health plan coverage variables showed asso-ciations opposite to those found for use of local family health unit (Table 3).
Figure 1 shows that, in the local family health unit, people with lower socioeconomic level were five times more likely to use this type of service (16.4%) than those with higher socioeconomic level (3.0%), revealing significant linear trend. In other health services, greater use occurred among people with higher socioeconomic level (25.9%) than those with a lower level (8.6%).
Use of local family health unit was greater among people without a health plan (15%) than among those with a health plan (5.5%). However, as regards the use of other health services, individuals with a health plan were two times more likely to use them (24%) than those without a health plan (10%) (Figure 2).
People who did not work in the last 30 days (20 years or older) showed a 67% greater use of health services in general. As regards the local family health unit, people
who did not work in the last 30 days used this service two times more (19.1%) than those who worked in the same period (9.7%). In terms of other health services, people who did not work used these services 45% more frequently than those who worked in the last 30 days, which represents a signifi cant statistical difference.
Figure 1. Prevalence of use of local family health unit and other health services in the 15 days prior to interview, accor-ding to socioeconomic level quintiles. City of Porto Alegre, Southern Brazil, 2003.
aIndicador Econômico Nacional (National Economic
Index) for the city of Porto Alegre 0
5 10 15 20 25 30
1st 2nd 3rd 4th 5th
Quintileª %
Family Health Unit (n= 404)
Other health services (n= 390)
Figure 2. Prevalence of use of local family health unit and other health services in the 15 days prior to interview, according to presence of health plan. City of Porto Alegre, Southern Brazil, 2003.
Family Health Unit (n= 404) Other health services (n= 390)
0 5 10 15 20 25 30
Without health plan With health plan
Health plan coverage %
Table 3. Demographic, socioeconomic and health variables, associated with use of local family health unit and other health services, after adjusted analysis. City of Porto Alegre, Southern Brazil, 2003. (N = 2,988)
Local family health unit Other health services
PR (95% CI)a PR (95% CI)a
Sex
↑ Female ↑ Female
1.66 (1.34;2.06) 1.44 (1.18;1.77)
Age (years)
↑ 60 years or older ↑ 60 years or older
1.24 (0.91;1.71) 1.19 (0.80;1.76)
Skin color
- ↑ White
1.42 (1.05;1.90)
Socioeconomic level
↑ 1st quintile ↑ 5th quintile
(IEN quintile)b
5.25 (1.09;25.26) 2.73 (1.70;4.36)
Health plan coverage
↑ No ↑ Yes
2.34 (1.56;3.52) 1.98 (1.54;2.55)
Self-rated health
↑ Very poor ↑ Very poor
2.88 (1.69;4.92) 3.47 (1.57;7.65)
a Adjusted prevalence ratios and 95% confi dence intervals bIndicador Econômico Nacional (National Economic Index)
DISCUSSION
The methodology employed enabled health service use analysis to be performed from a population sample obtained in areas covered by the ESF. Population-based studies have the advantage of identifying people who do not use health services, thus not restricted to those users present in the service. Low percentage of loss and refusals and the sampling strategy used guaranteed validity of the information analyzed.
Prevalence of general health service use in the 15 days prior to interview was high, when compared to the 14.6% prevalence found by the Pesquisa Nacional por
Amostra de Domicílios (PNAD – National Household Survey) of the Instituto Brasileiro de Geografia e Estatística (IBGE 2007 – Brazilian Institute of Geography and Statistics),a conducted in 2003. This
fact is probably due to the profi le of people studied, as the PNAD is a population-based study, not restricted to areas covered by the ESF.
General health service use was signifi cantly greater among women, confirming several studies.5,10,12,20
Studies performed in many countries point out women of fertile age visit doctors more often, due to gyne-cological and obstetric factors.20 In addition, women
perceive health risks more easily than men, once they have more access to health information.5,20 Health
service use in general was greater as age increased, as observed in other studies.11,13,a
General health service use was greater among unem-ployed people. Likewise, in a study performed in England, significant association with unemployed people’s use of visits was found.25 In Brazil, Goldbaum
et al10 reported that health service use in the 15 days prior
to interview, in a population covered by the ESF, was sequentially greater for those inactive (18.4%), those unemployed (12.3%), those self-employed/informal workers (12.2%) and those employed (11.8%).
People with poor self-rated health were three times more likely to use general health services. Studies on the use of medical visits performed in the cities of Pelotas and Rio Grande, state of Rio Grande do Sul, observed an increase in the likelihood of visiting doctors as self-rated health worsened.5,12
Some studies show that health service use is greater among people with higher income, benefi ting the most privileged classes, even though poorer people tend to become ill earlier.15,18 However, this study did not fi nd
a signifi cant association between socioeconomic level and health service use in general.
Prevalence of use of a local family health unit and use of other health services in the 15 days prior to
interview was equivalent. Almost half of the people who used some service in the 15 days prior to inter-view (26.6%) made a visit to a local family health unit (13.5%). Greater use of local unit by people with lower socioeconomic level may have resulted from improved access to health services, once people who used other health services showed prevalence similar to that found among those who used the ESF.
Despite the ESF units working with a predefi ned clientele given its responsibility being limited to people living in its catchment area,a almost half of the people using health
services chose not to seek their neighboring unit. This choice could have been motivated by market demand, once a great number of people who did not choose the local family health unit were covered by a health plan or came from a higher socioeconomic level, resulting in conditions that favored choice and purchase of services. Another hypothesis could be explained by the fact that SUS users more often seek health services due to diseases and choose to use hospitals and emergency departments, thus refl ecting poorer health conditions resulting from their lower socioeconomic situation.17
People with a higher socioeconomic level and health plan coverage used other health services more frequently, rather than the local family health unit. In a population based study performed in Pelotas, the number of medical visits in the three months prior to research was found to be signifi cantly higher among people from classes A/B (61.6%) than those from classes C (53.9%) and D/E (55.9%).6 According to
Dias da Costa & Facchini,7 people from classes A and
B visited doctors signifi cantly more often than those from other classes, in a study on outpatient service use performed in Southern Brazil. Use of other health services is unequal, except for the family health unit, once the search for services tends to increase throughout income distribution.14
When stratifi ed by local family health unit and other health services, greater use of local unit was found among people with a lower socioeconomic level and without health plan coverage. After PNAD 2003 data on the pattern of health service use among SUS users and non-users were analyzed, it was observed that SUS users included, in their majority, individuals who were female, black and mixed, with low level of education and lower per capita family income, and without health plan coverage.17 In this way, it can be stated that some of
the SUS principles are being put into practice with the ESF implementation and expansion of public services offered, thus increasing health service access to the poorer portion of the population.
According to a study on inequalities of medical visit use according to income, performed in 21 countries, some
of these countries, including Canada, Finland, Italy, Mexico, Holland, Norway, Portugal, Sweden and the United States, showed greater use among richer people, given the same health requirements.21 On the other
hand, countries such as Australia, Austria, Belgium, Denmark, France, Germany, Greece, Hungary, Ireland, Spain, Switzerland and the United Kingdom showed equality of medical visit use, thus benefi ting poorer people. Inequalities surveyed in half of the 21 countries studied seem to be associated with what occurs after the medical visit, with the number of visits determined by medical referral or the individual’s need.21 In Canada,
people with lower income visited family doctors more frequently, showing a positive and signifi cant asso-ciation. On the other hand, they had less contact with general practitioners and medical specialists.2
Differences in use of a local family health unit were found to be less unequal than those of other health services, as exemplifi ed by the lack of difference in use of family health unit according to ethnicity. Results from this study confi rmed a more equal use of health services, even though it focused on poorer people without health plan coverage, restricting the principle of universality of access. According to Whitehead,24
health equity is viewed as the overcoming of unjust
inequalities in a certain social and historical context, with particular requirements met by specifi c govern-mental actions.
It could be affi rmed that ESF use is associated with user profi le: to be female, elderly and poor, without health plan coverage and with poor self-rated health determines greater use of local family health unit, benefi ting those with greater health care needs as they are more vulnerable to diseases.
The ESF constitutes an innovative policy that aims to reduce social inequalities and enable more egalitarian coverage.19 Thus, it is possible that the ESF is
contrib-uting to reaffi rm equality, a SUS principle that aims to reduce existing inequalities among groups who show different socioeconomic conditions, considering health care needs.
1. Altman DG. Practical statistics for medical research. London: Chapman & Hall; 1997.
2. Assada Y, Kephart G. Equity in health services use and intensity of use in Canada. BMC Health Serv Res. 2007;7:41. DOI: 10.1186/1472-6963-7-41.
3. Barros AJD, Hirakata VN. Alternatives for logistic regression in cross-sectional studies: an empirical comparison of models that directly estimate the
prevalence ratio. BMC Med Res Methodol. 2003;3:21.
DOI: 10.1186/1471-2288-3-21
4. Barros AJD, Victora CG. Indicador econômico para o Brasil baseado no censo demográfi co de 2000. Rev Saude Publica. 2005;39(4):523-9. DOI: 10.1590/ S0034-89102005000400002
5. Capilheira MF, Santos IS. Fatores individuais associados à utilização de consultas médicas por adultos. Rev Saude Publica. 2006;40(3):436-43. DOI: 10.1590/S0034-89102006000300011
6. Cesar CLG, Tanaka OY. Inquérito domiciliar como instrumento de avaliação de serviços de saúde: um estudo de caso na região sudoeste da área
metropolitana de São Paulo, 1989-1990. Cad Saude
Publica. 1996;12(Supl 2):S59-70. DOI: 10.1590/ S0102-311X1996000600007
7. Costa JSD, Facchini LA. Utilização de serviços ambulatoriais em Pelotas: onde a população consulta e com que freqüência. Rev Saude Publica. 1997;31(4):360-9. DOI: 10.1590/S0034-89101997000400005
8. Dias da Costa JS, Olinto MTA, Gigante DP, Menezes AMB, Macedo S, Daltoé T, et al. Utilização de serviços ambulatoriais de saúde em Pelotas, Rio Grande do Sul, Brasil: alguns fatores relacionados com as consultas médicas acima da média. Cad Saude Publica. 2008;24(2):353-63.
9. Duncan BB, Schmidt MI, Giugliani ERJ. Medicina ambulatorial: condutas de atenção primária baseadas em evidências. Porto Alegre: Artmed; 2004.
10. Goldbaum M, Gianini RJ, Novaes HMD, César CLG. Utilização de serviços de saúde em áreas cobertas pelo programa saúde da família (Qualis) no Município de São Paulo. Rev Saude Publica. 2005;39(1):90-9. DOI: 10.1590/S0034-89102005000100012
11. Louvison MCP, Lebrão ML, Duarte YAO, Santos JLF, Malik AM, Almeida ES. Desigualdades no uso e acesso aos serviços de saúde entre idosos do município de São Paulo. Rev Saude Publica. 2008;42(4):733-40. DOI: 10.1590/S0034-89102008000400021
12. Mendoza-Sassi R, Béria JU. Utilización de los servicios de salud: una revisión sistemática sobre los factores relacionados. Cad Saude Publica. 2001;17(4):819-32. DOI: 10.1590/S0102-311X2001000400016
13. Mendoza-Sassi R, Béria JU, Barros AJD. Outpatient health service utilization and associated factors: a population-based study. Rev Saude Publica. 2003;37(3):372-8. DOI: 10.1590/S0034-89102003000300017
14. Neri M, Soares W. Social inequality and health in Brazil. Cad Saude Publica. 2002;18(Suppl):77-87. DOI: 10.1590/S0102-311X2002000700009
15. O’Donnell O. Access to health care in developing countries: breaking down demand side barriers. Cad Saude Publica. 2007;23(12):2820-34. DOI: 10.1590/ S0102-311X2007001200003
16. Pinheiro RS, Travassos C. Estudo da desigualdade na utilização de serviços de saúde por idosos em três regiões da cidade do Rio de Janeiro. Cad Saude Publica. 1999;15(3):487-96. DOI: 10.1590/S0102-311X1999000300005
17. Ribeiro MCSA, Barata RB, Almeida MF, Silva ZP. Perfi l sociodemográfi co e padrão de utilização de serviços de saúde para usuários e não-usuários do SUS – PNAD 2003. Cienc Saude Coletiva. 2006;11(4):1011-22. DOI: 10.1590/S1413-81232006000400022
18. Sawyer DO, Leite IC, Alexandrino R. Perfi s de utilização de serviços de saúde no Brasil. Cienc Saude Coletiva. 2002;7(4):757-76. DOI: 10.1590/S1413-81232002000400012
19. Sisson MC. Considerações sobre o Programa de Saúde da Família e a promoção de maior equidade na política de saúde. Saude Soc. 2007;16(3):85-91. DOI: 10.1590/S0104-12902007000300008
20. Travassos C, Viacava F, Pinheiro RS, Brito AS. Utilização dos serviços de saúde no Brasil: gênero, características familiares e condição social. Rev Panam Salud Publica. 2002;11(5-6):365-73. DOI: 10.1590/ S1020-49892002000500011
21. Van Doorslaer E, Masseria C, OECD Health Equity Research Group Members. Income-related inequality in the use of medical care in 21 OECD countries. Paris; 2004. (OECD Health Working Paper, 14).
22. Victora CG, Huttly SR, Fuchs SC, Olinto MT. The role of conceptual frameworks in epidemiological analysis: a hierarchical approach. Int J Epidemiol. 1997;26(1):224-7. DOI: 10.1093/ije/26.1.224
22. Weber CAT. Programa de saúde da família: educação e controle da população. Porto Alegre: AGE; 2006.
23. Whitehead M. The concepts and principles of equity in health. Int J Health Serv. 1992;22(3):429-45. DOI: 10.2190/986L-LHQ6-2VTE-YRRN
24. Yuen P, Balarajan R. Unemployment and patterns of consultation with the general practitioner.
BMJ. 1989;298(6682):1212-4. DOI: 10.1136/
bmj.298.6682.1212

![Progress toward "Health for All by the Year 2000" [editorial]](data:image/gif;base64,R0lGODlhAQABAIAAAP///wAAACH5BAEAAAAALAAAAAABAAEAAAICRAEAOw==)