Abstract
Objective: To propose cutoff points for waist circumference of schoolchildren for the identiication of cardiovascular disease risk factors.
Methods: This school-based cross-sectional study surveyed 1,413 schoolchildren aged 7 to 12 years old, selected by random cluster sampling. Waist circumference, total cholesterol and systolic and diastolic pressures were measured. Reference values for cardiovascular disease risk factors were developed from measures of total cholesterol and systolic and diastolic blood pressures. The receiver operating characteristic (ROC) curve and bivariate analysis, followed by calculation of sensitivity, speciicity and odds ratio, were used in data analysis.
Results: The cutoff points had area values under the ROC curve ranging between 0.603 and 0.949, while sensitivity and speciicity ranged between 0.500 and 1.00. Among all proposals analyzed, the one presented by this study best balanced sensitivity and speciicity values. Bivariate analysis followed by odds ratios calculation indicated that subjects with waist circumference above the proposed cutoff points have increased chances of presenting cardiovascular disease risk factors.
Conclusions: The cutoff points proposed in the present study seem to be a valid alternative and better balance sensibility and speciicity than other proposals for screening students with increased chances of presenting cardiovascular disease risk factors.
J Pediatr (Rio J). 2010;86(5):411-416: Anthropometry, ROC curve, sensitivity, speciicity, children.
ORiginAl ARtiCle
Copyright © 2010 by Sociedade Brasileira de Pediatria411 introduction
Studies with adults suggest abdominal fat deposition is a more important indicator for the onset cardiovascular disease (CVD) and its risk factors than overall fat levels.1-3
Measuring waist circumference (WC) is a good way to determine central adiposity,4 making it a viable alternative to screen individuals at high risk for CVD. Among children and adolescents, the measure also seems to be irmly
related to central adiposity.5-7
As well as their direct relationship with central adiposity,
WC measures from children and adolescents are associated with CVD risk factors,8-10 enabling their use as an instrument
to screen children and adolescents for greater likelihood of
developing these conditions. However, while speciic values
for adult men and women4 allow us to assess WC in terms
of cardiovascular health, the growth process requires us to establish age-dependent cutoff points for children and
Waist circumference as screening instrument
for cardiovascular disease risk factors in schoolchildren
gabriel g. Bergmann,1 Adroaldo gaya,2 Ricardo Halpern,3 Mauren l. A. Bergmann,4 Ricardo R. Rech,4 Cristine B. Constanzi,4 lidiane R. Alli4
1. Doutor, Ciências do Movimento Humano, Universidade Federal do Rio Grande do Sul (UFRGS), Porto Alegre, RS, Brazil. 2. Doutor, Ciências do Desporto, Universidade do Porto, Porto, Portugal.
3. Doutor, Ciências Médicas. Doutor, Pediatria, UFRGS, Porto Alegre, RS, Brazil. 4. Mestre, Saúde Coletiva, Universidade Luterana do Brasil (ULBRA), Canoas, RS, Brazil.
No conflicts of interest declared concerning the publication of this article.
Suggested citation: Bergmann GG, Gaya A, Halpern R, Bergmann ML, Rech RR, Constanzi CB, et al. Waist circumference as screening instrument for cardiovascular disease risk factors in schoolchildren. J Pediatr (Rio J). 2010;86(5):411-416.
Manuscript submitted Apr 09 2009, accepted for publication Jun 30 2010.
adolescents.11 Thus, some authors have proposed solutions
that would enable us to assess WC values for children and adolescents.8,12,13
In Brazil, only one study has proposed cutoff points for
children’s WC.14 However, there have been no proposed cutoff
points for children and adolescents of various ages using a representative sample, requiring the use of international proposals in order to classify individuals according to WC values. Considering the information presented and discussed below, the objectives of this study are: a) to propose cutoff points for WC values for schoolchildren; b) to assess the performance of the WC cutoff points found in the literature as screening instruments for CVD risk factors in schoolchildren; c) to identify which proposed cutoff points for WC can best identify which schoolchildren have CVD risk factors.
Methods
This school-based cross-sectional study surveyed schoolchildren aged 7 to 12 years old of both genders enrolled in city, state and private institutions in Caxias do
Sul, in the Brazilian state of Rio Grande do Sul. In 2005,
according to data from the State Department of Education, there were 33,241 schoolchildren aged 7 to 12 years old in
the state. Based on similar studies,15,16 mean prevalence
of high blood pressure and hypercholesterolemia was estimated at 20 percent to calculate the appropriate sample
size. Using a 95 percent conidence interval, test power of
80 percent, and error of estimation of 3 percent, the study
required a sample of 669 children. Using a design effect of
2 to control for confounding factors, as well as an additional
15 percent to compensate for possible losses and refusals, initial estimates suggested the study needed to assess 1,573 children. Of the 1,573 children assessed in this study, WC and blood pressure (BP) was measured for 1,413 of them;
1,294 allowed the collection of blood samples. The study used random cluster sampling, with each school representing
one cluster. All schools took part of the random selection
process and had the same odds depending on the number of enrollees aged 7 to 12 years old in each school. The study was approved by the Research Ethics Committee of
Universidade Luterana do Brasil (Protocol 2006-365H). Data were collected between April and August 2007.
Waist circumference measurements were made using a Sanny® (American Medical do Brasil Ltda., São Bernardo do Campo, Brazil) tape measure by positioning the tape
between costal margin and iliac crest of subjects.17 The
reference criteria for the analysis comes from cutoff points proposed by Freedman et al.,8 Taylor et al.12 and Fernández
et al.13
The following CVD risk factors were measured in the participants: total cholesterol (TC), systolic blood pressure
(SBP), and diastolic blood pressure (DBP). TC values were obtained using an Accutrend® GCT (Roche Diagnostics,
São Paulo, Brazil) portable monitor. Schoolchildren were
not required to fast for any period before collection, since
there was no signiicant variation whether the individual
fasted or not.18 This form of measuring TC (Accutrend® GCT
portable monitor) and this procedure (not fasting) were used
by Sociedade Brasileira de Cardiologia (Brazilian Cardiology
Society) in a national campaign that surveyed over 81 thousand individuals.19 Total cholesterol was considered “desirable” if below 170 mg/dL; “threshold” if between 170 and 199 mg/dL; and “high” if 200 mg/dL or higher.18
BP measures were taken using (pediatric) stethoscopes and cuffs manufactured by Becton Dickinson® (Becton, Dickinson and Company, São Paulo, Brazil) as well as
sphygmomanometers by Cardiomed® (Curitiba, Brazil) and
Oxigen®, all certiied by Instituto Nacional de Metrologia. SBP was determined by the irst Korotkoff sound, while DBP
was determined by their disappearance. Three measures were taken from each patient, at intervals of 3 minutes.
BP was categorized by gender, age and height percentile. Subjects were considered normal if they had SBP and DBP
below the 90th percentile; “pre-hypertensive” if between
the 90th and 95th percentiles; and “hypertensive” if above the 95th percentile.20
In order to propose cutoff points for WC, we used the
receiver operating characteristic (ROC) curve to analyze
the data. The procedure requires a reference variable (binary variable) and a test variable (in this study, WC). To that end, CVD risk factors were used to establish three possible references. These references were CVD risk factors
score ≥ 5 (CVD score ≥ 5); CVD risk factors score ≥ 6 (CVD score ≥ 6); and CVD risk factors score ≥ 7 (CVD score ≥ 7).
The three CVD risk factors scores were developed by adding
other factors, considering TC classiication proposed by III Diretrizes Brasileiras Sobre Dislipidemias (III DBSD, third Brazilian dyslipidemia guidelines)18; and SBP and DBP by the National High Blood Pressure Education Program (NHBPEP)20. In this categorization, lack of risk factors (TC = desirable; SBP and DBP = normal) equals “1,” presence of intermediate risk factors (TC = threshold; SBP and DBP =
prehypertensive) equals “2” and presence of risk factors
(TC = high; SBP and DBP = hypertensive) equals “3.” After establishing these three references for CVD risk
factors, the ROC curve between each of them was determined
and WC stratiied into gender and age groups. The reference
with the greatest area under the curve, according to age averages, was chosen as the reference value for CVD risk
factors. For boys, the reference was CVD score ≥ 6 (0.789), while for girls it was ≥ 7 (0.688). With deinite CVD risk factor references, speciic WC values that best balanced sensitivity and speciicity were identiied for each age and
gender group, thus establishing cutoff points for WC from the data collected in this study.
In the attempt to identify individuals at higher odds
Boys girls
CVD score ≥ 6 CVD score ≥ 7
Age n AUC 95%Ci SenS SPeC CP n AUC 95%Ci SenS SPeC CP
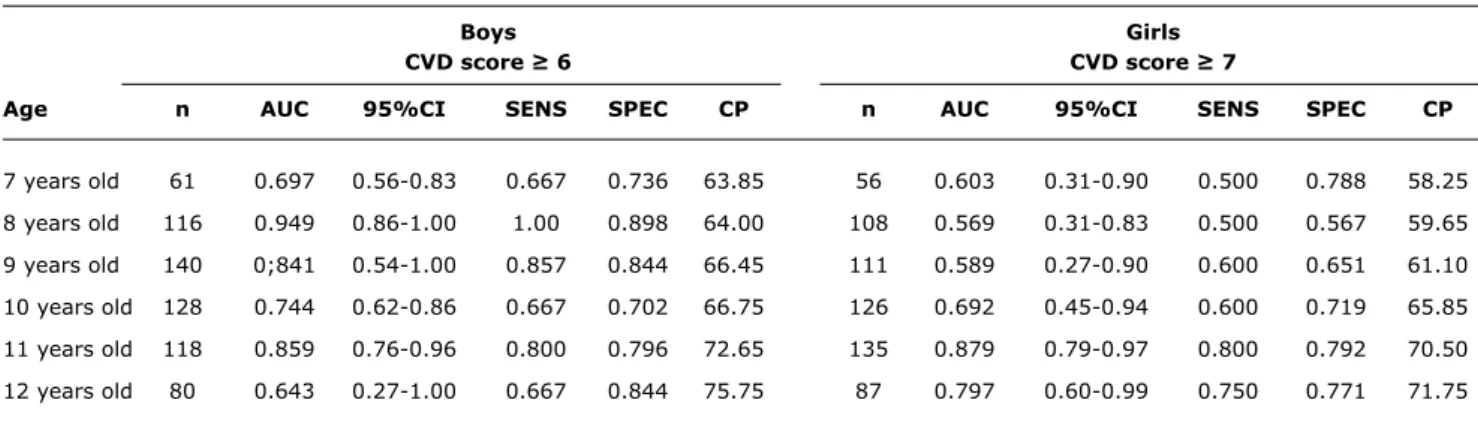
7 years old 61 0.697 0.56-0.83 0.667 0.736 63.85 56 0.603 0.31-0.90 0.500 0.788 58.25 8 years old 116 0.949 0.86-1.00 1.00 0.898 64.00 108 0.569 0.31-0.83 0.500 0.567 59.65 9 years old 140 0;841 0.54-1.00 0.857 0.844 66.45 111 0.589 0.27-0.90 0.600 0.651 61.10 10 years old 128 0.744 0.62-0.86 0.667 0.702 66.75 126 0.692 0.45-0.94 0.600 0.719 65.85 11 years old 118 0.859 0.76-0.96 0.800 0.796 72.65 135 0.879 0.79-0.97 0.800 0.792 70.50 12 years old 80 0.643 0.27-1.00 0.667 0.844 75.75 87 0.797 0.60-0.99 0.750 0.771 71.75 table 1 - Results of receiver operating characteristic curve between waist circumference and reference values for cardiovascular disease
risk factors
AUC = area under receiver operating characteristic curve; CP = cutoff point for waist circumference (cm) above which subject is at increased risk for cardiovascular disease risk factors; CVD = cardiovascular disease; n = sample; SENS = sensitivity; SPEC = specificity.
WC cutoff points suggested by the literature and by this study. The analysis used bivariate analysis to assess the
WC of schoolchildren in this sample, as categorized by each
proposed cutoff point and using the references with the greatest area under the ROC curve, followed by sensitivity
and speciicity calculations. To identify how much each
individual surpassing the WC cutoff point in each proposal was at higher of having CVD risk factors than their peers with smaller WC, this study used bivariate analysis followed
by odds ratio calculations (OR). Analyses used to identify
cutoff points considered an area under the ROC curve of
at least 50% (0.5)21, while bivariate analyses used a 95% conidence interval (95%CI) and p ≤ 0.05. All analysis was
performed using Statistical Package for the Social Sciences (SPSS®, SPSS Inc., IBM, Chicago, IL, EUA) for Windows,
version 13.0.
Results
The results of the analysis of the ROC curve between WC and CVD risk factor references by age and gender can
be found in Table 1. Analyzing the results, we see that
proposed cutoff points become higher as male and female subjects grow older. The area under the ROC curve was
greater than 50 percent for all ages and both genders, ranging from 0.603 (60.3%) to 0.949 (94.9%). Sensitivity values ranged from 0.500 (50%) to 1.00 (100%) for all
ages and both genders, thus showing the ability to identify
schoolchildren classiied as having CVD risk factors above cutoff values (true positives). Speciicity values ranged from 0.549 (54.9%) to 0.898 (89.8%), thus showing the ability to identify schoolchildren classiied as not having CVD risk
factors below cutoff values (true negatives).
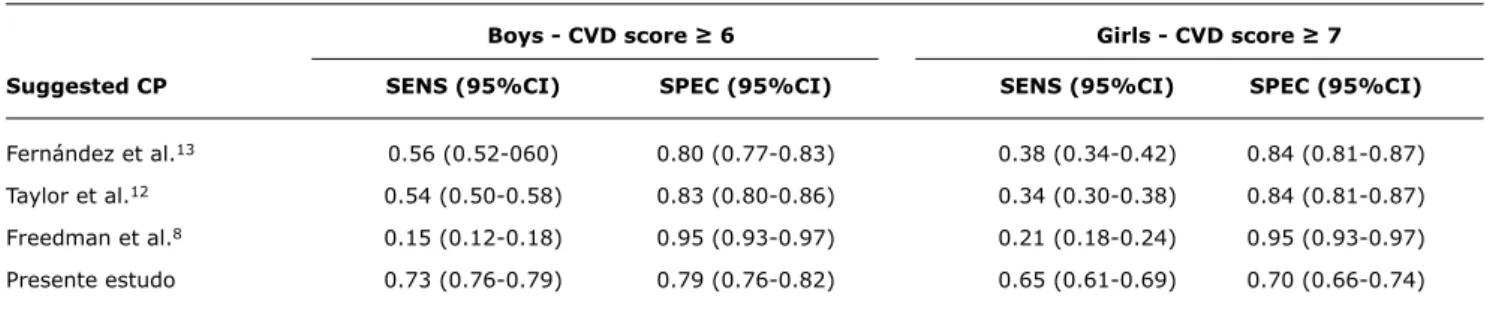
Table 2 shows sensitivity and speciicity values calculated
using bivariate analysis between WC cutoff points proposed by Freedman et al.,8 Taylor et al.,12 Fernández et al.13 and
the present study, with their respective CVD risk factors
reference values stratiied into gender groups. Analyzing the results, we ind the proposal put forth by this study
has the highest values and best balances sensitivity and
speciicity, recommending it for the choice of WC cutoff
points. The cutoff points found in the literature had low
sensitivity and high speciicity values, making them less
capable of identifying true positives, though more capable of identifying true negatives (Table 2).
When WC is categorized according to the cutoff points
proposed by this study and associated to CVD risk factor references through bivariate analysis followed by OR calculations, we see that schoolchildren of both genders who are above the cutoff points are at higher odds of having
CVD risk factors (Table 3). Boys above the cutoff point are
10.2 times more likely to have CVD risk factors than those
below it, while girls are 4.59 times more likely to have CVD
risk factors if they are above the cutoff point (Table 3).
Discussion
Considering the evidence that individuals with greater central adiposity are more susceptible to CVD and its risk factors,1-3 and that these diseases begin in childhood and
adolescence22, identifying values that increase the risk of
developing these problems among schoolchildren seems critically important and a useful instrument for primary
prevention. Thus, this study is a irst national attempt to
propose WC cutoff points in a school-based population sample, with empirical validation through association with CVD risk factors.
Mean values for ages below the ROC curve in our study (0.789 and 0.688 for boys and girls, respectively) were similar (0.88 and 0.74 for boys and girls, respectively) to
Boys - CVD score ≥ 6 Girls - CVD score ≥ 7
Suggested CP SenS (95%Ci) SPeC (95%Ci) SenS (95%Ci) SPeC (95%Ci)
Fernández et al.13 0.56 (0.52-060) 0.80 (0.77-0.83) 0.38 (0.34-0.42) 0.84 (0.81-0.87)
Taylor et al.12 0.54 (0.50-0.58) 0.83 (0.80-0.86) 0.34 (0.30-0.38) 0.84 (0.81-0.87)
Freedman et al.8 0.15 (0.12-0.18) 0.95 (0.93-0.97) 0.21 (0.18-0.24) 0.95 (0.93-0.97)
Presente estudo 0.73 (0.76-0.79) 0.79 (0.76-0.82) 0.65 (0.61-0.69) 0.70 (0.66-0.74) table 2 - Sensitivity and speciicity of waist circumference cutoff points proposed by Fernández et al.,13 Taylor et al.,12 Freedman et al.8
and this study in relation to CVD score ≥ 6 (male) and CVD score ≥ 7 (female)
95%CI = 95% confidence interval; CP = cutoff points; CVD = cardiovascular disease; SENS = sensitivity; SPEC = specificity.
Boys (CVD score ≥ 6) Girls (CVD score ≥ 7)
CP suggested n (%) OR 95%Ci p n (%) OR 95%Ci p
Fernández et al.
Below CP 503 (78.2) 1.00 – – 517 (17.0) 1.00 – –
Above CP 140 (21.8) 5.32 2.78-10.18 0.000 106 (83.0) 3.22 1.47-7.04 0.002
Taylor et al.
Below CP 518 (80.6) 1.00 – – 520 (83.5) 1.00 – –
Above CP 125 (19.4) 5.63 2.94-10.78 0.000 103 (16.5) 2.85 1.28-6.32 0.007
Freedman et al.
Below CP 609 (5.0) 1.00 – – 590 (94.7) 1.00 – –
Above CP 34 (95.0) 3.53 1.37-9.08 0.006 33 (5.3) 5.50 2.07-10.70 0.000
This study
Below CP 486 (75.6) 1.00 – – 430 (69.0) 1.00 – –
Above CP 157 (24.4) 10.20 4.97-20.91 0.000 193 (31.0) 4.59 2.09-10.06 0.000
table 3 - Result of bivariate analysis followed by odds ratio calculations for cardiovascular disease risk factor reference values and waist circumference categorized by various proposed cutoff points
95%CI = 95% confidence interval; CP = cutoff points; CVD = cardiovascular disease; n (%) = absolute and (percentage) sample number; OR = odds ratio; p = significance.
authors proposed WC cutoff points using a sample of 374
schoolchildren, mean age 11, by analyzing the ROC curve
and using blood lipid levels as reference. However, a study by Taylor et al.12 used trunk fat as measured by dual energy X-ray absorptiometry (DEXA) as reference to calculate the
area under the ROC curve, and it found higher values for the area under the ROC curve (0.97 for both genders) above those found by the present study.
The higher values for the area under the ROC curve found in the study by Taylor et al.12 may be explained by the fact it used DEXA to measure of trunk fat (WC also measures the trunk), and so it makes sense to ind a greater area
under the ROC curve. That perspective is supported by the strong association between WC and trunk fat as measured by imaging techniques in children and adolescents.5-7On
the other hand, despite the association between higher WC and higher blood lipid and blood pressure levels, correlation
between WC and CVD risk factors are only moderate to low,8,23 possibly because many variables contribute to the variation in CVD risk factors results, such as physical itness,
habitual physical activity, nutritional status, dietary habits, family history, socioeconomic status, and maturational stage.15,24-29 We should also stress that the CVD risk factor
scores used in this study do not consider other risk factors, such as triglycerides and high- (protective factor) and low- (risk factor) density proteins. Not controlling for these represents a limitation of the results of the present study. However, since we have found satisfactory values for the
area under the ROC curve, sensitivity and speciicity, that
limitation does invalidate the results found by the study as proposed WC cutoff points for schoolchildren.
Among the cutoff points studied, none better balanced sensitivity and speciicity than those proposed by this study.
References
1. Fox CS, Massaro JM, Hoffmann U, Pou KM, Maurovich-Horvat P, Liu CY, et al. Abdominal visceral and subcutaneous adipose
tissue compartments: association with metabolic risk factors in the Framingham Heart Study. Circulation. 2007;116:39-48. 2. Rezende FA, Rosado LE, Ribeiro Rde C, Vidigal Fde C, Vasques
AC, Bonard IS, et al. Body mass index and waist circumference:
association with cardiovascular risk factors. Arq Bras Cardiol. 2006;87:728-34.
3. Zhu S, Wang Z, Heshka S, Heo M, Faith MS, Heymsield SB. Waist circumference and obesity-associated risk factors among whites in the third National Health and Nutrition Examination Survey: clinical action thresholds. Am J Clin Nutr. 2002;76:743-9. 4. World Health Organization (WHO). Physical status: the use
and interpretation of anthropometry. Report of a WHO Expert Committee. Technical. Report Series, No. 854. Geneva: WHO; 1995.
5. Goran MI, Gower BA, Treuth M, Nagy TR. Prediction of intra-abdominal and subcutaneous intra-abdominal adipose tissue in healthy pre-pubertal children. Int J Obes Relat Metab Disord. 1998;22:549-58.
6. Goran MI. Visceral fat in prepubertal children: inluence of obesity,
anthropometry, ethnicity, gender, diet, and growth. Am J Hum Biol. 1999;11:201-7.
7. Brambilla P, Bedogni G, Moreno LA, Goran MI, Gutin B, Fox KR, et al. Crossvalidation of anthropometry against magnetic resonance imaging for the assessment of visceral and subcutaneous adipose tissue in children. Int J Obes (London). 2006;30:23-30.
identifying schoolchildren at higher odds of presenting CVD risk factors. On the other hand, the waist circumference evaluation values proposed by Freedman et al.8 had the worst balance between sensitivity and speciicity, and were
the least useful at identifying true positives. The study by
Almeida et al.,30 which calculated sensitivity and speciicity
values for the WC cutoff points proposed by Freedman et al.8 and Taylor et al.,12 using, among other parameters, TC,
and the study by Rosa et al.,10 which calculated sensitivity and speciicity values for the WC cutoff points proposed by Fernández et al.,13 using high blood pressure, had low sensitivity and high speciicity values for the three proposals, which agrees with the indings of the present study.
Bivariate analysis, followed by odds ratio calculation, identiied that schoolchildren above the proposed cutoff
points are at higher risk of presenting CVD risk factors than those below these cutoff points. The results of this analysis agrees with the available literature, which indicates an association between high WC values and the presence of CVD risk factors among children and adolescents.8-10,28
Considering the results of this study, the evidence indicates individuals with higher WC values are more likely to have CVD risk factors than those with lower values.
Also, the cutoff points proposed by the present study are
more appropriate than those provided by the literature for the task of identifying schoolchildren more likely to have CVD risk factors. Thus, the study suggests that we should measure WC and use its proposed cutoff points to screen schoolchildren at higher risk of having CVD risk factors.
8. Freedman DS, Serdula MK, Srinivasan SR, Berenson GS. Relation of circumferences and skinfold thicknesses to lipid and insulin
concentrations in children and adolescents: the Bogalusa Heart
Study. Am J Clin Nutr. 1999;69:308-17.
9. Guimarães IC, de Almeida AM, Santos AS, Barbosa DB, Guimarães AC. Blood pressure: effect of body mass index
and of waist circumference on adolescents. Arq Bras Cardiol. 2008;90:393-9.
10. Rosa ML, Mesquita ET, da Rocha ER, Fonseca Vde M. Body mass
index and waist circumference as markers of arterial hypertension in adolescents. Arq Bras Cardiol. 2007;88:573-8.
11. Wang GJ. Standardization of waist circumference reference data.
Am J Clin Nutr. 2006;83:3-4.
12. Taylor RW, Jones IE, Williams SM, Goulding A. Evaluation of waist circumference, waist-to-hip ratio, and the conicity index as screening tools for high trunk fat mass, as measured by dual-energy X-ray absorptiometry, in children aged 3-19 y. Am J Clin Nutr. 2000;72:490-5.
13. Fernández JR, Redden DT, Pietrobelli A, Allison DB. Waist circumference percentiles in nationally representative samples
of African-American, European-American, and Mexican-American
children and adolescents. J Pediatr. 2004;145:439-44.
14. Lunardi CC, Petroski EL. Índice de Massa Corporal, circunferência
da cintura e dobra cutânea triciptal na predição de alterações
lipídicas em crianças com 11 anos de idade. Arq Bras Endocrinol Metab. 2008;52:1009-14.
15. Coronelli CL, de Moura EC. Hipercolesterolemia em escolares e seus fatores de risco. Rev Saude Publica. 2003;37:24-31. 16. Moura AA, Silva MA, Ferraz MR, Rivera IR. Prevalência de pressão
arterial elevada em escolares e adolescentes de Maceió. J Pediatr (Rio J). 2004;80:35-40.
17. McCarthy HD, Jarret KV, Crawley HF. The development of waist
circumference percentiles in British children aged 5.0-16.9 y. Eur J Clin Nutr. 2001;55:902-7.
18. Santos RD; Sociedade Brasileira de Cardiologia. III Diretrizes brasileiras sobre dislipidemias e diretriz de prevenção da aterosclerose do Departamento de Aterosclerose da Sociedade Brasileira de Cardiologia. Arq Bras Cardiol. 2001;77 Suppl 3:1-48.
19. Martinez TL, Santos RD, Armaganijan D, Torres KP, Loures-Vale A, Magalhães ME, et al. National alert campaign about increased
cholesterol: determination of cholesterol levels in 81,262 Brazilians.
Arq Bras Cardiol. 2003;80:635-8.
20. National High Blood Pressure Education Program Working Group on High Blood Pressure in Children and Adolescent. The fourth report
on the diagnosis, evaluation, end treatment of high blood pressure in children and adolescents. Pediatrics. 2004;114:555-76. 21. Erdreich LS, Lee ET. Use of relative operating characteristic analysis
in epidemiology: a method for dealing with subjective judgement.
Am J Epidemiol. 1981;114:649-62.
22. Raitakari OT, Juonala M, Kähönen M, Taittonen L, Laitinen T, Mäki-Torkko N, et al. Cardiovascular risk factors in childhood and carotid artery intima-media thickness in adulthood: the Cardiovascular
Risk in Young Finns Study.JAMA. 2003;290:2277-83.
23. Costa RS, Sichieri R. Relação entre sobrepeso, adiposidade e distribuição de gordura com a pressão arterial de adolescentes no município do Rio de Janeiro. Rev Bras Epidemiol. 1998;1:268-79.
24. Forti N, Diogo Giannini S, Diament J, Issa J, Fukushima J, Dal Bó C, et al. Fatores de risco para doença Arterial coronariana em crianças e adolescentes ilhos de coronariopatias jovens. Arq Bras Cardiol. 1996;66:119-23.
25. Brage S, Wedderkopp N, Ekelund U, Franks PW, Wareham NJ, Andersen LB, et al; European Youth Heart Study (EYHS). Features of
the metabolic syndrome are associated with objectively measured
physical activity and itness in Danish children: the European Youth Heart Study (EYHS). Diabetes Care. 2004;27:2141-8. 26. Hopper CA, Gruber MB, Munoz KD, MacConnie SE, Pingston YM,
Nguyen K. Relationship of blood cholesterol to body composition,
physical itness, and dietary intake measures in third-grade children
27. Duarte JA, Ribeiro JC, Oliveira J, Mota J. The relationship between physical activity cholesterol levels in children and adolescents.
Rev Bras Saude Matern Infant. 2004;4:185-92.
28. Ruiz JR, Ortega FB, Loit HM, Veidebaum T, Sjostrom M. Body
fat is associated with blood pressure in school-aged girls with
low cardiorespiratory itness: the European Youth Heart Study. J Hypertens. 2007;25:2027-34.
29. Santos MG, Pegoraro M, Sandrini F, Macuco EC. Risk factors for the development of atherosclerosis in childhood and adolescence. Arq Bras Cardiol. 2008;90:276-283.
30. de Almeida CA, Pinho AP, Ricco RG, Elias CP. Abdominal
circumference as an indicator of clinical and laboratory parameters associated with obesity in children and adolescents: comparison between two reference tables. J Pediatr (Rio J). 2007;83:181-5.
Correspondence: Gabriel G Bergmann