Submited on: 07/05/2009 Accepted on: 10/28/2009
Corresponding author: Marcelo Mazza do Nascimento Hospital Universitário Evan-gélico de Curitiba – Setor de Nefrologia
Rua Augusto Stellfeld, 1908 4o andar - Bigorrilho – Curitiba PR - Brazil CEP: 80730-150 Phone: 41 3335-7907 E-mail: [email protected] The referred study was conducted at the Clínica de Doenças Renais de Curitiba - Hospital Universitário Evangélico de Curitiba, Paraná, Brazil, and at the Karolinska Institutet, Sto-ckholm, Sweden. Suppor-ted by Fundação Pró-renal. Authors
Melissa Massaki Nihi, RD1 Roberto Ceratti Manfro, MD, PhD2
Cristina Martins, RD, PhD3 Mohamed Suliman, MD, PhD3
Yukio Murayama, MD3 Miguel Carlos Riella, MD, PhD1
Bengt Lindholm, MD, PhD3
Marcelo Mazza do Nascimento, MD, PhD1,3
1Hospital Universitário
Evangélico De Curitiba – Brazil
2Medical School,
Depart-ment of Internal Medicine, Universidade Federal do Rio Grande do Sul
3Divisions of Renal Medicine
and Baxter Novum, Depart-ment of Clinical Science, Karolinska Institutet, Hud-dinge Hospital, Stockholm, Sweden
A
BSTRACTIntroduction: The presence of malnutrition has been associated with inflammation and oxidative stress (OS) in patients on chronic hemodialysis (HD). Objective: To assess the association between nutritional status markers, such as body fat (BF), markers of inflammation and of OS in patients on HD. Methods: Cross-sectional study performed with 40 patients on HD. The nutritional status was evaluated by use of the modified subjective global assessment (SGAm), normalized total protein equiva-lent of nitrogen appearance (PNAn), serum albumin (Alb-s), body mass index (BMI), BF, and lean body mass (LBM). Inflamma-tion and OS were assessed by use of high-sensitivity protein C-reactive (HS-PCR), interleukin-6 (IL-6), advanced oxidation protein products (AOPP), 8-hydroxydeo-xyguanosine (8OHdG), and pentosidine.
Results: Some degree of malnutrition was observed in 37% of the patients assessed through SGAm. Median and variation of BF (kg) were 16.2 and 5.3-36.7, respective-ly. Regarding the markers of inflammation and of OS, a positive and significant corre-lation was observed between BMI and HS-PCR (R = 0.37; p = 0.02), BF and HS-HS-PCR (R = 0.32; p = 0.04), and between HS-PCR and IL-6 (R = 0.51; p = 0.0007). A negative correlation was found between Alb-s and HS-PCR (R = -0.31; p = 0.05). Only in males HS-PCR related to BMI (R = 0.54; p = 0.01) and to BF (R = 0.52; p = 0.01). No association was found between markers of inflammation and of OS. Conclusion:
Markers of malnutrition and of overweight did not correlate with OS. The association of HS-PCR with BMI and BF only in the male sex may suggest differences in the inflamma-tory response between the sexes.
Keywords: inflammation, oxidative stress, nutritional status, hemodialysis.
[J Bras Nefrol 2010;32(1):9-15]©Elsevier Editora Ltda.
Association between body fat, infl ammation
and oxidative stress in hemodialysis
I
NTRODUCTIONProtein-energy malnutrition (PEM) is a consistent finding in a large proportion of patients with chronic kidney disease (CKD). In those patients, PEM has been suggested to result from a chronic in-flammatory process.1,2 The combination
of factors, such as uremic syndrome per se, heart failure, persistent infections, bioincompatibility of the dialyzer mem-brane, and the build-up of advanced gly-cation end-products, may contribute to the development of inflammation in that clinical condition.3,4
Associations between malnutrition, high levels of C-reactive protein pro-tein C-reactive (PCR), and the presence of atherosclerosis in patients with CKD have been reported.5,6 In those patients,
high levels of PCR seem to affect the ge-neration of pro-inflammatory cytokines [interleukin-1 (IL-1), interleukin-6 (IL-6), and tumor necrosis factor α (TNF-α)].7,8
In fact, high levels of those cytokines may induce muscle mass loss, reducing albu-min synthesis, inhibiting appetite, and contributing to the development of mal-nutrition.9 In addition, the association of
inflammation and oxidative stress (OS) has been reported in patients with CKD. Oxidative stress occurs in inflammation sites, during small injuries, and as part of the reaction to invasive microorganis-ms.10 That reaction causes the production
of several reactive oxygen species (ROS), generating modified macromolecules, which then could be involved in the athe-rogenic process.5
In addition, the association between body fat (BF), inflammatory markers, and OS has been investigated.3,11 The adipose
comorbidities, and period of time on dialysis time. Then, a nutritional physical examination is perfor-med to assess the reserves of muscle mass and body fat, in addition to the presence of edema and ascites. According to the final result, the patients are classi-fied into well nourished or malnourished.17 Current
protein intake was estimated by calculating the PNA, as previously described.18 The result in grams was
normalized to body weight (PNAn).
The BMI was calculated by dividing the dry weight by the square of the height. According to the WHO guidelines19, the cutoff point ≥ 25.0 kg/m2 was used
to classify overweight. Four skinfolds (triceps, biceps, subscapular, and suprailiac) were measured on the si-de without the arteriovenous fistula, with a calibrated plicometer (Sanny American Medical, São Bernardo do Campo, Brazil). Each skinfold was measured three times, and the final result for each was the arithme-tic mean. The percent body fat (%F) was estimated by the sum of the four skinfolds and application of the Durnin & Womersley table.20 The BF in
kilogra-ms (kg) was calculated considering the result of %F and total body weight. The reserve of lean body mass (LBM) was calculated by subtracting BF in kilograms from body weight. The nutritional status was correla-ted with markers of inflammation and of OS.
LABORATORY ANALYSIS
Venous blood samples were collected in a midweek morning before a dialysis session. Blood was centrifu-ged at 3000 G for ten minutes. The supernatant was transferred to a new tube stored at -80º C until analy-sis. Serum albumin (Alb-s) was determined through the bromocresol purple method. High sensitivity PCR (HS-PCR) was performed with nephelometry. Plasma IL-6 was analyzed by using enzyme-linked immuno-sorbent assay (ELISA, Ortho, Raritan, USA).
To assess OS, advanced oxidation protein pro-ducts (AOPP) and pentosidine were analyzed as pre-viously described.21,22 Because plasma pentosidine is
highly bound to albumin,23 its concentrations (pmol/l)
were corrected by Alb-s. That marker was expressed as plasma pentosidine content (pmol) per mg of albu-min.24 Serum 8-hydroxydeoxyguanosine (8-OHdG)
was measured by use of competitive ELISA (Japan Institute for the Control of Aging, Fukuroi, Shizuoka, Japan). The test uses the monoclonal antibody, and its normal level ranges from 0.12 to 10.0 ng/mL.25
STATISTICAL ANALYSIS
Data are shown as mean ± standard deviation (SD) or median. Values of p < 0.05 indicated statistical significance. The statistical analysis was performed other than energy storage, and secretes several
adi-pokines, such as TNF-α, IL-6, type 1 plasminogen ac-tivator inhibitor (PAI-1), PCR, resistin, and acylation stimulationstimulating protein. 12-15 In the general
po-pulation, mortality rate is known to decrease when body mass index (BMI) is low. 16 On the other hand,
in patients on hemodialysis (HD), a direct relation be-tween obesity and survival persists with a wide varia-tion in body weight. 13 In view of that, the present
stu-dy investigated the associations between nutritional status markers, such as BF, inflammatory markers, and OS markers in stable patients on chronic HD.
P
ACIENTS ANDM
ETHODSAt the beginning, 150 patients of three dialysis cen-ters in the city of Curitiba, Paraná sState, Brazil, were assessed. The inclusion criteria were as follows: age greater thanover 18 years and minimum dialysis time in the program of three months. Patients with acute inflammatory disease (systemic lupus erythemato-sus and rheumatoid arthritis), infections, malignan-ciesneoplasia, alcohol abuse, and liver diseases were excluded from the study. Considering the criteria, 40 stable patients on HD were qualified to take part in the study, which was approved by the Committee on Ethics of the Hospital Universitário Evangélico de Curitiba. Written informed consent was provided by all patients.
All patients were on HD for 3-4 hours/day, three times a week, using an arteriovenous fistula with modified cellulose membranes (cellulose acetate or cellulose derivatives). The medications used were as follows: human recombinant erythropoietin; iron sac-charate; phosphorus chelating agents with calcium; oral active vitamin D; and antihypertensive agents (beta-blockers, calcium channel blockers, furosemide, angiotensin-converting enzyme inhibitors).
NUTRITIONAL ASSESSMENT
The patients underwent a nutritional assessment 15 to 30 minutes after HD session. The nutritional as-sessment was performed by a trained nutritionist and comprised the following: dry weight (kg) (scale Filizola S/A, São Paulo, Brazil); height (cm); BMI (kg/ m2); arm circumference (AC) (cm); skinfolds (mm);
modified subjective global assessment (SGAm); and protein equivalent of nitrogen appearance (PNA).
using NCSS 2001 and PASS 2002 (Hintze J. NCSS & PASS Statistical System Kaysville, Utah). The two groups were compared by using the Student t test for normally distributed variables, or the Mann-Whitney U test or Kruskal-Wallis test for non-nor-mally distributed variables. The study of categorical variables was performed by analyzing contingency tables. Non-normally distributed variables were cor-related by using the Spearman test. For assessing the influence of explicative variables in the markers, the Fisher exact test was adopted.
R
ESULTSThe study comprised 40 patients (mean age, 52 ± 11 years; 21 males). The causes of CKRD were as follows: chronic glomerulonephritis (n = 18; 45%); hypertensive nephrosclerosis (n = 13; 32.5%); diabetic nephropathy (n = 7; 17.5%); and others (n = 2; 5%). The clinical and biochemical characteristics of the patients on HD are shown in Table 1. Approximately 63% of the patients were considered well nourished by the SGAm, and 50% had BMI ≥ 25.0 kg/m2, indicating overweight. The
Table 1 CLINICALANDBIOCHEMICALCHARACTERISTICSOFPATIENTSONCHRONICHEMODIALYSIS
Parameters Total (n = 40) Male (n = 21) Female (n = 19)
Age (years)† 52 ± 11 50 ± 10 54 ± 12
Time on dialysis (months)‡ 17.95 (3.20 - 73.70) 16,70 (3,50 - 73.70) 19.50 (3,20 - 52.10) Kt/V† 1.31 ± 0.15 1.26 ± 0.13 1.35 ± 0.16
SGAm (well nourished %) 63% 62% 63%
PNAn (g/kg/d)† 1.00 ± 0.24 0.91 ± 0.24 0.88 ± 0.18 Albumin (mg/dL)† 3.65 ± 0.35 3.70 ± 0.39 3.60 ± 0.31 IMC (kg/m2)† 25.24 ± 4.67 24.37 ± 3.01 26.20 ± 5.94 MCM (kg)† 48.67 ± 9.50 54.69 ± 7.58 42.01 ± 6.53* GC (kg)‡ 16.20 (5.30 - 36.70) 13.10 (5.30 - 23.20) 20.80 (6.40 - 36.70)* PCRas (mg/L)‡ 3.40 (0.10 - 97.80) 2.80 (0.10 - 31.60) 3.70 (0.10 - 97.80) IL-6 (pmol/L)‡ 2.65 (0.40 - 10.80) 2,50 (0,40 - 6,30) 3.20 (1.50 - 10.80)
PPOA (µmol/L)‡ 145.26 (87.01 - 368.38) 144.47 (87.01 - 368.38) 151.18 (100.91 - 256.09) 8OHdG (pmol/L)‡ 0.44 (0.13 - 0.75) 0.45 (0.22 - 0.75) 0.43 (0.13 - 0.65) Pentosidine/Albumin (pmol/mg)† 541.16 ± 248.18 561.82 ± 246.59 518.33 ± 254.64
† Values expressed as mean ± SD; parametric Student t test
‡ Values expressed as median and variation; nonparametric Mann-Whitney test
* p < 0,05; Kt/V: calculation of urea kinetics; SGAm: modifi ed subjective global assessment; PNAn: normalized protein equivalent of nitrogen appearance; BMI: body mass index; LBM: lean body mass; BF: body fat; HS-PCR: high-sensitivity protein C-reactive; IL-6: interleukine-6; AOPP: advanced oxidation protein products; 8OHdG: 8-hydroxydeoxyguanosine.
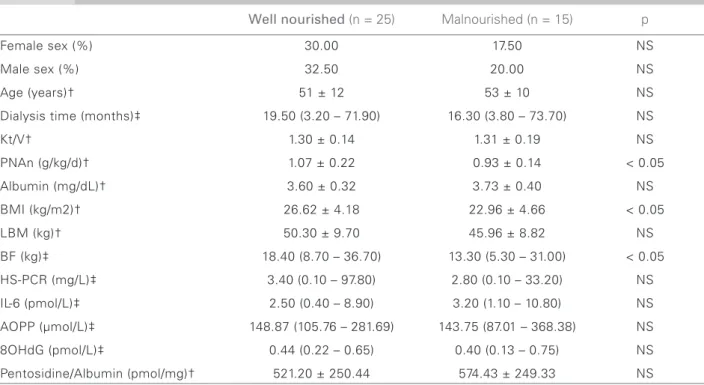
patients classified as malnourished by SGAm had a mean BMI and median BF significantly lower than those in the well-nourished group (Table 2). The group of patients with BMI ≥ 25.0 kg/m2 had
a median BF significantly higher than that with BMI < 25.0 kg/m2 (Table 3).
No correlation was found between the nutritio-nal markers of malnutrition. However, a positive and significant correlation was found between BMI and BF (R = 0.78; p = 0.001), BMI and HS-PCR (R = 0.37; p = 0.02), and between BF and HS-PCR (R = 0.32; p = 0.04) (Figure 1). Male patients had a positive and significant correlation between BMI
and HS-PCR (R = 0.54; p = 0.01), and between BF and HS-PCR (R = 0.52; p = 0.01) (Figure 1). Those associations were not found in the female group.
Table 2 CLINICALANDBIOCHEMICALCHARACTERISTICSACCORDINGTOTHE SUBJECTIVE GLOBAL ASSESSMENT
Well nourished (n = 25) Malnourished (n = 15) p
Female sex (%) 30.00 17.50 NS
Male sex (%) 32.50 20.00 NS
Age (years)† 51 ± 12 53 ± 10 NS
Dialysis time (months)‡ 19.50 (3.20 – 71.90) 16.30 (3.80 – 73.70) NS
Kt/V† 1.30 ± 0.14 1.31 ± 0.19 NS
PNAn (g/kg/d)† 1.07 ± 0.22 0.93 ± 0.14 < 0.05
Albumin (mg/dL)† 3.60 ± 0.32 3.73 ± 0.40 NS
BMI (kg/m2)† 26.62 ± 4.18 22.96 ± 4.66 < 0.05
LBM (kg)† 50.30 ± 9.70 45.96 ± 8.82 NS
BF (kg)‡ 18.40 (8.70 – 36.70) 13.30 (5.30 – 31.00) < 0.05
HS-PCR (mg/L)‡ 3.40 (0.10 – 97.80) 2.80 (0.10 – 33.20) NS
IL-6 (pmol/L)‡ 2.50 (0.40 – 8.90) 3.20 (1.10 – 10.80) NS
AOPP (µmol/L)‡ 148.87 (105.76 – 281.69) 143.75 (87.01 – 368.38) NS
8OHdG (pmol/L)‡ 0.44 (0.22 – 0.65) 0.40 (0.13 – 0.75) NS
Pentosidine/Albumin (pmol/mg)† 521.20 ± 250.44 574.43 ± 249.33 NS † Values expressed as mean ± SD; parametric Student t test
‡ Values expressed as median and variation; nonparametric Mann-Whitney test
Kt/V: calculation of urea kinetics; PNAn: normalized protein equivalent of nitrogen appearance; BMI: body mass index; LBM: lean body mass; BF: body fat; HS-PCR: high-sensitivity protein C-reactive; IL-6: interleukine-6; AOPP: advanced oxidation protein products; 8OHdG: 8-hydroxydeoxyguanosine.
Table 3 CLINICALANDBIOCHEMICALCHARACTERISTICSACCORDINGTOBODYMASSINDEX.
IMC < 25,00 kg/m2 IMC ≥ 25,00 kg/m2 p
(n = 20) (n = 20)
Age (years)† 51 ± 12 52 ± 10 NS
Dialysis time (months)‡ 14.15 (3.20 – 73.70) 19.50 (3.20 – 71.90) NS
Kt/V† 1.35 ± 0.17 1.26 ± 0.12 NS
PNAn (g/kg/d)† 1.04 ± 0.22 0.99 ± 0.19 NS Albumin (mg/dL)† 3.65 ± 0.39 3.64 ± 0.31 NS LBM (kg)† 45.74 ± 9.66 51.60 ± 8.61 NS BF (kg)‡ 12.85 (5.30 – 20.80) 25.55 (9.80 – 36.7) < 0.05 HS-PCR (mg/L)‡ 2.25 (0.10 – 33.20) 4.80 (0.20 – 97.80) NS IL-6 (pmol/L)‡ 2.50 (0.40 – 10.80) 2.80 (1.10 – 8.90) NS AOPP (µmol/L)‡ 150.03 (87.01 – 368.38) 142.46 (100.91 – 281.69) NS 8OHdG (pmol/L)‡ 0.48 (0.28 – 0.75) 0.42 (0.13 – 0.62) NS Pentosidine/Albumin (pmol/mg)† 604.30 ± 268.02 478.03 ± 214.95 NS † Values expressed as mean ± SD; parametric Student t test
‡ Values expressed as median and variation; nonparametric Mann-Whitney test
D
ISCUSSIONIn the present study, the most significant finding was the correlation of BMI and BF with HS-PCR, espe-cially in male patients on HD. Thus, inflammation seems to be more correlated with excessive fat and body weight than their deficiency, and differences in the inflammatory response between the sexes seem to coexist. On the other hand, oxidative stress appa-rently has no close relation to the routine markers of malnutrition or overweight. Recent studies have shown an association of BMI and BF with inflam-matory markers.26,27 High BF apparently activates
the inflammatory cascade. In fact, the adipose tis-sue is complex, with functions that go beyond the simple storage of energy. It is an active system that secretes several adipokines (TNF-α, IL-6, IPA-1, PCR, resistin, and PEA) that contribute to systemic inflammation.14,15,28 In a cross-sectional analysis of
the MDRD (Modification of Diet in Renal Disease) study, a positive correlation was found between PCR and BMI28 in patients in the pre-dialysis phase. In
that study, patients with high BMI and PCR had a higher prevalence of cardiovascular disease (CVD). Additionally, Beddhu et al.29, analyzing 70,028
pa-tients on dialysis, have shown that a BMI elevated due to an increase in BF was correlated with an increase in the prevalence of atherosclerosis, and, subsequen-tly, with an increase in mortality. This shows that traditional risk factors for CVD, such as overweight, are relevant in the population with CKRD.29
More recently, the distribution of BF has been suggested as another important aspect. In the pre-sent study, the positive correlation of BF and BMI with HS-PCR has been found only in men. The re-asons for that are not clear, but, depending on the location of the adipose tissue, distinctions in the endocrine and metabolic functions may be found. Visceral fat has already been known to be more common in male patients.30 Metabolic disorders and
CVD are associated with visceral fat, but not with subcutaneous deposits.30 In patients with CKRD,
Axelsson et al.14 have shown that the visceral fat in
the trunk is a metabolically active deposit and may be the key-factor for developing resistance to insulin and premature atherosclerosis. According to Fried
et al. 31, the omental adipose tissue produces three
times more IL-6 than the subcutaneous adipose tis-sue. It has been proposed that adipose cells of seve-ral regions have different origins, and, thus, express different genes, such as leptin, TNF-α, angiotensi-nogen, and IPA-1.32 The mechanisms responsible
for the differences in storage in the adipose tissue are still unknown, and further studies are required to investigate those findings.
Modified global subjective assessment is a re-liable tool for assessing early malnutrition.33 In our
study, patients classified as malnourished according to SGAm had significantly lower values of BMI and BF, which would be expected. However, analyzing the results that reflect the PNAn of the patients, as-sociations of that marker of malnutrition with ma-rkers of inflammation and of OS could not be found. As previously shown in Brazilian patients on HD 34,
associations between markers of malnutrition and of inflammation coexist, but are not necessarily inter-related in patients with CKRD. Pupim et al.35 have
reported that nutritional markers were independen-tly associated with mortality despite the presence of inflammation. Thus, malnutrition, inflammation, and OS have been suggested to be independent risk factors for mortality, but they frequently coincide.
The lack of correlation between the markers of nutrition, inflammation, and OS could be partially explained by the susceptibility of OS markers to other variables, such as antioxidant food intake.36
The reduction in vitamin levels, mainly the hydro-soluble ones, may occur due to restrictive diets in an attempt to avoid hyperkalemia. Another expla-nation is that the majority of our patients had nor-mal levels of albumin and were not nor-malnourished. Danielski et al.37 have shown that the levels of
ma-rkers of inflammation and of OS were increased in patients with hypoalbuminemia as compared wi-th wi-those of normoalbuminemic patients. Similarly, Stenvinkel et al.38, using plasmalogen as a marker of
OS, have shown that malnourished patients on HD had an increase in OS as compared with the properly nourished group. Therefore, the lack of association between inflammation and OS may be influenced by the low prevalence of malnutrition, as well as by the antioxidant effect of albumin.
Although several other studies have shown an associa-tion between inflammatory markers and OS in patients with CKRD 10,39,40, the present study has not found the
C
ONCLUSIONIn conclusion, the present study suggests that mal-nutrition is not necessarily associated with inflam-mation and with OS in patients on HD. However, the association between BF and inflammation in the male population may indicate a difference in the in-flammatory response between sexes, which should be confirmed with controlled studies involving a lar-ger number of patients
R
EFERENCES1. Qureshi AR, Alvestrand A, Divino-Filho JC et al. Inflammation, malnutrition, and cardiac disease as pre-dictors of mortality in hemodialysis patients. J Am Soc Nephrol 2002; 13(Suppl1):S28-36.
2. Kaysen GA, Dubin JA, Muller HG, Mitch WE, Rosales LM, Levin NW. Relationships among inflammation nutrition and physiologic mechanisms establishing al-bumin levels in hemodialysis patients. Kidney Int 2002; 61:2240-9.
3. Axelsson J, Heimburger O, Lindholm B, Stenvinkel P. Adipose tissue and its relation to inflammation: the role of adipokines. J Ren Nutr 2005; 15:131-6.
4. Pecoits-Filho R, Lindholm B, Stenvinkel P. The mal-nutrition, inflammation, and atherosclerosis (MIA) syndrome – the heart of the matter. Nephrol Dial Transplant 2002; 17(Suppl11):28-31.
5. Locatelli F, Canaud B, Eckardt KU, Stenvinkel P, Wanner C, Zoccali C. Oxidative stress in end-stage renal disease: an emerging threat to patient outcome. Nephrol Dial Transplant 2003; 18:1272-80.
6. Stenvinkel P, Heimburger O, Paultre F et al. Strong association between malnutrition, inflammation, and atherosclerosis in chronic renal failure. Kidney Int 1999; 55:1899-911.
7. Pereira BJ, Shapiro L, King AJ, Falagas ME, Strom JA, Dinarello CA. Plasma levels of IL-1 beta, TNF alpha and their specific inhibitors in undialyzed chronic renal failure, CAPD and hemodialysis patients. Kidney Int 1994; 45:890-6.
8. Kimmel PL, Phillips TM, Simmens SJ et al. Immunologic function and survival in hemodialysis patients. Kidney Int 1998; 54:236-44.
9. Plata-Salaman CR. Cytokines and anorexia: a brief overview. Semin Oncol 1998; 25(Suppl1):64-72. 10. Handelman GJ, Walter MF, Adhikarla R et al. Elevated
plasma F2-isoprostanes in patients on long-term hemo-dialysis. Kidney Int 2001; 59:1960-6.
11. Beddhu S. The body mass index paradox and an obe-sity, inflammation, and atherosclerosis syndrome in chronic kidney disease. Semin Dial 2004; 17:229-32. 12. Folsom AR, Pankow JS, Tracy RP et al. Association of
C-reactive protein with markers of prevalent atheros-clerotic disease. Am J Cardiol 2001; 88:112-7.
13. Hakim RM, Lowrie E. Obesity and mortality in ESRD: is it good to be fat? Kidney Int 1999; 55:1580-1. 14. Axelsson J, Rashid Qureshi A, Suliman ME et al. Truncal
fat mass as a contributor to inflammation in end-stage renal disease. Am J Clin Nutr 2004; 80:1222-9.
15. Mohamed-Ali V, Goodrick S, Rawesh A et al. Subcutaneous adipose tissue releases interleukin-6, but not tumor necrosis factor-alpha, in vivo. J Clin Endocrinol Metab 1997; 82:4196-200.
16. Calle EE, Thun MJ, Petrelli JM, Rodriguez C, Heath CW Jr. Body-mass index and mortality in a prospective cohort of U.S. adults. N Engl J Med 1999; 341:1097-105.
17. Kalantar-Zadeh K, Kleiner M, Dunne E, Lee GH, Luft FC. A modified quantitative subjective global asses-sment of nutrition for dialysis patients. Nephrol Dial Transplant 1999; 14:1732-8.
18. Clinical practice guidelines for nutrition in chronic re-nal failure. K/DOQI, Natiore-nal Kidney Foundation. Am J Kidney Dis 2000; 35(6Suppl2):S1-140.
19. Physical status: the use and interpretation of anthro-pometry. Report of a WHO Expert Committee. World Health Organ Tech Rep Ser 1995; 854:1-452.
20. Durnin JV, Womersley J. Body fat assessed from total body density and its estimation from skinfold thickness: measurements on 481 men and women aged from 16 to 72 years. Br J Nutr 1974; 32:77-97.
21. Witko-Sarsat V, Friedlander M, Capeillere-Blandin C et al. Advanced oxidation protein products as a novel marker of oxidative stress in uremia. Kidney Int 1996; 49:1304-13.
22. Suliman ME, Heimburger O, Barany P et al. Plasma pentosidine is associated with inflammation and mal-nutrition in end-stage renal disease patients starting on dialysis therapy. J Am Soc Nephrol 2003; 14:1614-22. 23. Miyata T, Ueda Y, Shinzato T et al. Accumulation of
albumin-linked and free-form pentosidine in the circu-lation of uremic patients with end-stage renal failure: renal implications in the pathophysiology of pentosidi-ne. J Am Soc Nephrol 1996; 7:1198-206.
24. Miyata T, Ishiguro N, Yasuda Y et al. Increased pen-tosidine, an advanced glycation end product, in plas-ma and synovial fluid from patients with rheuplas-matoid arthritis and its relation with inflammatory markers. Biochem Biophys Res Commun 1998; 244:45-9. 25. Toyokuni S, Tanaka T, Hattori Y et al. Quantitative
immunohistochemical determination of 8-hydroxy-2’-deoxyguanosine by a monoclonal antibody N45.1: its application to ferric nitrilotriacetate-induced renal car-cinogenesis model. Lab Invest 1997; 76:365-74. 26. Forouhi NG, Sattar N, McKeigue PM. Relation of
C-reactive protein to body fat distribution and featu-res of the metabolic syndrome in Europeans and South Asians. Int J Obes Relat Metab Disord 2001; 25:1327-31.
27. Pannacciulli N, Cantatore FP, Minenna A, Bellacicco M, Giorgino R, De Pergola G. C-reactive protein is in-dependently associated with total body fat, central fat, and insulin resistance in adult women. Int J Obes Relat Metab Disord 2001; 25:1416-20.
28. Menon V, Wang X, Greene T et al. Relationship be-tween C-reactive protein, albumin, and cardiovascular disease in patients with chronic kidney disease. Am J Kidney Dis 2003; 42:44-52.
30. Kissebah AH, Krakower GR. Regional adiposity and morbidity. Physiol Rev 1994; 74:761-811.
31. Fried SK, Bunkin DA, Greenberg AS. Omental and subcutaneous adipose tissues of obese subjects release interleukin-6: depot difference and regulation by gluco-corticoid. J Clin Endocrinol Metab 1998; 83:847-50. 32. Arner P. Not all fat is alike. Lancet 1998; 351:1301-2. 33. Jones CH, Newstead CG, Will EJ, Smye SW, Davison
AM. Assessment of nutritional status in CAPD patients: serum albumin is not a useful measure. Nephrol Dial Transplant 1997; 12:1406-13.
34. Nascimento MM, Pecoits-Filho R, Qureshi AR et al. The prognostic impact of fluctuating levels of C-reactive protein in Brazilian haemodialysis patients: a prospecti-ve study. Nephrol Dial Transplant 2004; 19:2803-9. 35. Pupim LB, Caglar K, Hakim RM, Shyr Y, Ikizler TA.
Uremic malnutrition is a predictor of death independent of inflammatory status. Kidney Int 2004; 66:2054-60. 36. Descamps-Latscha B, Drueke T, Witko-Sarsat V.
Dialysis-induced oxidative stress: biological aspects, clinical consequences, and therapy. Semin Dial 2001; 14:193-9.
37. Danielski M, Ikizler TA, McMonagle E et al. Linkage of hypoalbuminemia, inflammation, and oxidative stress in patients receiving maintenance hemodialysis therapy. Am J Kidney Dis 2003; 42:286-94.
38. Stenvinkel P, Holmberg I, Heimburger O, Diczfalusy U. A study of plasmalogen as an index of oxidative stress in patients with chronic renal failure. Evidence of incre-ased oxidative stress in malnourished patients. Nephrol Dial Transplant 1998; 13:2594-600.
39. Himmelfarb J, Stenvinkel P, Ikizler TA, Hakim RM. The elephant in uremia: oxidant stress as a unifying concept of cardiovascular disease in uremia. Kidney Int 2002; 62:1524-38.