Luana Costa Bastos(a)
Paulo Sérgio Flores Campos(a) Flávia Maria de Moraes Ramos-Perez(b)
Andrea dos Anjos Pontual(c) Solange Maria Almeida(d)
(a) Department of Oral and Maxillofacial Radiology, School of Dentistry, Universidade Federal da Bahia - UFBA, Salvador, BA, Brazil.
(b) Departament of Clinical and Preventive Dentistry, School of Dentistry, Universidade Federal de Pernambuco - UFPE, Recife, PE, Brazil.
(c) Department of Oral Radiology, School of Dentistry, Universidade Federal de Pernambuco - UFPE, Camaragibe, PE, Brazil.
(d) Department of Oral Radiology, School of Dentistry of Piracicaba, Universidade Estadual de Campinas - Unicamp, Piracicaba, SP, Brazil.
Corresponding Author: Luana Costa Bastos
E-mail: [email protected]
Evaluation of condyle defects using
different reconstruction protocols of
cone-beam computed tomography
Abstract: This study was conducted to investigate how well cone-beam computed tomography (CBCT) can detect simulated cavitary defects in condyles, and to test the inluence of the reconstruction protocols. De-fects were created with spherical diamond burs (numbers 1013, 1016, 3017) in superior and / or posterior surfaces of twenty condyles. The con-dyles were scanned, and cross-sectional reconstructions were performed with nine different protocols, based on slice thickness (0.2, 0.6, 1.0 mm) and on the ilters (original image, Sharpen Mild, S9) used. Two observers evaluated the defects, determining their presence and location. Statisti-cal analysis was carried out using simple Kappa coeficient and McNe-mar’s test to check inter- and intra-rater reliability. The chi-square test was used to compare the rater accuracy. Analysis of variance (Tukey’s test) assessed the effect of the protocols used. Kappa values for inter- and intra-rater reliability demonstrate almost perfect agreement. The propor-tion of correct answers was signiicantly higher than that of errors for cavitary defects on both condyle surfaces (p < 0.01). Only in identifying the defects located on the posterior surface was it possible to observe the inluence of the 1.0 mm protocol thickness and no ilter, which showed a signiicantly lower value. Based on the results of the current study, the technique used was valid for identifying the existence of cavities in the condyle surface. However, the protocol of a 1.0 mm-thick slice and no ilter proved to be the worst method for identifying the defects on the posterior surface.
Descriptors: Mandibular Condyle; Bone Diseases; Cone-Beam Computed Tomography; Image Enhancement.
Introduction
Most pathological conditions affecting the temporomandibular joint (TMJ) cause changes that begin in the covering soft tissue and may prog-ress to involve the bones. In the case of the condyles, erosions—ranging from minor injuries (cavitary defects) to the complete absence of condyle regions— are one of the most common degenerative changes observed in radiographs, second only to lattening.1-3
Cavitary defects represent the initial stage of degenerative changes, indicating that TMJ is unstable, and that changes in bone surfaces are occurring. Radiographically, TMJ is described as a focal area with re-duced density of the cortical and / or subjacent medullary bones. Erosions
Declaration of Interests: The authors certify that they have no commercial or associative interest that represents a conflict of interest in connection with the manuscript.
Submitted: Apr 03, 2013
Accepted for publication: Jul 31, 2013 Last revision: Aug 17, 2013
can develop, compromising condylar structures, re-ducing joint space, causing anterior open bite and, in some cases, ankylosis.4
Imaging exams are extremely important for early detection of erosions, since these may be the irst local manifestation of certain serious systemic conditions (i.e. rheumatoid arthritis). The earlier the diagnosis and implementation of an appropri-ate treatment plan, the more favorable the patient’s prognosis, by obviating major sequelae and ensuring quality of life.4 Minimal overlapping joint images
are required to detect these lesions precisely. Some studies conclude in favor of conventional tomogra-phy, whereas others recommend multislice comput-ed tomography (MSCT), but there is still no agree-ment about what technique should be established as the gold standard.5-7
Cone beam computed tomography (CBCT), a technology based on the volumetric rendering of an area of interest, has been used in many countries to evaluate these changes. Similar to the MSCT, the CBCT offers post-processing possibilities for the images in which some parameters may be changed (i.e., slice thickness, ilter application, etc.) to im-prove image quality without having to expose the patient again.6
Slice thickness may vary greatly depending on the equipment and the commercially available soft-ware.7 The correct choice of what thickness should
be used must take into account the evaluated ana-tomical structure and the suspected diagnosis.8
The inluence of ilters in reducing the noise of digital radiographic images has been studied exten-sively in regard to ability of the ilters to detect in-terproximal bone loss, carious lesions and root frac-tures.9-11 Filters are computational resources that
work through algorithmic operations, determining changes in the image characteristics (i.e., enhance-ment or smoothing of the grayscale).11,12
There is a lack of studies in the literature on the combined inluence of slice thickness and ilters on CBCT exams. Therefore, the aim of this study was to compare the ability of different reconstruction protocols (varying thicknesses and types of ilter) of CBCT images in detecting artiicially produced cavitary bone defects in the mandibular condyle.
Methodology
This prospective study was reviewed and ap-proved by the Research Ethics Committee of the School of Dentistry of Piracicaba, Universidade Es-tadual de Campinas - Unicamp (#169/2009). CBCT scans of ten dry human mandibles (not discriminat-ed by gender and with an average age estimatdiscriminat-ed at 40 years) with twenty sound condyles (without cavi-tary defects of any kind) were included in this study. Twenty defects were randomly produced in superior (10) and posterior (10) surfaces of the condyles, in-volving only cortical or both the cortical and the medullary bone, for the purpose of simulating the various stages of degenerative joint disease.13 The
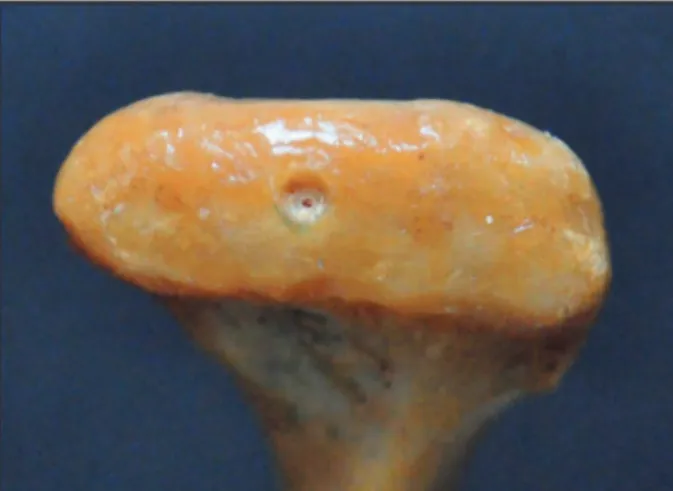
defects were produced using three different sizes of spherical diamond burs (KG Sorensen, Cotia, Bra-zil) mounted in a high-speed dental handpiece. The lesions produced had approximately the diameter of the burs used (1.2 mm, 1.8 mm and 2.5 mm, respec-tively) and the depth of each was equal to half of its diameter (0.6 mm, 0.9 mm and 1.25 mm, respec-tively). In each condyle, either one or two defects of different or the same diameter were made, or else no defect at all was introduced (Figure 1).
The mandibles were immersed in a Styrofoam box illed with water and positioned in the cephalo-stat of the i-CAT CBCT scanner (Imaging Sciences
International, Hatield, USA) simulating an in vivo
position (i.e., slightly angled on a horizontal plane), using the following acquisition protocol: 120 kV,
an average value for a group of pixels, and redistrib-uting the density mean among the pixels, resulting in an image that has more uniform gray tones and is less granular.
The interpretation was carried out in two ses-sions with a ifteen day interval, and the images were presented randomly. The observers had to de-tect and locate (on superior or posterior surfaces) the bone defects. The gold standard was the macro-scopic inspection of condyle defects.
The statistical analysis was carried out using SAS software (release 9.2 - TS Level 2M0; SAS Institute Inc., Cary, USA). The following tests were applied:
• Kappa coeficients and McNemar’s test (to check inter- and intra-rater reliability),
• chi-square test (to compare the accuracy rates) and
• Tukey’s test (analysis of variance, to contemplate the effect of the protocols used), with a signii-cance level of 5% (p = 0.05).
Results
Inter-rater reliability showed values greater than 0.8654, which indicate almost perfect agreement between the observers or raters, in both the irst and second session. Additionally, there was no signii-cant difference between the observations (Table 1).
Regarding the intra-rater reliability, when com-paring the responses given by Observer 2 for the identiication of defects on the posterior surface, there was a complete absence of discordant pairs, 36.12 mAs, ield of view of 6 cm, 512 × 512 matrix,
voxel size of 0.25 mm and acquisition time of 40 s. An independent workstation running Xoran-Cat software (version 3.1.62, Xoran Technologies, Ann Arbor, USA) was used to select the multiplanar reconstruction (MPR) display mode, according to the following procedure: based on an axial image, the reconstructions were set perpendicular to the long axis of the condyle to generate the cross-sec-tional images. The following slice thicknesses were then selected for the cross-sectional reconstructions:
• thin (0.2 mm),
• medium (0.6 mm), or
• thick (1.0 mm).
The cross-sectional slices were saved in XSTD format and blindly evaluated individually by two oral and maxillofacial radiologists, with over ive years of CBCT experience. Evaluation was con-ducted under dim light, in a workstation with a 22” lat-screen monitor (Dell Precision 390, Dell Inc., Round Rock, USA) using XoranCat software, which allows manipulating brightness and contrast, following nine different reconstruction protocols (Figure 2). Two ilters that work distinctly were se-lected. The Sharpen Mild ilter (an enhancement ilter) intensiies density level differentiation (gray tones). This makes the boundaries more evident and the bone structure images clearer to see, ultimately allowing better assessment in certain cases. The S9
ilter (a smoothing ilter) acts uniformly, calculating
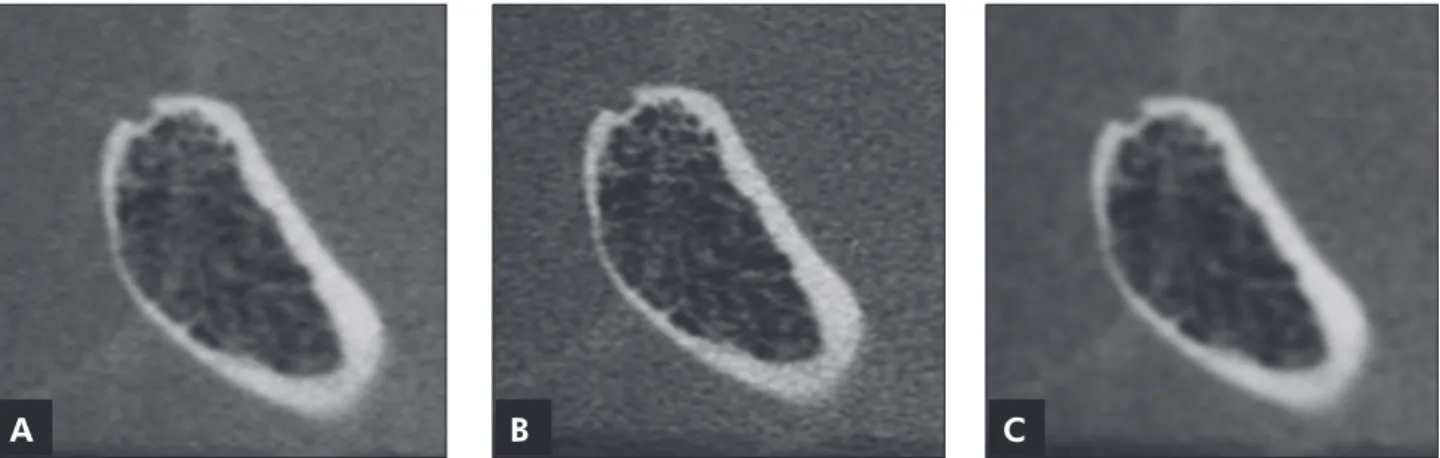
Figure 2 - Cross-sectional slices of the condyle in Figure 1 reconstructed in protocols 1, 2 and 3: (A) 0.2 mm-thick section and no filter; (B) 0.2 mm-thick section and Sharpen Mild filter; (C) 0.2 mm-thick section and S9 filter.
thus indicating perfect agreement between the ses-sions. Observer 1 values suggested an almost perfect agreement for the identiication of defects on both surfaces (Table 2).
Table 3 shows the number of images that were correctly associated with the presence or absence of defects. There was strong evidence that the propor-tion of correct answers was signiicantly higher than the proportion of errors observed for the two sur-faces.
Taking into account only the correct observa-tions, Table 4 shows the conditions used in the anal-ysis of variance and the parameters used to evaluate whether or not the observer responses were inlu-enced by the application of the protocols. Strong sig-niicant evidence of the effect of the protocol used was detected only for the defects properly identiied on the posterior surface. Therefore, we applied the
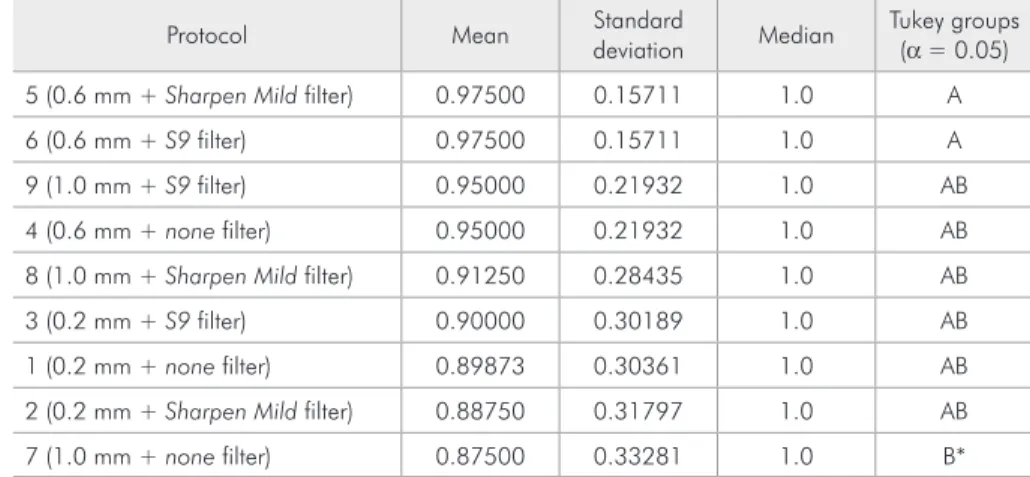
Tukey test for multiple comparisons of means. The highest means were observed in Protocols 5 and 6, and a statistical difference was found only for those of Protocol 7, which had the lowest means (Table 5).
Discussion
In assessing the accuracy of defect identiica-tion, we found a signiicantly higher proportion of hits on both surfaces, as did Cara et al.14 and Utumi
et al.13 when employing MSCT to identify
simulat-ed cavitary defects. Cara et al.14 simulated defects,
about 1 mm in diameter, in mandibular condyles, and the MSCT and single slice CT images that they obtained were evaluated in different reconstruction protocols, taking into account the orientation of the slices generated (axial slices × MPR images). The greatest sensitivity in identifying defects was found for MSCT MPRs. Later, Utumi et al.13 also
evalu-ated defects, but, as already mentioned, they used three sizes of diamond burs. They compared the
Session Defect
surface
McNemar’s test Simple Kappa coefficient
Statistic p-value Kappa Confidence interval (95%)
1 Superior 3.5714 0.0588 0.9218 0.8650 0.9785
1 Posterior 3.000 0.0833 0.8654 0.7920 0.9388
2 Superior 2.6667 0.1025 0.9333 0.8809 0.9857
2 Posterior 1.3333 0.2482 0.8661 0.7930 0.9392
Observer Defect surface
McNemar’s test Simple Kappa coefficient
Statistic p-value Kappa Confidence interval (95%)
1 Superior 0.0000 1.0000 0.9777 0.9469 1.0000
1 Posterior 1.0000 0.3173 0.9549 0.9112 0.9986
2 Superior 0.3333 0.5637 0.9665 0.9290 1.0000
2 Posterior – – 1.0000 1.0000 1.0000
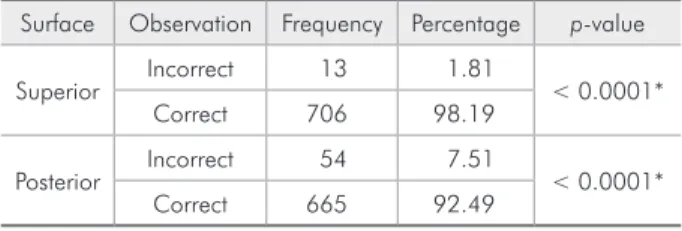
Table 3 - Frequency and percentage of correct observations in determining the defects in the images, and chi-square test for equality of proportions.
Surface Observation Frequency Percentage p-value
Superior Incorrect 13 1.81 < 0.0001*
Correct 706 98.19
Posterior Incorrect 54 7.51 < 0.0001*
Correct 665 92.49
* Statistically significant value.
Table 4 - Analysis of variance results of the variables ana-lyzed to determine the effects of the protocols used.
Surface Response
distribution
Statistical
adjustment p-value
Superior Gaussian −1071.35 0.6888
Posterior Gaussian −195.87 0.0003*
* Statistically significant value. Table 1 - Inter-rater reliability
results.
traditional projections (coronal, axial and sagittal) with cross-sectional images, and obtained a sensi-tivity of 100% for identifying defects on the upper surface, using cross-sectional images.
Regarding studies comparing CBCT with other imaging modalities, we agree with the study results of Honda et al.7 and Honey et al.6 The reliability of
diagnoses made by CBCT and MSCT in detecting erosions, osteophytes and sclerosis of the condyles was evaluated by Honda et al.,7 who found
favor-able results for CBCT when used for this purpose. Honey et al.6 observed CBCT bone defects on the
lateral surface of dry condyles and compared the re-sults with those obtained by other imaging modali-ties (panoramic radiography, conventional tomogra-phy and TMJ-speciic panoramic projection). They found that CBCT accuracy was statistically higher than that of all other techniques. Only one study, by Hintze et al.,15 found low values for CBCT
sensitiv-ity in identifying natural defects in dry mandibles (bone defects, lattening and osteophytes); however, since there was no statistical difference between CBCT and conventional tomography, it was con-cluded that CBCT was more indicated, due to the aforementioned advantages. In our study, cavitary defects were created to simulate erosion lesions, and the images were evaluated in nine reconstruction protocols, using various slice thicknesses and apply-ing different ilters. The higher proportion of images correctly associated with the presence or absence of defects corroborate the qualiication of CBCT as a
method of identifying these cavitary defects.
Some studies showed perfect intra-rater reliabil-ity for diagnosing cavitary lesions by CBCT, com-pared with other imaging modalities, such as cor-rected conventional tomography,15 conventional and
TMJ-speciic panoramic projections and conven-tional tomography.6 In our study, both intra- and
in-ter-rater reliability yielded excellent results in identi-fying defects in the superior and posterior surfaces of the condyles.
Regarding the inluence played by thickness, Per-rela et al.8 compared MSCT images having 1.0 mm
and 3.0 mm slice thickness (and the same interval between the slices), and observed that detection sen-sitivity and speciicity of simulated defects in the body of the mandible were better in thinner slices. This is because some defects were extremely small and could go unnoticed in the 3.0 mm slices (par-tial volume effect). In the present research, the worst statistically signiicant result in identifying posterior surface defects was found in a protocol with the thickest slice used (1.0 mm), although all the de-fects were greater than the slice thickness used. On the other hand, it was expected that the best results would be found with thinner slices (0.2 mm); how-ever, this was not the case. One possible explanation could be that, although very thin slices may increase diagnostic accuracy, they add considerable noise to the image and this may hinder the evaluation signii-cantly.16
The role of the ilters in diagnosing simulated
Protocol Mean Standard
deviation Median
Tukey groups (α = 0.05)
5 (0.6 mm + Sharpen Mild filter) 0.97500 0.15711 1.0 A
6 (0.6 mm + S9 filter) 0.97500 0.15711 1.0 A
9 (1.0 mm + S9 filter) 0.95000 0.21932 1.0 AB
4 (0.6 mm + none filter) 0.95000 0.21932 1.0 AB
8 (1.0 mm + Sharpen Mild filter) 0.91250 0.28435 1.0 AB
3 (0.2 mm + S9 filter) 0.90000 0.30189 1.0 AB
1 (0.2 mm + none filter) 0.89873 0.30361 1.0 AB
2 (0.2 mm + Sharpen Mild filter) 0.88750 0.31797 1.0 AB
7 (1.0 mm + none filter) 0.87500 0.33281 1.0 B*
Protocols with same letters in the Tukey group row indicate that means do not differ. * Statistically significant value. Table 5 - Comparison of mean
external root resorption was studied by Vaz et al.12
The results for sensitivity, accuracy and negative predictive values were better for the enhancement ilter (Sharpen 3 × 3) than the smoothing ilters (S9, Smooth and Smooth 3 × 3), also used. One possible explanation given by the authors is that enhanced ilters have good delineation of anatomic limits. In agreement with our results, the protocols using the enhancement ilter (Sharpen Mild) presented the best results in identifying the defects on the poste-rior surface.
The post-processing possibilities of CBCT im-ages may contribute signiicantly to the diagnostic capabilities of this exam. However, with no substan-tial clinical and scientiic basis, the use of these re-sources may give rise to misinterpretation, and thus compromise the patient’s treatment plan. Finally, attention should be given to the in vitro character of this and most of the studies mentioned, and even
more so to the fact that certain in vivo conditions cannot be perfectly reproduced in the laboratory. Thus, we suggest that the results of this research work should be applied under clinical conditions, thereby conirming and establishing the correspon-dence between in vitro and in vivo indings.
Conclusions
Based on the results of the current study, all pro-tocols proposed have proved suitable for the iden-tiication of cavitary defects in the superior surface of the mandibular condyle. However, the protocol of a 1.0 mm-thick slice and no ilter proved to be the worst for identifying the defects on the posterior surface.
Acknowledgements
The authors wish to thank Professor Marcelo Alves, PhD, for carrying out the statistical analysis.
References
1. Berni Neto RC, Freitas C, Gouveia AT, Fenyo-Pereira M, Bolzan M. [TMJ: study of the osseous abnormalities ocurrence by linear tomography]. Rev ABRO. 2003 Jul-Dec;4(2):81-4. Portuguese.
2. Alexiou KE, Stamatakis HC, Tsiklakis K. Evaluation of the severity of temporomandibular joint osteoarthritic changes related to age using cone beam computed tomography. Den-tomaxillofac Radiol. 2009 Mar;38(3):141-7. DOI: 10.1259/ dmfr/59263880.
3. Larheim TA, Dale K, Tveito L. Radiographic abnormali-ties of the temporomandibular joint in children with juve-nile rheumatoid arthritis. Acta Radiol Diagn (Stockh). 1981 May;22(3A):277-84.
4. Santos LAN, Campos PSF, Paula AMP, Martelli Júnior H, Melo Filho MR. [Image of juvenile idiopathic arthritis in mandibular condyle – case report]. Rev ABRO. 2005 Jan-Jun;6(1):29-34. Portuguese.
5. Hussain AM, Packota G, Major PW, Flores-Mir C. Role of different imaging modalities in assessment of temporo-mandibular joint erosions and osteophytes: a systematic re-view. Dentomaxillofac Radiol. 2008 Feb;37(2):63-71. DOI: 10.1259/dmfr/16932758.
6. Honey OB, Scarfe WC, Hilgers MJ, Klueber K, Silveira AM, Haskell BS, et al. Accuracy of cone-beam computed tomog-raphy imaging of the temporomandibular joint: comparisons with panoramic radiology and linear tomography. Am J Or-thod Dentofacial Orthop. 2007 Oct;132(4):429-38.
7. Honda K, Larheim TA, Maruhashi K, Matsumoto K, Iwai K. Osseous abnormalities of the mandibular condyle: diagnostic reliability of cone beam computed tomography compared with helical computed tomography based on an autopsy material. Dentomaxillofac Radiol. 2006 May;35(3):152-7.
8. Perrella A, Borsatti MA,Tortamano IP, Rocha RG, Cavalcanti MG. Validation of computed tomography protocols for simu-lated mandibular lesions: a comparison study. Braz Oral Res. 2007 Apr-Jun;21(2):165-9.
9. Eickholz P, Riess T, Lenhard M, Hassfeld S, Staehle HJ. Digi-tal radiography of interproximal bone loss; validity of dif-ferent filters. J Clin Periodontol. 1999 May;26(5):294-300. 10. Haiter-Neto F, Pontual AA, Frydenberg M, Wenzel A.
De-tection of non-cavitated approximal caries lesions in digital images from seven solid-state receptors with particular focus on task-specific enhancement filters. An ex vivo study in hu-man teeth. Clin Oral Investig. 2008 Sep;12(3):217-223. DOI: 10.1007/s00784-007-0173-5.
11. Wenzel A, Haiter-Neto F, Frydenberg M, Kirkevang LL. Variable-resolution cone-beam computerized tomography with enhancement filtration compared with intraoral photo-stimulable phosphor radiography in detection of transverse root fractures in an in vitro model. Oral Surg Oral Med Oral Pathol Oral Radiol Endod. 2009 Dec;108(6):939-45. DOI: 10.1016/j.tripleo.2009.07.041.
resorption. J Endod. 2012 Mar;38(3):305-8. DOI: 10.1016/j. joen.2011.10.012.
13. Utumi ER, Perrella A, Albuquerque MAP, Adde CA, Rocha RG, Cavalcanti MGP. Evaluation of simulated bone lesion in the head of the mandible by using multislice computed tomog-raphy. J Appl Oral Sci. 2009 Sep-Oct;17(5):521-6.
14. Cara ACB, Gaia BF, Perrella A, Oliveira JXO, Lopes PML, Cavalcanti MGP. Validity of single- and multislice CT for assessment of mandibular condyle lesions. Dentomaxillofac Radiol. 2007 Jan;36(1):24-7.
15. Hintze H, Wiese M, Wenzel A. Cone beam CT and conven-tional tomography for the detection of morphological tem-poromandibular joint changes. Dentomaxillofac Radiol. 2007 May;36(4):192-7.