Original article (full paper)
Longitudinal intra- and inter-individual
variability in young swimmers’ performance and
determinant competition factors
Jorge Estrela Morais
Polytechnic Institute of Bragança/CIDESD, Bragança, Portugal
Mario J. Costa
Polytechnic Institute of Guarda/CIDESD, Guarda, Portugal
Pedro Forte
Polytechnic Institute of Bragança, Bragança, Portugal
Mario C. Marques
University of Beira Interior/CIDESD, Covilhã, Portugal
Antonio J. Silva
University of Trás-os-Montes and Alto Douro/CIDESD, Vila Real, Portugal
Daniel A. Marinho
University of Beira Interior/CIDESD, Covilhã, Portugal
Tiago M. Barbosa
Nanyang Technological University/CIDESD, Singapore
Abstract—The main purpose of this study was to follow-up the intra- and inter-individual variability of young swimmers’ performance and determinant factors over two competitive seasons. Thirty young swimmers (14 boys: 12.33±0.65 years -old; 16 girls: 11.15±0.55 years-old) were followed-up throughout two consecutive seasons (seven evaluation moments).
Performance (100m freestyle), anthropometric, kinematic, hydrodynamic and eficiency features were evaluated. A gender
and skill-level effect was observed. Boys improved in a higher amount (%) comparing to girls. Overall, swimmers in skill-level 2 (both genders) presented a higher intra-individual variability. Performance and anthropometrics showed a
signiicant inter-individual variability in most moments, but hydrodynamics, kinematics and eficiency did not. Within each skill-level hydrodynamics, kinematics and eficiency were the variables that showed a high inter-individual va -riability. As a gender and skill-level effect was noticed in an age-group of young swimmers, coaches and practitioners
should put the focus in speciic and customized training plans for each skill-level of swimmers. Keywords: young swimmers, seasons’ variations, eficiency, stroke mechanics, anthropometrics
Resumo—“Análise longitudinal da variabilidade intra- e inter-individual da performance e fatores determinantes em nadadores jovens.” O objetivo principal do estudo foi acompanhar a variabilidade intra- e inter-individual da performance e dos seus fatores determinantes de nadadores jovens durante duas temporadas competitivas. Trinta nadadores jovens (14 nadadores: 12.33±0.65 anos; 16 nadadoras: 11.15±0.55 anos) foram avaliados ao longo das duas épocas (7 momentos de avaliação). Foi avaliada a performance (100m livres), e variáveis antropométricas, cinemáticas, hidrodinâmicas e
Resumen—“Análisis longitudinal de la variabilidade intra- y inter-individual del rendimiento y sus determinantes en nadadores jóvenes.” El objetivo principal del estudio fue el seguimiento de la variabilidad intra- e inter-individual del rendimiento y sus factores determinantes de nadadores jóvenes en dos temporadas competitivas. Treinta nadadores jóvenes (14 niños: 12.33±0.65 años; 16 niñas: 11.15±0.55 años) fueron seguidos a lo largo de dos temporadas
com-petitivas (7 momentos de evaluación). Se evaluó el rendimiento (100m estilo libre), e características antropométricas, cinemáticas, hidrodinámicas e la eiciencia. Se observó un efecto del sexo e del nivel de habilidad. Los niños mejoraron
en una cantidad superior (%) en comparación con las niñas. En general, los nadadores de nivel de habilidad 2 (los dos
sexos) presentaron una mayor variabilidad intra-individual. El rendimiento y la antropometría mostraron una variabilidad inter-individual signiicativa en la mayoría de los momentos, lo mismo no ocurrió con la hidrodinámica, la cinemática y la eiciencia. Dentro de cada nivel de habilidad, la hidrodinámica, la cinemática y la eiciencia fueron las variables que mostraron una alta variabilidad inter-individual. Como se ha observado un efecto de sexo e nivel de habilidad, en
-trenadores y practicantes deben poner el foco en los planes de formación especíicos y personalizados para cada nivel
de habilidad de los nadadores.
Palabras clave: nadadores jóvenes, variaciones estacionales, eiciencia, mecánica de la brazada, antropometría
intra and inter-variability). The only exception is the study of Minghelli and Castro (2006), that analyzed individual
trends (mainly for kinematics) but for a shorter period of time (5 months).
Most follow-up and intervention programs reported data
for pooled sample, for anthropometric or kinematic (Lätt et al., 2009a) and hydrodynamics (Marinho et al., 2010) disre-garding the intra- and inter-individual variability. Therefore, performance research should give a step forward towards this type of research framework. Moreover, the variability of other determinant variables such as the body surface areas (such as hand, feet and trunk), intra-cyclic swimming velocity (dv) and
arm’s propelling eficiency (ηp) variables remains inexistent.
The aim of this study was to assess the intra- and inter-in-dividual variability of young swimmers’ performance and its determinant factors within and between seasons according to
gender and skill level. It was hypothesized an improvement of
the performance and likewise of its determinant factors for each gender and skill level. Most skilled swimmers would present a higher intra- and a lower inter-variability.
Methods
Participants
Fourteen boys (7 in high-skill level 1: 12.83±0.37 years of age, and 294.4±40.0 FINA points at SCM 100m freestyle; 7 in average-skill level 2: 11.83±0.37 years of age, and 166.2±17.5
FINA points at SCM 100m freestyle) and sixteen girls (8 in
high-skill level 1: 11.42±0.49 years of age, and 334.3±39.5 FINA points at SCM 100m freestyle; 8 in average-skill level 2: 10.83±0.37 years of age, and 229.1±33.9 FINA points at SCM 100m freestyle) in Tanner stages 1-2 by self-report were evalua-ted. Sample includes age-group national record holders, national champions and other swimmers that are part of a national talent ID scheme. The swimmers had at the baseline 3.40±0.56 years
of training experience (total number of training sessions: 1830
in two seasons; training sessions per week: 5.09±0.87; average volume per session: 4.86±0.97 km) and participating on regular basis in regional and national level competitions.
Introduction
Competitive swimming is a multifactorial sport that perfor-mance is determined by several factors (Barbosa et al., 2010).
Changes in anthropometric features inluence biomechanical proile, this last ones affect energy proile and; hence the perfor -mance in both young (Morais et al., 2012; Saavedra, Escalante
& Rodríguez, 2010) and elite/adult swimmers (Barbosa et al., 2010). Follow-up studies also have reported that anthropome-tric traits had an effect on performance and in several stroking parameters of young swimmers within and between seasons of
training (Lätt et al., 2009a; 2009b).
Earlier research was based on the universal perspective,
that is, mean data is reported and analyzed. Mean data express
individual changes that are shared by every subject. It is
assu-med a non-variance between subjects, or if this is identiied,
considered as being random error or noise in the dataset. Dy-namical systems on movement patterns report that movement variability is driven by the interaction of the several sources of constrains (i.e., independent variables) on action leading to the uniqueness of system dynamics for a particular performer
under a speciic task (Davids, Glazier, Araújo, & Bartlett, 2003).
Recent research suggested that each subject should be seen as
a unique individual, where a complex and dynamical athlete -environment relationship exists (Philips, Davids, Renshaw, & Portus, 2010). Some authors report a speciic and customized path in the development and maintenance of expert athletic
performance (Durand-Bush & Salmela, 2002). Therefore, individual perspective of data analysis should be a priority in sports, including swimming.
There are a few papers about variability in swimming and
mainly with to adult/elite cross-sectional research (Bideault,
Herault, & Seifert, 2013; Vantorre, Seifert, Fernandes, Vi-las-Boas, & Chollet, 2010). Individual changes drift away from the average main trend very often. High intra-indi-vidual variability in energetic measures was observed for elite swimmers through consecutive seasons of training (Anderson, Hopkins, Roberts, & Pyne, 2006; Costa et al., 2013). However, to the best of our knowledge no longitudinal research was carried out with young swimmers based on this
Coaches, parents and/or guardians and also the athletes
gave their consent for participation on this study. All procedu-res were in accordance to the Helsinki Declaration regarding Human research. The University Institutional Review Board also approved the study design.
Study design
A longitudinal research design was carried out. The repeated and subsequent measurements throughout time can be
repre-sented by a dataset of three-dimensional axis:
(1)
where ijt represent the axis, N represents the number of
subjects (i.e., N=30), M represents the variables (i.e.
anthro-pometric, kinematic, eficiency and hydrodynamic variables)
and T represents the time measurements (seven evaluation moments over two consecutive seasons; i.e. two consecutive
years). The irst season evaluations occurred: M1 - 4 weeks after the beginning of the irst season (irst competition); M2 - in the middle of the irst season (24 weeks after the beginning); M3 - in the end of the irst season (38 weeks after the beginning of the irst season. A 10 weeks interval occurred between the end of the irst and the beginning of the second one. In the
second season: M4 - immediately before the beginning of the second season (baseline); M5 - 4 weeks after the beginning of
the second season (irst competition); M6 - in the middle of the
second season (24 weeks after the beginning) and; M7 - in the end of the second season (38 weeks after the beginning). Data collection procedures were carried out always under the same conditions in all evaluation moments (e.g. the same swimming pool, lane, time of day).
Performance data collection
The oficial short course 100-m freestyle race (i.e. 25m
length swimming pool) was selected as performance outcome. The time gap between the races and data collections took no longer than 15-days.
Anthropometric data collection
For all measurements swimmers were asked to wear only
a textile swimsuit and a cap. Body surface areas were mea -sured with digital photogrammetry (Morais et al., 2012). A 2D calibration frame and swimmers’ dominant hand and foot
were scanned with a copy machine (Xerox 4110, Norwalk,
Connecticut, USA) to measure the hand surface area (HSA)
and foot surface area (FSA) with speciic software (Universal
Desktop Ruler, v3.3.3268, AVPSoft, USA) (ICC: HSA=0.98; FSA=0.96). As for the trunk transverse surface area (TTSA; ICC=0.96) swimmers were photographed with a digital camera (DSC-T7, Sony, Tokyo, Japan) in the transverse plane from
above simulating the streamlined gliding position.
Body mass (BM) and height (H) were measured with a
digital weighting scale (SECA, 884, Hamburg, Germany) and a digital stadiometer (SECA, 242, Hamburg, Germany)
respectively. Arm span (AS) and chest perimeter (CP) were measured with an anthropometric tape (RossCraft, Canada). Arm span was measured with swimmers standing on the
upright position, arms and ingers fully extended laterally
abducted at a 90º angle. The distance between the tip of the
third ingertip of each hand was measured (ICC=0.97). The CP
was measured with the swimmers simulating the streamlined gliding position (ICC=0.96).
Kinematic and eficiency data collection
Both kinematics and eficiency were assessed during the same trials. Swimming velocity (v), stroke length (SL), stroke
frequency (SF) and dv were selected as kinematic parameters.
As for eficiency estimators, stroke index (SI) and ηp were
selected. Swimmers performed three maximal freestyle swim
trials of 25m with push-off start (30 minutes of recovery between bouts).
Kinematic data was collected with a speedo-meter (Swim
speedo-meter, Swimsportec, Hildesheim, Germany). A 12-bit
resolution acquisition card (USB-6008, National Instruments,
Austin, Texas, USA) was used to transfer data (sampling rate at 50Hz) to a software customized by our group (LabVIEW®
interface, v.2009) (Barbosa et al., 2013). Data were exported to a signal processing software (AcqKnowledge v.3.5, Biopac
Systems, Santa Barbara, USA) and iltered with a 5Hz cut-off
low-pass 4th order Butterworth ilter. Swimming velocity (v, m·s-1) was computed in the middle 15m as v=d/t. Two expert evaluators measured the stroke frequency (SF, cycles·min-1) with a frequency counter during three consecutive strokes (ICC=0.98)
and afterwards converted to Hz. Stroke length was computed as SL=v/SF (Craig & Pendergast, 1979). Speed luctuation was
computed as (Barbosaet al., 2010):
(2)
Where dv is the speed luctuation (dimensionless), v is the
mean velocity (m·s-1), v
i is the instant velocity (m·s -1), F
i is the absolute frequency and n is the number of observations. Stroke
index was calculated as the product of SL and v (SI=SL*v)
(Costill et al., 1985). The ηp was estimated as (Zamparo, Pen-dergast, Mollendorf, Termin, & Minetti, 2005):
(3)
Where ηp is the propelling eficiency (%), v is the velocity
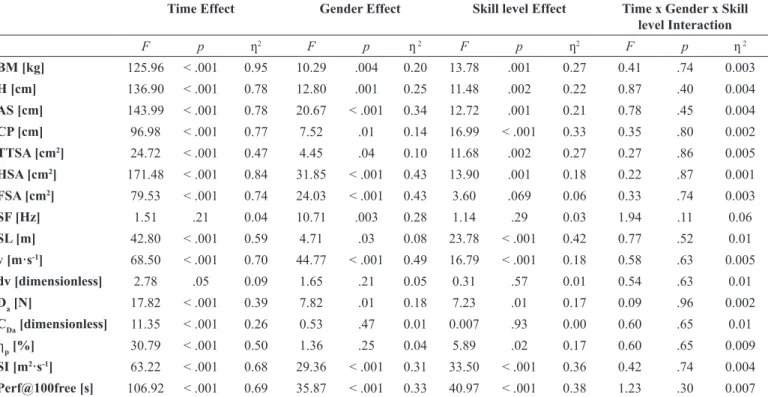
Time Effect Gender Effect Skill level Effect Time x Gender x Skill level Interaction
F p ƞ2 F p ƞ 2 F p ƞ2 F p ƞ 2
BM [kg] 125.96 < .001 0.95 10.29 .004 0.20 13.78 .001 0.27 0.41 .74 0.003
H [cm] 136.90 < .001 0.78 12.80 .001 0.25 11.48 .002 0.22 0.87 .40 0.004
AS [cm] 143.99 < .001 0.78 20.67 < .001 0.34 12.72 .001 0.21 0.78 .45 0.004
CP [cm] 96.98 < .001 0.77 7.52 .01 0.14 16.99 < .001 0.33 0.35 .80 0.002
TTSA [cm2] 24.72 < .001 0.47 4.45 .04 0.10 11.68 .002 0.27 0.27 .86 0.005
HSA [cm2] 171.48 < .001 0.84 31.85 < .001 0.43 13.90 .001 0.18 0.22 .87 0.001
FSA [cm2] 79.53 < .001 0.74 24.03 < .001 0.43 3.60 .069 0.06 0.33 .74 0.003
SF [Hz] 1.51 .21 0.04 10.71 .003 0.28 1.14 .29 0.03 1.94 .11 0.06
SL [m] 42.80 < .001 0.59 4.71 .03 0.08 23.78 < .001 0.42 0.77 .52 0.01
v [m·s-1] 68.50 < .001 0.70 44.77 < .001 0.49 16.79 < .001 0.18 0.58 .63 0.005
dv [dimensionless] 2.78 .05 0.09 1.65 .21 0.05 0.31 .57 0.01 0.54 .63 0.01
Da [N] 17.82 < .001 0.39 7.82 .01 0.18 7.23 .01 0.17 0.09 .96 0.002
CDa [dimensionless] 11.35 < .001 0.26 0.53 .47 0.01 0.007 .93 0.00 0.60 .65 0.01 ηp [%] 30.79 < .001 0.50 1.36 .25 0.04 5.89 .02 0.17 0.60 .65 0.009 SI [m2·s-1] 63.22 < .001 0.68 29.36 < .001 0.31 33.50 < .001 0.36 0.42 .74 0.004
Perf@100free [s] 106.92 < .001 0.69 35.87 < .001 0.33 40.97 < .001 0.38 1.23 .30 0.007
BM – body mass; AS – arm span; H – height; CP – chest perimeter; TTSA – trunk transverse surface area; HSA – hand surface area; FSA – foot surface area; Da – active drag; CDa – active drag coeficient; SF – stroke frequency; SL – stroke length; v – swimming velocity; dv – speed luctuation; ηp – propelling eficiency;
SI – stroke index; Perf – performance; η2 – effect size.
Table 1. Data variation (ANOVA 3-way) during the two competitive seasons for total group of swimmers. Hydrodynamic data collection
Velocity Perturbation Method was used to estimate the active drag (Da) and the coeficient of active drag (CDa) (Kolmogorov
& Duplisheva, 1992). Swimmers performed two maximal trials
of 25m at front crawl with push-off start (one trial with and other
without carrying on the perturbation device). Two expert evaluators
with stopwatches measured the trials between the 11th and 24th meter (ICC=0.97) (Marinho et al., 2010). Both evaluators walked with the swimmer to have a perfect line of sight when the swimmer
passed the speciic point of measurement. Active drag and CDa were estimated respectively as (Kolmogorov & Duplisheva, 1992):
(4)
(5)
Where Da is the swimmers’ active drag at maximal velocity (N), Db is the resistance of the perturbation buoy computed from the manufacturer’s calibration of the buoy-drag characteristics and its velocity (N), vb and v are the swimming velocities with and without the perturbation device (m·s-1), C
Da is the active drag
coeficient (dimensionless), ρ is the water density (assumed to be 1000 kg·m-3), v is the velocity (m·s-1) and S (or TTSA as reported in the anthropometrics sub-section) is the swimmers’ projected frontal surface area (cm2).
Statistical analysis
Normality and homocedasticity assumptions were analyzed with the Kolmogorov-Smirnov and Levene tests, respectively. Intra-individual data variation was analyzed with ANOVA thre -e-ways for all selected variables (time, gender and skill effects and interactions) followed by the Bonferroni post-hoc test (p ≤ .05). Intra-individual differences between moments within and between seasons (Δ, in %) were also calculated for each skill-level (skill-level 1: highest; skill-level 2: average). Total eta square (h2) was selected as effect size index and interpreted as: (i) without effect if 0 < h2 ≤ 0.04; (ii) minimum if 0.04 < h2 ≤ 0.25; (iii) moderate if 0.25 < h2 < 0.64 and; (iv) strong if h2 > 0.64. The t-student test for independent sample was used to assess inter-individual variability between skill-level in each gender (p ≤ .05). The Cohen’s Kappa, delimited by the percentiles 33, 66 and 100 was used to detect the boys and girls’ inter-variability
within each sports level. Kappa plus 95% conidence interval was computed with the Longitudinal Data Analysis software
(v.3.2, Dallas, USA). The qualitative interpretation was done as
(Landis & Koch, 1977): excellent if K ≥ 0.75; (ii) moderate if 0.40 ≤ K < 0.75 and; (iii) low if K < 0.40 based on the stability (i.e. higher stability means lower inter-individual variability).
Results
Overall data presented a signiicant time effect for all variables but the SF (Table 1). Also a signiicant gender effect was showed for most variables, except the CDa, dv and ηp. The skill-level effect
Performance improved signiicantly for the two genders in both skill-levels between initial and inal moment (Figure 1).
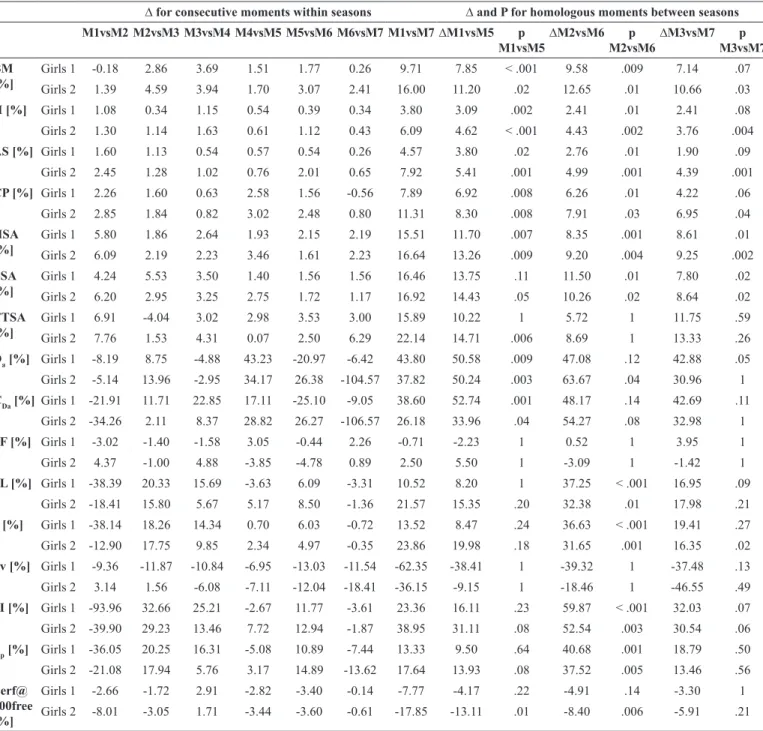
For both genders, the swimmers in the skill-level 2 presented a higher intra-individual variability (i.e. higher amount of impro-vement) between consecutive moments (within season) and also in homologous ones (between seasons) (Table 2A,B). Anthro-pometrics presented a similar trend as most variables increased
signiicantly between initial and inal moment. The skill-level
2 swimmers were the ones with the highest variability (Figure 2, Table 2 A,B). Hydrodynamics also increased between initial
and inal moment but not signiicantly for both consecutive and
homologous moments (Figure 2, Table 2A,B). Boys’ skill-level 2 presented the highest intra-individual variability (within and between seasons) in comparison to boys’ skill-level 1 (Table 2A). As for the girls, an inverse trend was observed in consecutive moments (within) but similar in homologous ones (Table 2B).
Kinematics and eficiency improved between initial and inal moment, being signiicant only for the swimming velocity. For
both boys and girls, the skill-level 2 presented the highest amount of intra-individual variability. Overall for all variables, swimmers (both genders) in skill-level 2 presented a higher intra-variability.
Figure 1. Performance variability along the two seasons. Black solid line
(♦) (■) – boys sports level 1 and 2 respectively; grey solid line (▲) (●) –
girls sports level 1 and 2 respectively; dot parts within solid line means
signiicant differences (p ≤ .05) between moments for each sports level;
white background in the marker – no-signiicant differences (p > .05) between sports level within each gender; PERF – performance@100free;
* and # after each sports level line – signiicant differences (p ≤ .05)
between initial (1) and inal moment (7) for boys and girls, respectively.
∆ for consecutive moments within seasons ∆ and p for homologous moments between seasons
M1vsM2 M2vsM3 M3vsM4 M4vsM5 M5vsM6 M6vsM7 M1vsM7∆M1vsM5 p M1vsM5
∆M2vsM6 p M2vsM6
∆M3vsM7 p M3vsM7 BM
[%]
Boys 1 1.48 2.81 3.30 0.70 1.46 -0.78 8.77 8.13 < .001 8.08 .007 4.69 .02
Boys 2 3.89 3.47 5.43 0.62 3.89 1.41 17.44 12.81 .008 12.86 < .001 11.00 .003
H [%] Boys 1 1.24 0.60 1.40 0.12 0.69 0.39 4.36 3.33 .04 2.78 .41 2.57 .56
Boys 2 1.14 0.61 3.24 0.44 1.38 0.60 7.24 5.37 .004 5.61 .002 5.59 .002
AS [%] Boys 1 1.67 0.67 0.50 0.64 1.12 0.48 4.99 3.45 .07 2.90 .18 2.72 .13
Boys 2 1.48 1.42 2.07 1.04 1.71 1.36 8.76 5.89 .009 6.12 .002 6.05 .001
CP [%] Boys 1 2.19 2.07 0.31 2.75 0.51 0.28 7.95 7.20 .004 2.09 .01 3.83 .25
Boys 2 3.27 1.90 1.32 2.11 1.45 -0.16 9.61 8.40 .006 6.64 .01 4.69 .07
HSA [%]
Boys 1 4.00 2.93 3.37 3.10 2.86 2.11 17.17 12.88 < .001 11.81 .004 10.96 .04
Boys 2 4.53 1.96 4.30 3.47 2.94 1.46 17.33 13.60 .006 12.11 .003 11.64 .01
FSA [%]
Boys 1 4.76 1.35 1.57 2.18 2.85 2.13 14.21 9.62 .08 7.79 .06 8.49 .09
Boys 2 6.58 1.85 2.85 1.39 3.38 2.97 17.68 12.08 .13 9.23 .003 10.25 .001
TTSA [%]
Boys 1 5.42 -2.31 4.18 4.39 4.20 4.63 20.58 13.17 .17 10.67 1 16.03 .41
Boys 2 11.19 -4.43 3.99 4.00 3.26 5.06 22.27 15.39 .02 7.37 .99 15.12 .37
Da [%] Boys 1 -1.92 1.06 -4.62 8.69 -7.99 -3.64 19.86 29.12 .76 20.80 1 12.37 1
Boys 2 0.94 6.19 -22.02 27.89 20.39 -24.95 38.30 23.90 1 50.54 .03 25.40 .98
CDa [%]Boys 1 -4.47 -2.19 12.86 -11.85 -0.44 -16.48 -0.30 10.23 1 12.88 1 -2.45 1
Boys 2 -19.14 -1.94 -7.21 25.80 7.40 -28.48 9.82 6.44 1 42.89 < .001 13.63 1
SF [%] Boys 1 6.94 1.06 -1.60 -3.58 4.73 0.09 8.13 3.17 1 0.97 1 0.05 1
Boys 2 1.55 2.10 -4.03 -1.59 8.65 -4.29 4.02 -1.21 1 5.39 1 -0.09 1
SL [%] Boys 1 -31.81 15.96 8.13 3.15 -1.47 1.28 5.86 5.99 .60 24.71 .21 10.90 1
Boys 2 -26.64 19.83 12.52 2.98 -4.30 4.04 17.62 17.43 .50 29.18 .11 15.50 .22
v [%] Boys 1 -27.13 16.66 7.00 -0.15 3.17 1.20 9.77 5.64 .14 25.41 .12 10.69 1
Boys 2 -23.86 25.31 4.69 2.28 4.74 0.36 21.10 16.45 1 34.19 .005 11.75 .06
dv [%] Boys 1 16.68 -30.37 -9.44 8.46 -11.56 -2.49 -1.15 8.42 1 -42.17 1 -9.07 1
Boys 2 7.47 -20.55 2.99 -9.94 8.15 -1.58 1.98 -11.10 1 -12.06 1 5.39 1
SI [%] Boys 1 -73.93 27.60 13.40 2.93 2.05 2.23 14.96 11.27 .06 41.78 .14 19.10 1
Boys 2 -67.62 38.58 16.56 5.45 0.44 4.23 32.93 28.90 .41 52.10 .01 25.35 .04
ηp [%] Boys 1 -37.17 16.24 7.48 2.51 -2.44 -1.96 -4.21 0.12 1 23.12 .32 5.87 1
Boys 2 -28.13 21.90 7.49 0.79 2.02 -8.05 8.46 11.74 1 29.62 .31 5.13 1
Perf@ 100free [%]
Boys 1 -6.16 -2.41 3.52 -4.72 -3.07 -0.20 -13.39 -9.78 .02 -6.67 .53 -4.38 1
Boys 2 -8.25 -5.96 2.70 -8.00 -5.05 -1.00 -27.80 -20.58 .009 -16.88 .001 -11.44 .002
Performance data showed a signiicant inter-individual
variability between skill-levels within both genders in most moments (Figure 1). Anthropometric features also showed
a signiicant inter-individual variability except in the last
moments stage of the second season (M6 and M7) (Figure 2).
The FSA presented no-signiicant inter-individual variability
in all moments for both genders. As for hydrodynamics,
kinematics and eficiency the main trend was the no-signi
-icant inter-individual variability in both genders and skill -levels. The exception was the v that presented signiicant
inter-individual variability between skill-levels in several
moments, mainly for the boys (Figures 2 and 3). Overall, an
inverse trend was found for anthropometrics (signiicant) and remaining domains (no-signiicant) between skill-levels
for both genders.
Performance presented a moderate (0.40 ≤ K < 0.75)
in-ter-individual variability in each gender and skill-level, except
for boys in the skill-level 2 (high, K= 0.24). Hydrodynamics,
kinematics and eficiency showed a high inter-individual va
-riability in both genders and skill-levels (except the SF for the
boys’ skill-level 1: low, K=0.66). Overall, it seems that a high
inter-individual variability exists within each skill-level. BM – body mass; AS – arm span; H – height; CP – chest perimeter; TTSA – trunk transverse surface area; HSA – hand surface area; FSA – foot surface area; Da – active drag; CDa – active drag coeficient; SF – stroke frequency; SL – stroke length; v – swimming velocity; dv – speed luc -tuation; ηp – propelling eficiency; SI – stroke index; Perf – performance; M – moment; Δ – delta value; p – signiicant value; % – percentage.
∆ for consecutive moments within seasons ∆ and P for homologous moments between seasons
M1vsM2 M2vsM3 M3vsM4 M4vsM5 M5vsM6 M6vsM7 M1vsM7∆M1vsM5 p M1vsM5
∆M2vsM6 p M2vsM6
∆M3vsM7 p M3vsM7 BM
[%]
Girls 1 -0.18 2.86 3.69 1.51 1.77 0.26 9.71 7.85 < .001 9.58 .009 7.14 .07
Girls 2 1.39 4.59 3.94 1.70 3.07 2.41 16.00 11.20 .02 12.65 .01 10.66 .03
H [%] Girls 1 1.08 0.34 1.15 0.54 0.39 0.34 3.80 3.09 .002 2.41 .01 2.41 .08
Girls 2 1.30 1.14 1.63 0.61 1.12 0.43 6.09 4.62 < .001 4.43 .002 3.76 .004
AS [%] Girls 1 1.60 1.13 0.54 0.57 0.54 0.26 4.57 3.80 .02 2.76 .01 1.90 .09
Girls 2 2.45 1.28 1.02 0.76 2.01 0.65 7.92 5.41 .001 4.99 .001 4.39 .001
CP [%] Girls 1 2.26 1.60 0.63 2.58 1.56 -0.56 7.89 6.92 .008 6.26 .01 4.22 .06
Girls 2 2.85 1.84 0.82 3.02 2.48 0.80 11.31 8.30 .008 7.91 .03 6.95 .04
HSA [%]
Girls 1 5.80 1.86 2.64 1.93 2.15 2.19 15.51 11.70 .007 8.35 .001 8.61 .01
Girls 2 6.09 2.19 2.23 3.46 1.61 2.23 16.64 13.26 .009 9.20 .004 9.25 .002
FSA [%]
Girls 1 4.24 5.53 3.50 1.40 1.56 1.56 16.46 13.75 .11 11.50 .01 7.80 .02
Girls 2 6.20 2.95 3.25 2.75 1.72 1.17 16.92 14.43 .05 10.26 .02 8.64 .02
TTSA [%]
Girls 1 6.91 -4.04 3.02 2.98 3.53 3.00 15.89 10.22 1 5.72 1 11.75 .59
Girls 2 7.76 1.53 4.31 0.07 2.50 6.29 22.14 14.71 .006 8.69 1 13.33 .26
Da [%] Girls 1 -8.19 8.75 -4.88 43.23 -20.97 -6.42 43.80 50.58 .009 47.08 .12 42.88 .05
Girls 2 -5.14 13.96 -2.95 34.17 26.38 -104.57 37.82 50.24 .003 63.67 .04 30.96 1
CDa [%] Girls 1 -21.91 11.71 22.85 17.11 -25.10 -9.05 38.60 52.74 .001 48.17 .14 42.69 .11
Girls 2 -34.26 2.11 8.37 28.82 26.27 -106.57 26.18 33.96 .04 54.27 .08 32.98 1
SF [%] Girls 1 -3.02 -1.40 -1.58 3.05 -0.44 2.26 -0.71 -2.23 1 0.52 1 3.95 1
Girls 2 4.37 -1.00 4.88 -3.85 -4.78 0.89 2.50 5.50 1 -3.09 1 -1.42 1
SL [%] Girls 1 -38.39 20.33 15.69 -3.63 6.09 -3.31 10.52 8.20 1 37.25 < .001 16.95 .09
Girls 2 -18.41 15.80 5.67 5.17 8.50 -1.36 21.57 15.35 .20 32.38 .01 17.98 .21
v [%] Girls 1 -38.14 18.26 14.34 0.70 6.03 -0.72 13.52 8.47 .24 36.63 < .001 19.41 .27
Girls 2 -12.90 17.75 9.85 2.34 4.97 -0.35 23.86 19.98 .18 31.65 .001 16.35 .02
dv [%] Girls 1 -9.36 -11.87 -10.84 -6.95 -13.03 -11.54 -62.35 -38.41 1 -39.32 1 -37.48 .13
Girls 2 3.14 1.56 -6.08 -7.11 -12.04 -18.41 -36.15 -9.15 1 -18.46 1 -46.55 .49
SI [%] Girls 1 -93.96 32.66 25.21 -2.67 11.77 -3.61 23.36 16.11 .23 59.87 < .001 32.03 .07
Girls 2 -39.90 29.23 13.46 7.72 12.94 -1.87 38.95 31.11 .08 52.54 .003 30.54 .06 ηp [%] Girls 1 -36.05 20.25 16.31 -5.08 10.89 -7.44 13.33 9.50 .64 40.68 .001 18.79 .50
Girls 2 -21.08 17.94 5.76 3.17 14.89 -13.62 17.64 13.93 .08 37.52 .005 13.46 .56
Perf@ 100free [%]
Girls 1 -2.66 -1.72 2.91 -2.82 -3.40 -0.14 -7.77 -4.17 .22 -4.91 .14 -3.30 1
Girls 2 -8.01 -3.05 1.71 -3.44 -3.60 -0.61 -17.85 -13.11 .01 -8.40 .006 -5.91 .21
Figure 2. Anthropometric and hydrodynamic variability along the two seasons. Black solid line (♦) (■) – boys sports level 1 and 2 respectively; grey solid line (▲) (●) – girls sports level 1 and 2 respectively; dot parts within solid line means signiicant differences (p ≤ .05) between moments
for each sports level; white background in the marker – no-signiicant differences (P>0.05) between sports level within each gender; BM – body
Discussion
The aim of this study was to assess the intra- and inter-individual variability of young swimmers’ performance and its determinant factors within and between seasons according to gender and skill
-level. Main indings were the signiicant gender and skill-level
(both genders) effects. Swimmers in skill-level 2 presented a higher intra-individual variability in comparison to skill-level 1. Overall,
a signiicant inter-individual variability between skill-levels (both
genders) was found for performance and anthropometrics but not
for hydrodynamics, kinematics and eficiency.
Intra-individual variability
Performance showed a signiicant improvement between irst
(M1) and last (M7) evaluations in both genders and skill-levels. Previous studies also pointed out a performance improvement for
young swimmers during two consecutive years (Lätt et al., 2009a;
2009b; Tella, Llana, Madera, & Navarro, 2002). However, these
studies plotted all swimmers only by gender and did not have into account the hypothetical differences between swimmers of the same gender. Present data shows that swimmers in the same age-group have different rates of performance enhancement (Figure 1, Table 2A,B). Regarding the gender gap, boys improved more sharply their performance than girls when comparing homolo-gous skill-levels (skill-level 1 boys vs. girls: -13.39% vs. -7.77%; skill-level 2 boys vs. girls: -27.80% vs. -17.85%). And swimmers in skill-level 2 (both genders) showed a higher intra-individual variability in comparison to the ones in skill-level 1. The delayed
maturation in boys in comparison to girls may explain the gender
gap and therefore the higher amount of performance improve-ment. And it might be speculated that swimmers in skill-level 2 (both genders) were also in a less mature phase, increasing their chances to enhance the performance.
All anthropometric variables (i.e. lengths and body surfaces) increased between M1 and M7 for both genders’ skill-levels,
and most of them signiicantly (Figure 2, Table 2A,B). Young
Figure 3. Kinematic and energetic variability along the two seasons. Black solid line (♦) (■) – boys sports level 1 and 2 respectively; grey solid line (▲) (●) – girls sports level 1 and 2 respectively; dot parts within solid line means signiicant differences (p ≤ .05) between moments for each
sports level; white background in the marker – no-signiicant differences (p > .05) between sports level within each gender; SF – stroke frequency;
swimmers, as any other children, experience physical changes
as part of their normal biological development. Body mass, height, and therefore, limbs’ lengths and areas are some of the anthropometric features that change with growth (Malina & Bouchard, 1991). Overall, growth rate was similar or higher in boys than in girls. These data suggested that boys were in an accelerated development stage, while girls have eventually
experienced such biological development before. Literature is
consensual that girls overcome maturation two years earlier than boys (Malina & Bouchard, 1991). However between skill-levels, within each gender, swimmers presented differences between them (i.e. a high intra-individual variability). Swimmers in
skill-level 2 were characterized by a higher intra-individual
variability (increase) in comparison to their skill-level 1
coun-terparts. These differences highlight the existent variability even
in an age-group of swimmers, suggesting that each swimmer
has a speciic developmental rate.
Regarding hydrodynamics, mixed results were obtained.
Both Da and CDa increased between M1 and M7 in both genders,
except the CDa for boys and girls in skill-level 1 (decrease). Un-changed hydrodynamics was reported for eight weeks of training at the beginning of a season (Marinho et al., 2010). The main aim of this general period of preparation was to build-up aerobic capacity and aerobic power, enhancing swimming technique.
However, one week of drill training with speciic visual and
kinaesthetic feedbacks, was enough to decrease CDa in pubescent swimmers (Havriluk, 2006). So, hydrodynamic enhancement is more related to technical ability than to energetic build-up. Indeed swimmers in skill-level 1 (both genders) did decrease their CDa (boys: -0.30%; girls: -0.71%). During the two-year assessment, the swimmers training included technical drills to
enhance their hydrodynamic proile (i.e., optimizing their body
and segments position while swimming). Nevertheless our data shows that those technical drills had a higher contribution to the fastest swimmers (skill-level 1) than on their counterparts in skill-level 2. These differences in technical ability parameters also highlight the intra-individual variability in an age-group of swimmers within each gender.
Overall, kinematics and eficiency increased (enhanced) between M1 and M7, but only the v showed a signiicant incre -ase. The improvement of young swimmers’ swimming velocity between two major competitions was reported as being related to
SL increases and SF decreases (Tella et al., 2002). This SL-SR relationship is a result of growth (e.g. height, arm span, hands and feet dimensions). However, present data showed an increase
in the SF for most groups (except girls’ skill-level 1). It seems that at these early ages swimmers use both SF and SL to improve
swimming velocity and therefore the performance. Skill-level 2 swimmers presented a higher amount of improvement. As these swimmers also showed a higher intra-individual variability in
the anthropometrics, this highlights the inluence of anthropo -metrics features in stroke mechanics. Nevertheless, kinematic
and eficiency features presented a no-linear fashion way. In M2
swimmers were submitted to a heavy training period to build-up other determinant domains of performance (e.g. energetics). E.g. as we can learn from the swimmers sub-section, volume training per session was 4.86±0.97 km. Hence, in M2, volume would be
close to the upper limit of this conidence interval. However,
one might not consider that this kind of energetic training comes with no downside. Stroke mechanics seems to impair due to it (for both genders’ skill-levels), even so, performance in M2 was not affected for all conditions.
Inter-individual variability
Based on paired comparisons, a signiicant inter-individual
variability was showed between skill-levels in both genders along the two seasons for the performance and most of the
anthropometric features (except for the FSA, all conditions). On the other hand, hydrodynamics, kinematics and eficiency
did not present the same trend. For both genders’ skill-levels a
no-signiicant inter-individual variability was observed in most moments. Yet the v and the SI did show a signiicant inter-in -dividual variability between skill-levels (mainly on boys) in most of the moments in the two seasons. Therefore it can be
stated that an inter-individual variability do exist within an
age-group of young swimmers, especially for the anthropometrics and some variables responsible for the stroke mechanics (i.e., v and SI). Silva et al. (2013) showed that pubertal swimmers (in both genders) do have higher standards in variables related
to stroke mechanics (e.g., v and SL). However, literature does
not report young swimmers’ variability within an age-group or
other kind in longitudinal researches. Previous studies (Lätt et al., 2009a, 2009b; Tella et al., 2002) assumed that swimmers in the same age-group share the same development pattern and that variance might be a residual error. However, new trends in swimming research suggest that each athlete has a unique deve-lopment rate (Philips et al., 2010). In fact present data highlight
that a swimmers’ age-group is characterized by a signiicant
inter-individual variability namely in anthropometric features, v
(kinematics) and SI (eficiency). Indeed swimmers in skill-level 1 (both genders) were characterized by higher body dimensions,
v and SI and hence a higher performance.
Inter-individual variability based on Cohen’s Kappa
quan-tiies the partial position of a swimmer against remaining con -tenders within a skill-level. A higher variability indicates that there are several changes in the partial position of the swimmers throughout the time-frame under analysis (Costa et al., 2012). Overall, performance showed a moderate (0.40 ≤ K < 0.75) and anthropometrics a high stability (K ≥ 0.75; i.e. a low inter-indi-vidual variability) for both genders’ skill-levels. Contrarily, for
hydrodynamics, kinematics and eficiency a high inter-indivi
-dual variability was observed (K < 0.40). These indings are of major importance as it also highlights the existent variability
for technical ability patterns within a group of swimmers with similar characteristics. Especially in swimmers that are still
suffering growth and maturation processes that inluence the
stroke mechanics. Moreover, each athlete should be seen as a unique individual and therefore one might consider that each one
“chooses” their path to enhance performance. Nowadays adult/
newer theories of movement control do not view variability in movements as error (i.e. dynamical systems theory). So, performance research should give a step forward towards this type of research framework.
Conclusion
We conclude that within an age-group of young swimmers a gender and skill-level effect was identiied. Overall in both
genders, swimmers in skill-level 2 presented a higher intra-in-dividual variability. During the two seasons the performance and the anthropometric features were the ones presenting a
signiicant inter-individual variability between skill-levels
and also a moderate (performance) to high (anthropometrics) inter-individual variability within each skill-level. Therefore swimmers in the same age-group do differ between them, hence
practitioners and coaches should design customized training
plans for each swimmer and put more focus on individual and dynamic analysis frameworks.
References
Anderson, M., Hopkins, W., Roberts, A. & Pyne, D. (2006). Monito -ring seasonal and long-term changes in test performance in elite swimmers. European Journal of Sport Sciences, 6, 145-154. Barbosa, T.M., Bragada, J.A., Reis, V.M., Marinho, D.A., Carvalho, C.
& Silva, A.J. (2010). Energetics and biomechanics as determining factors of swimming performance: Updating the state of the art. Journal of Science and Medicine in Sport, 13, 262-269.
Barbosa, T.M., Morouço, P.G., Jesus, S., Feitosa, W.G., Costa, M.J., Marinho, D.A., … Garrido, N.D. (2013). The interaction between
intra-cyclic variation of the velocity and mean swimming velocity in young competitive swimmers. International Journal of Sports Medicine, 34, 123-130.
Bideault, G., Herault, R., & Seifert, L. (2013). Data modelling reveals
inter-individual variability of front crawl swimming. Journal of Science and Medicine in Sports, 16, 281-285.
Craig, A., & Pendergast, D. (1979). Relationships of stroke rate, dis-tance per stroke and velocity in competitive swimming. Medicine and Science in Sports Exercise, 11, 278-283.
Costa, M.J., Bragada, J.A., Mejias, J.E., Louro, H., Marinho, D.A.,
Silva, A.J. & Barbosa, T.M. (2012). Tracking the performance, energetics and biomechanics of international versus national le-vel swimmers during a competitive season. European Journal of Applied Physiology, 112, 811-820.
Costa, M.J., Bragada, J.A., Mejias, J.E., Louro, H., Marinho, D.A.,
Silva, A.J. & Barbosa, T.M. (2013). Effects of swim training on energetics and performance. International Journal of Sports Medicine, 34, 507-513.
Costill, D.L., Kovaleski, J., Porter, D., Kirwan, J., Fielding, R. & King, D. (1985). Energy expenditure during front crawl swimming: pre -dicting success in middle-distance events. International Journal of Sports Medicine, 6, 266–270.
Davids, K., Glazier, P., Araújo, D., & Bartlett, R. (2003). Movement
systems as dynamical systems: the functional role of variability and its implications for Sports Medicine. Sports Medicine, 33, 245-260. Durand-Bush, N., & Salmela, J. (2002). The development and
maintenan-ce of expert athletic performanmaintenan-ce: permaintenan-ceptions of World and Olympic
champions. Journal of Applied Sport Psychology, 14, 154-171.
Havriluk, R. (2006). Magnitude of the effect of an instructional inter-vention on swimming technique and performance. In: J. P. Vilas -Boas, F. Alves, & A. Marques (Eds.), X International Symposium of Biomechanics and Medicine in Swimming (pp. 218-220). Porto: Portuguese Journal of Sport Sciences.
Kolmogorov, S., & Duplisheva, O. (1992). Active drag, useful mecha-nical power output and hydrodynamic force in different swimming
strokes at maximal velocity. Journal of Biomechanics, 25, 311-318.
Landis, J., & Koch, G. (1977). The measurement of observer agreement
for categorical data. Biometrics, 33, 159-174.
Lätt, E., Jürimäe, J., Haljaste, K., Cicchella, A., Purge, P., & Jürimäe, T. (2009a). Longitudinal development of physical and performance
parameters during biological maturation of young male swimmers. Perceptual Motor Skills, 108, 297-307.
Lätt, E., Jürimäe, J., Haljaste, K., Cicchella, A., Purge, P. & Jürimäe,
T. (2009b). Physical development and swimming performance during biological maturation in young female swimmers. Collegium Antropologicum, 33, 117-122.
Malina, R.M., & Bouchard, C. (1991). Growth, maturation and physical activity. Human Kinetics, Champaign: Illinois.
Marinho, D.A., Barbosa, T.M., Costa, M.J., Figueiredo, C., Reis, V.M., Silva, A.J. & Marques, M.C. (2010). Can 8 weeks of training affect active drag in young swimmers? Journal of Sports Science and Medicine, 9, 71-78.
Minghelli, F. & Castro, F. (2006). Kinematics parameters of crawl stroke sprinting through a training season. In: J. P. Vilas-Boas, F. Alves, & A. Marques (Eds.), X International Symposium of Biomechanics and Medicine in Swimming (pp. 62-64). Porto: Portuguese Journal of Sport Sciences.
Morais, J.M., Jesus, S., Lopes, V., Garrido, N.D., Silva, A.J., Mari
-nho, D.A. & Barbosa, T.M. (2012). Linking selected kinematic,
anthropometric and hydrodynamic variables to young swimmer performance. Pediatric Exercise Science, 24, 649-664.
Phillips, E., Davids, K., Renshaw, I. & Portus, M. (2010). Expert per -formance in sport and the dynamics of talent development. Sports Medicine, 40, 271-283.
Saavedra, J.M., Escalante, Y., & Rodríguez, F.A. (2010). A multivariate
analysis of performance in young swimmers. Pediatric Exercise Science, 22, 135-151.
Silva, A.F., Figueiredo, P., Seifert, L., Soares, S., Vilas-Boas, J.P., & Fernandes, R.J. (2013). Backstroke technical characterization of
11-13 year old swimmers. Journal of Sports Science and Medicine, 12, 623-629.
Tella, V., Llana, S., Madera, J. & Navarro, F. (2002). Evolution of
anthropometrical and kinematic parameters in young swimmers:
a longitudinal study. In: K. E. Gianikellis (Ed.), Proceedings of the XX International Symposium on Biomechanics in Sports (pp.
64-67). Cáceres: University of Extremadura.
Vantorre, J., Seifert, L., Fernandes, R.J., Vilas-Boas, J.P., & Chollet,
D. (2010). Comparison of grab starts between elite and trained swimmers. International Journal of Sports Medicine, 31, 887-893. Zamparo, P., Pendergast, D.R., Mollendorf, J., Termin, A., & Minetti,
A.E. (2005). An energy balance of front crawl. European Journal of Applied Physiology, 94, 134-144.
Authors’ note
Jorge Estrela Morais and Pedro Forte are afiliated with the Department
of Sport Sciences, Polytechnic Institute of Bragança. Jorge Estrela
Morais is also afiliated with the Research Centre in Sports, Health
Mario J. Costa is afiliated with the Department of Sport Sciences, Polytechnic Institute of Guarda, and with the Research Centre in Sports,
Health and Human Development, Vila Real, Portugal.
Mario C. Marques and Daniel A. Marinho are afiliated with the De -partment of Sport Sciences, University of Beira Interior, Covilhã, and with the Research Centre in Sports, Health and Human Development, Vila Real, Portugal.
Antonio J. Silva is afiliated with the Department of Sport Sciences, Exercise and Health, University of Trás-os-Montes and Alto Douro,
Vila Real, and with the Research Centre in Sports, Health and Human Development, Vila Real, Portugal.
Tiago M. Barbosa is afiliated with the Nanyang Technological Uni -versity, Singapore and with the Research Centre in Sports, Health and Human Development, Vila Real, Portugal.
Corresponding author
Jorge E Morais
Department of Sport Sciences, Polytechnic Institute of Bragança Campus Sta. Apolónia, Apartado 1101, 5301-856, Bragança, Portugal Phone: +351 273 303 000
Fax: +351 273 303 135
E-mail: [email protected]
Acknowledgments
Jorge E. Morais would like to acknowledge to the Portuguese
Scien-ce and Technology Foundation (FCT) for the PhD grant (SFRH/ BD/76287/2011). The authors wish to thank Marc Moreira (University
of Trás-os-Montes and Alto Douro) for his help during data collection.
Manuscript received on April 14, 2014 Manuscript accepted on August 1, 2014
Motriz. The Journal of Physical Education. UNESP. Rio Claro, SP, Brazil