Original article (full paper)
Using network metrics to investigate football
team players’ connections: A pilot study
Filipe Manuel Clemente Coimbra College of Education, Portugal
Micael Santos Couceiro University of Coimbra, Portugal
Fernando Manuel Lourenço Martins Rui Sousa Mendes
Coimbra College of Education, Portugal
Abstract—The aim of this pilot study was propose a set of network methods to measure the speciic properties of
football teams. These metrics were organized on “meso” and “micro” analysis levels. Five oficial matches of the same team on the First Portuguese Football League were analyzed. An overall of 577 offensive plays were analyzed from the ive matches. From the adjacency matrices developed per each offensive play it were computed the scaled connectivity, the clustering coeficient and the centroid signiicance and centroid conformity. Results showed that the highest values of scaled connectivity were found in lateral defenders and central and midielder players and the lowest values were found in the striker and goalkeeper. The highest values of clustering coeficient were generally found in midielders and forwards. In addition, the centroid results showed that lateral and central defenders tend to be the centroid players in the attacking process. In sum, this study showed that network metrics can be a powerful tool to help coaches to understanding the speciic team’s properties, thus supporting decision-making and improving sports training based on match analysis. Keywords: match analysis, football, network, metrics, performance
Resumo—“Avaliando as conexões entre jogadores de futebol utilizando métricas de network: Um estudo piloto.” O presente
estudo piloto teve como objetivo do piloto propor um conjunto de métodos de network para avaliar as propriedades de equipes de futebol. Essas métricas foram organizadas em função dos níveis de análise “meso” e “micro.” Foram analisados cinco jogos oiciais da mesma equipa participante na Primeira Liga Proissional de Futebol Português. Um conjunto de 577 jogadas atacantes foram analisadas ao longo desses cinco jogos. As interações entre companheiros de equipa foram recolhidas e processadas seguindo os níveis de análise anteriormente referidos. Os resultados evidenciaram que os maiores valores de escala de conetividade foram encontrados nos defensores laterais e zagueiros, bem como, nos meio-campistas e os menores valores encontraram-se no atacante e goleiro. Os maiores valores de coeiciente de agrupamento foram geralmente encontrados nos meio-campistas e atacantes. No caso dos resultados relativos ao centroid veriicou-se que os defensores laterais e zagueiros tendem a ser os jogadores centroids no processo atacante. Em resumo, este estudo destacou que as métricas de network podem ser um instrumento poderoso para auxiliar os treinadores a compreenderem as propriedades especíicas das equipes, suportando a tomada de decisão e melhorando o treinamento tendo como base a análise de jogo. Palavras-chave: análise de jogo, futebol, network, métricas, rendimento
Resumen—“La evaluación de las conexiones entre los jugadores de fútbol utilizando métricas de red: un estudio piloto.” El
objetivo de este estudio piloto fue el de proponer un conjunto de métodos para evaluar las propiedades de la red los equipos de fútbol. Estas métricas se organizaron de acuerdo con el nivel de análisis “meso” y “micro.” Se analizaron cinco partidos oiciales en el mismo equipo que participan en la Liga Premier de Fútbol Profesional de Portugal. Se analizó una serie de 577 atacantes mueve en estos cinco partidos. Las interacciones entre los compañeros de equipo fueron recolectados y pro -cesados siguiendo los niveles de análisis mencionados. Los resultados mostraron que los valores más altos de conectividad de la escala se encuentran en los defensores laterales y centrales, así como los mediocampistas centrales y los valores más bajos se encontraron en-punta delantera y el portero. Los valores más altos del coeiciente de agrupamiento se encuentran generalmente en el medio y los atacantes. En los resultados para el jugador centroid, se encontró que los defensores laterales y centrales tienden a ser actores centrales en el proceso de ataque. En resumen, este estudio pone de relieve que las métricas de la red puede ser una herramienta poderosa para ayudar a los entrenadores a comprender las propiedades especíicas de los equipos, el apoyo a la toma de decisiones y la mejora de lo entrenamiento basada en el análisis del juego.
Introduction
The opposition and coordination between two teams is the essence of invasion sports wherein each team tries to recover, maintain, and move the ball toward the score zone to score the goal (Gréhaigne & Godbout, 1995). Thus, Metzler (1987) des-cribes the essence of a football team as a possibility to solve, in action, an unpredictable set of problems with the highest eficacy possible. This problem occurs simultaneously in both offensive and defensive phases depending on which team possesses the ball. Therefore, an invasion team sport constitutes a complex and dynamic system that remains all match, adapting to the contextual constraints (Clemente, Couceiro, Martins, & Mendes, 2013; Gréhaigne, Bouthier, & David, 1997; McGarry, 2005).
To overcome the opposition, a strong collective organization should be undertaken to improve the possibilities of individual success. At the team organizational level, the numerous interre-lations between players within the team make up what one might call a competency network (Gréhaigne, 1992). The competency network is based on each player’s recognized strengths and weaknesses with reference to the practice of the sport and on the group’s dynamism (Gréhaigne, Richard, & Grifin, 2005). Therefore, the team’s functional performance is assured by a complex network of interpersonal relationships among players (Passos, et al., 2011) in which the competency network is more of a dynamic concept than a static one (Gréhaigne, Godbout, & Bouthir, 1999). Any network analysis needs to consider the regular and variable interactions between players. For the study of the competency network, some works have been undertaken to improve the knowledge of the team’s collective behavior (Grunz, Memmert, & Perl, 2009; Memmert & Perl, 2009).
Some works have being suggesting the use of graph theory (a network method) in sports (Bourbousson, Poizat, Saury, & Seve, 2010; Duarte, Araújo, Correia, & Davids, 2012; Passos, et al., 2011). Bourbousson, Poizat, Saury, and Seve (2010) used graph theory to analyze the connectivity between basketball players in each unit of attack, crossing this quantitative analysis with a qualitative one to explain the social interactions. Their main inding was the rise of a speciic network regarding each team. These results suggest that a network’s coordination was built on local interactions that do not necessarily require all players to achieve the team’s goal. In the case of water polo, it was shown that the most successful collective system behavior requires a high probability of each player interacting with other players in a team (Passos et al., 2011). More speciically, in the case of a football game, researchers proposed to analyze the attacking plays that result in shots and identify the main players that con -tribute to the process of building the attack (Duch, Waitzman, & Amaral, 2010). Using a centrality approach, they found the player with the most inluence on each analyzed team. Such an approach was compared with an observational analysis of experts and showed strong correspondence. Recently, Malta and Travassos (2014) characterized the attacking transition using a network approach, thus revealing that the team opted for a style of play based on circulation and direct play.
Despite those studies that used a network approach to iden-tify team properties, the use of network metrics is too limited.
Actually, the network (graph) as a single analysis cannot provide a powerful quantitative analysis. Using the network analysis alone does not allow one to identify the centroid player, the level of heterogeneity of the team, or clusters inside the team. In that sense, many metrics should be included in sports analysis for a further understanding of a team’s behavior.
Therefore, this pilot study aimed to introduce a set of network metrics from the social sciences literature that can help in obtaining robust quantitative information about a te -am’s process, mainly trying to characterize how the network approach can contribute to better understanding the teamma -tes’ interactions throughout the match. To identify the team’s properties, the teammates’ interactions were classiied into two main levels of analysis: i) ‘meso’ analysis, exploring the clusters that emerged from the team’s organization (Clustering Coeficient) and the connectivity level between players (Scaled Connectivity); and ii) ‘micro’ analysis, identifying the centroid players and how these centroids may help teammates connect to each other (Centroid Player).
Methods
Sample
Five oficial matches of the same team on the First Por-tuguese Football League were analyzed. The team won four matches and achieved a draw in one match. Over all the ma-tches, 21 players were analyzed. Each player was encoded to identify individual characteristics, maintaining the same code for all matches.
Despite the different playing times per player, this study aimed at keeping the real characteristics of an oficial foo-tball game, thus respecting the substitutions and the different options for each match. In order to overcome this ecological constraint, a network for each half of a match and for each overall match was performed, resulting in 15 different ne-tworks. This solution was considered so as to provide a useful and easy reference in a practical point of view. Actually, this option allows one to consider that one player may not play with another due to substitutions. Nevertheless, this is a natural constraint of real and ecological data collecting. The same strategic distribution (1-4-2-3-1) was the observed for all matches. This strategic distribution was classiied based on the routines and actions performed by individual players during the match (see Table 1). The players were classiied based on their tactical region and movements.
Data collection
Bourbousson et al. (2010) and Passos et al. (2011) that deined each ‘unit of attack’ (for the football case the offensive play) starting at the moment a team gained the ball possession until the ball was recovered by the opposing team. An overall of 577 offensive plays were analyzed from the 5 matches.
Developing the adjacency matrix
A MatLab script denoted as wgPlot was developed by Michael Wu (Wu, 2009) which allowed to plot graphs simi-larly to gPlot, a MatLab function that allows to plot n nodes connected by links representing a given adjacency matrix
deined by:
(1)
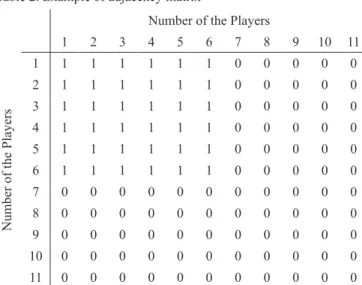
It is noteworthy that in the football situation, in which each adjacency matrix represent a successful pass, the diagonal ele-ments (i.e., when i=j ) are set equal to 1 to identify player i as one of the players that participated in the offensive play. As an example, consider the herein presented sequence of passes in which the irst player corresponds to the irst vertex and so on. The team under study has 11 players, i.e., =11, but the ive last players did not contribute to this offensive play. The adjacency matrix of this offensive play (Table 2) would be represented by:
The script wgPlot from Michael Wu (2009) allows the user to input an adjacency matrix with weighted edges and/or weighted vertices being denoted as edge-weighted edge-adjacency matrix Aw, introduced by Estrada (1995).
The weighted matrix Aw can be easily deined by the sum of all adjacency graphs each one generated by a single offensive play. To allow a graphical representation of the players coope -ration, the script presented by Michael Wu (2009), denoted as wgPlot, was further extended based with the following
featu-res: a) the vertex (i.e., player) size i, i=j, is proportional to the number of offensive plays player i participates in; b) the vertex
(i.e., cooperation between players) thickness wij and colormap
of the network is proportional to the number of offensive plays in which players i and , j, i ≠ j participates in together; c) the
script receives as input a binary database (e.g., excel ile) in
which each line corresponds to an offensive play and each column to a player, i.e., each line corresponds to an adjacency
matrix A; and d) besides returning the network from Aw, it also returns the clusters, i.e., sub communities, of the team based on Hespana’s work (2004) and extensively used in Lim, Bohacek, Hespanha and Obraczka (2005). This last point will be further explained in next section.
Seeking for clusters within a team
In order to detect groups among players, graph theory has speciic methodologies to constitute partitions. Uniform graph partition consists on dividing a graph into components, such that the components are of about the same size and there are few connections between the components. One of the functionalities of the graph partition is to generate communities (Couceiro, Clemente, & Martins, 2013). Communities, also called clus-ters or modules, are groups of vertices which probably share common properties and/or play similar roles within the graph (Fortunato, 2010).
The uniform graph partition has gained importance due to its application for clustering and detection of groups in social, pathological or biological networks (Fiduccia & Mattheyses, 1982). Commonly, the graph partition is deined by G = (V,E)
where V is the vertex and E is the edge, such that is possible to
partition G into smaller components with speciic properties.
A k-partition of V is a collection P = {V1,V2,...,Vk}of k disjoint
subsets of V, whose union equals V (Hespanha, 2004).
Player Position
Player 1 Goalkeeper
Player 2 Right Defender Player 3 Central Defender Player 4 Central Defender Player 5 Left Defender Player 6 Defensive Midielder
Player 7 Midielder
Player 8 Left Midielder
Player 9 Right Midielder
Player 10 Forward
Player 11 Striker
Player 12 Right Defender
Player 13 Left Midielder
Player 14 Midielder
Player 15 Midielder
Player 16 Forward
Player 17 Defensive Midielder Player 18 Central Defender
Player 19 Left Defender
Player 20 Striker
Player 21 Right Midielder Table 1. Strategic position of each player.
Number of the Players
1 2 3 4 5 6 7 8 9 10 11
Number of the Players
1 1 1 1 1 1 1 0 0 0 0 0
2 1 1 1 1 1 1 0 0 0 0 0
3 1 1 1 1 1 1 0 0 0 0 0
4 1 1 1 1 1 1 0 0 0 0 0
5 1 1 1 1 1 1 0 0 0 0 0
6 1 1 1 1 1 1 0 0 0 0 0
7 0 0 0 0 0 0 0 0 0 0 0
8 0 0 0 0 0 0 0 0 0 0 0
9 0 0 0 0 0 0 0 0 0 0 0
10 0 0 0 0 0 0 0 0 0 0 0
11 0 0 0 0 0 0 0 0 0 0 0
The MatLab function grPartition described in the technical report of Hespana (2004) is able to perform a fast partition of large graphs. This function implements a graph partitioning algorithm based on spectral factorization. The herein proposed MatLab
script then merges the wgPlot and grPartition functions, with a few adaptations as previously presented, to understand players’ cooperation patterns within a given team, such as the numbers of presences in an offensive play, how many players they pass them with and the existence of sub communities among them.
Therefore, running the script with the previously described example (see Developing Adjacency Matrix) would then return the following players network, thus identifying the players’ cooperation.
Using networks metrics for understanding football Many kinds of networks (e.g., biological, sociological) sha-re some topological properties. To identify and describe such properties, most potentially useful network concepts are known from graph theory (Couceiro et al., 2013). In the context of football, one can divide network concepts into: a) intra-players network concepts (i.e., network properties of a node); b) inter -players network concepts (i.e., network relationship between two or more vertices); and c) group network concepts (i.e., whole network concepts).
To allow the use of the network concepts, one can create a new relative weighted adjacency matrix , deined as:
(2)
where 0 ≤ rij ≤ 1 for i ≠ j, with i, j = 1,...,n. The denominator max i ≠ j Aw corresponds to the larger inter-player connectivity (i.e., the players that participated most together in the same offensive plays).
It is noteworthy that the diagonals of Ar represent the number of offensive plays in which a given player participated. However, this value is not considered in computing the network concepts herein presented.
Based on the weighted matrix, it was possible to compute a set of metrics based on two level of analysis (meso and micro). Each metric is a statistical method exclusively dedicated to ne -twork analysis. Therefore, more than just a visual representation, such values represent the individual contribution of each player in a given ield of analysis. The different results from player to player can increase the understanding of the individual’s contribution to the team’s network.
Network contents for the “meso” analysis of a football team For the football case, the offensive process can be deve-loped in many ways. Therefore, it is important to understand how the team breaks their homogeneity level. Moreover, it is
also important to understand the connectivity levels between teammates. Bearing these ideas in mind, two metrics will be suggested for the football analysis: a) scaled connectivity; and b) clustering coeficient.
Scaled connectivity
The irst concept and one of the widely used in the literature for distinguishing a vertex of a network (Horvath, 2011) is the connectivity (also known as degree).
In the situation herein presented, i.e., players’ networks, the
connectivity ki equal the sum of connection weights between player i and the other players. The most cooperative player, or players, can be found by inding the index/indices of the maximum connectivity.
(3) Therefore, one can deine a relative connectivity, known as scaled connectivity, of player i as:
(4)
such that is the vector of the re
-lative connectivity of players.
In football context, one could interpret the scaled connec-tivity as a measure of cooperation level of a given player in which high values of Si (i.e., as Sitends to ) indicate that the ith
player participate with most of the other players from the group.
Clustering coeficient
The clustering coeficient of player i offers a measure of
the degree of interconnectivity in the neighborhood of player
i, being deined as:
(5)
such that is the vector of the clustering coe -ficient of players and i, j = 1, ... , n.
The higher the clustering coeficient of a player, the hi-gher is the cooperation among its teammates. If the clustering coeficient tends to zero than the teammates do not cooperate much each other.
Network contents for the “micro” analysis of a football team
As a consequence, two players have a high topological de-pendency, i.e., tdij = 1, if they participate in offensive plays with the same player and with one another. In other words, the more players are “shared” between two players that highly participate in offensive plays with one another, the stronger are their coo-peration and more likely they will both represent a small cluster. However, Tdsince corresponds to a square matrix with the size equal the number of players and since that contrarily to the adjacency matrix or topological overlap (Horvath, 2011), Td is not symmetric, i.e., tdij ≠ tdji, thus making it dificult to
compare tdij and tdji pairs.
To complement the previous concept, a new ‘micro’ metric denoted as topological inter-dependency
is introduced as:
(8)
wherein is the transpose of matrix and corresponds to an an -tisymmetric square matrix, i.e., tiji = tiji. In players’ networks, one can
easily observe dependencies between players such that if tiji > 0 then the ith player depends on the jith player to play with his teammates.
Results
‘Meso’ analysis
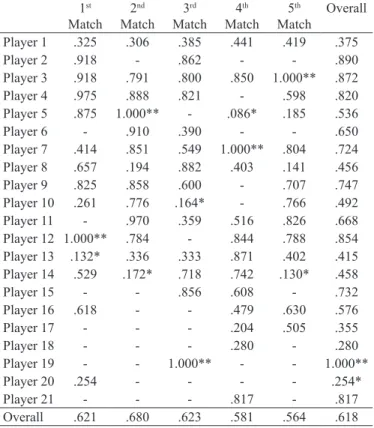
The connectivity level between players is one of the most im -portant concepts for identifying a team’s properties. Therefore, the scaled connectivity was performed for all matches (see Table 3).
1st Match
2nd Match
3rd Match
4th Match
5th Match
Overall
Player 1 .325 .306 .385 .441 .419 .375
Player 2 .918 - .862 - - .890
Player 3 .918 .791 .800 .850 1.000** .872 Player 4 .975 .888 .821 - .598 .820 Player 5 .875 1.000** - .086* .185 .536
Player 6 - .910 .390 - - .650
Player 7 .414 .851 .549 1.000** .804 .724 Player 8 .657 .194 .882 .403 .141 .456 Player 9 .825 .858 .600 - .707 .747 Player 10 .261 .776 .164* - .766 .492 Player 11 - .970 .359 .516 .826 .668 Player 12 1.000** .784 - .844 .788 .854 Player 13 .132* .336 .333 .871 .402 .415 Player 14 .529 .172* .718 .742 .130* .458
Player 15 - - .856 .608 - .732
Player 16 .618 - - .479 .630 .576
Player 17 - - - .204 .505 .355
Player 18 - - - .280 - .280
Player 19 - - 1.000** - - 1.000**
Player 20 .254 - - - - .254*
Player 21 - - - .817 - .817
Overall .621 .680 .623 .581 .564 .618 Table 3. Scaled connectivity values for all matches.
*Lowest value and ** Highest value contribute the most for the teams’ process and how players
cooperate with each other.
Centroid signiicance and centroid conformity
The network centroid can deine the centrally located node (Horvath, 2011). For the football case, the centroid can be de-ined as one of the most highly connected node(s) in the network. The irst one arises from the centroid player(s) in which one can express his connectivity strength to all other teammates as:
(6)
This inter-player concept is denoted as centroid conformity and corresponds to the adjacency between the centroid player and the ith player, such that is the vector of the centroid
confor-mity of player. In other words, CCi,centroid presents the cooperation level of the ith player with the top-ranked player.
Topological overlap measure and the topological inter-dependency
The second ‘micro’ analysis concept is based on the topologi-cal overlap presented in several works such as Ravasz, Somera, Mongru, Oltvai, and Barabasi (2002) and Horvath (2011) which represents the pair of players that cooperates with the same players. This measure may also represent the overlap between two players even if they do not participate in the same offensive plays with one another. In other words, the topological overlap between the ith player and the jth player depends on the number of offensive plays with the same “shared” players but it does not take into account the number of offensive plays between them. Moreover, the topological overlap is represented by a symmetric matrix, thus presenting the overlap between players but neglecting the most independent player of the pair. Therefore, by using the concepts inherent to the clustering coeficient (equation 5), one should consider not only the “shared” offensive plays but also the inluence of the conjoint offensive plays among players i and j.
In other words, if two players participate in offensive plays with the same other players, then the cooperation between both of them allows building triangular relations between the other players. However, the ith player may be more dependable from
the jth player if he only participates in offensive plays with the
same player than player jth which, in turn, is able to participate
in offensive plays with other players. As a result, similarly to Ravasz et al.(2002) and Horvath (2011), one can deine a
topological dependency as:
(7)
In an overall analysis, it is possible to identify that the scaled connectivity values range between .564 and .680, therefore tends to generalize the cooperation in attacking process. Nevertheless, on an individual scale, it is also possible to describe the results per each player during the matches. The players with the higher scaled connectivity values were the player 12 (right defender) in the 1st match, player 5 (left defender) in the 2nd match, player 19 (left defender) in the 3rd match, player 7 (midielder) in the 4th match and player 3 (central defender) in the 5th match. Furthermore, in the matches overall, the higher mean values belong to the defenders and midielders. On the other hand, the players with a lesser mean value of scaled connectivity are the striker (player 20), central defender (player 18) and the goalkeeper (player 1). Therefore, in a regular way, the defensive and midield players are the ones that connect most with the other players overall.
The clustering coeficient for each player (see Table 4) was worked out to analyze if one player can involve all teammates in the offensive play (i.e., enabling a global cooperation).
In an overall analysis, it is possible to identify that the clus-tering coeficient values range between .443 and .538, therefore revealing the emergence of clusters within the team. Once again, on an individual scale, it is also possible to describe the results for each player during the matches. The higher clustering coeficient values were .6053 (player 16 – forward) and .5967 (player 7 – midielder) in the 1st match; .6403 (player 13 – left midielder)
and .6006 (player 10 – forward) in the 2nd match; .5244 (player 6 – midielder) and .4559 (player 1 – goalkeeper) in the 3rd ma -tch; .5546 (player 16 – forward) and .5395 (player 18 – central defender) in the 4th match; and .6129 (player 1 – goalkeeper) and 0.6065 (player 13 – left midielder) in the 5th match.
‘Micro’ analysis
The network centroid can be deined by its central location in a network (Horvath, 2011). The centroid was deined as one of the most highly connected nodes in the network. The centroid values can be seen in the Table 5.
The centroid players in the 1st match were player 12 (ri-ght defender) and player 3 (central defender). Players 5 (left defender) and 9 (right defender) were the centroids in the 2nd match. In the 3rd match the centroid players were player 19 (left defender) and player 4 (central defender). The centroid players in the 4th match were player 7 (midielder) and player 12 (right defender). Lastly, the players 3 (central defender) and 12 (right defender) were the centroids in the 5th match.
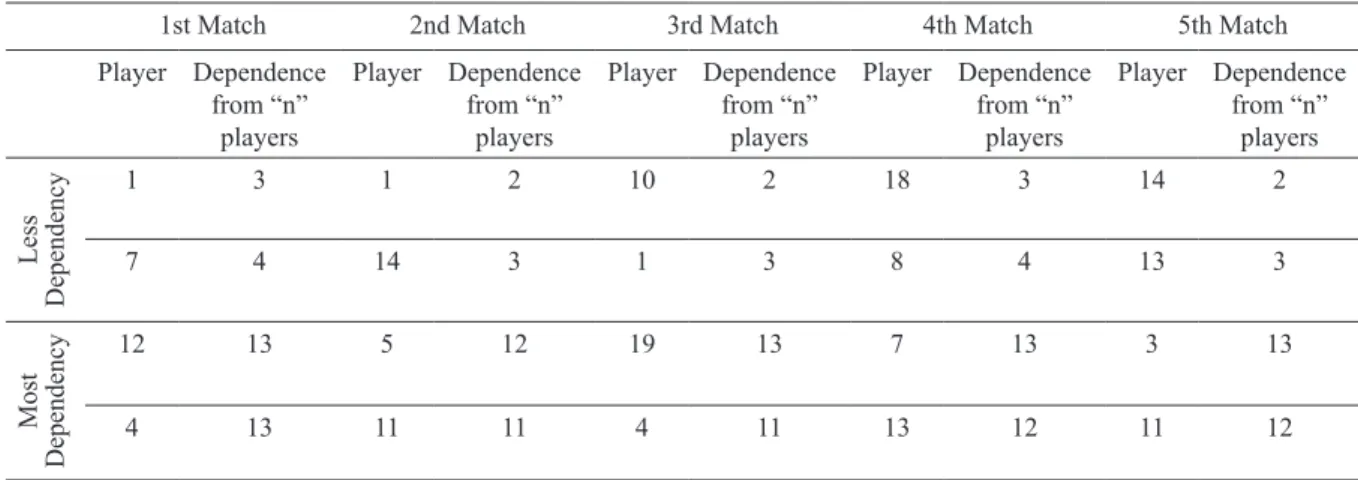
Despite the importance of the centroid player(s), it is also important to understand the dependency between players. The -refore, a topological inter-dependency metric was performed. Considering the high volume of results, only the most important will be presented (Table 6).
In the 1st match, the players with the least dependency were the goalkeeper (1), only depending on three players, and the midielder (7) and striker (20), each depending on four players. The players with the most dependency were the right defender (12), depending on all players, and the central defender (4).
1st Match
2nd Match
3rd Match
4th Match
5th Match
Overall
Player 1 .533 .544 .456 .497 .613** .529 Player 2 .509 .560 .447 - - .505 Player 3 .499 .571 .454 .494 .434* .490 Player 4 .471* .532 .434 - .542 .495 Player 5 .478 .506 - .492 .530 .502
Player 6 - .531 .524** - - .528
Player 7 .597 .510 .480 .428* .488 .501 Player 8 .541 .478* .418 .499 .534 .494 Player 9 .524 .520 .455 - .561 .515 Player 10 .454 .601 .440 - .527 .505 Player 11 - .502 .430 .497 .477 .477
Player 12 .474 - - .466 .494 .478
Player 13 .456 .640** .452 .463 .607 .524 Player 14 .598 .502 .402 .443 .495 .488
Player 15 - - .412 .454 - .433
Player 16 .605** - - .555** .540 .567**
Player 17 - - - .521 .568 .544
Player 18 - - - .540 - .540
Player 19 - - .397* - - .397*
Player 20 .535 - - - - .535
Player 21 - - - .455 - .455
Overall .520 .538 .443 .486 .529 .500 Table 4. Clustering coeficient of each player for all matches.
*Lowest value and ** Highest value
1st Match
2nd Match
3rd Match
4th Match
5th Match
Overall
Player 1 .256 .200 .207 .500 .739 .380
Player 2 .846 - .759 - - .802
Player 3 .897 .750 .759 .962 1.000** .874 Player 4 .846 .800 .828 - .913 .847 Player 5 .769 1.000** - .115* .174 .515
Player 6 - .800 .379 - - .590
Player 7 .333 .600 .586 1.000** .870 .678 Player 8 .692 .150* .655 .308 .217 .405 Player 9 .795 .900 .552 - .783 .757 Player 10 .205 .600 .138* - .870 .453 Player 11 - .750 .241 .423 .870 .571 Player 12 1.000** .650 - 1.000** 1.000** .913 Player 13 .103* .350 .310 .885 .478 .425 Player 14 .539 .150* .517 .731 .174* .422
Player 15 - - .793 .539 - .666
Player 16 .615 - - .539 .478 .544
Player 17 - - - .154 .435 .294
Player 18 - - - .269 - .269*
Player 19 - - 1.000** - - 1.000**
Player 20 .282 - - - - .282
Player 21 - - - .731 - .731
Overall .584 .592 .552 .582 .643 .591 Table 5. Centroid values of each player for all matches.
The topological interdependency performed for the 2nd match showed that the least dependent players were the goalkeeper (1), just depending on two players, and the midielder (14), depending on three. The most dependent players were the left defender (5), depending on all players, and the striker (11), depending on all but one.
The results from the 3rd match showed that the forward (10) and goalkeeper (1) were the least dependent players. On the other hand, the left defender (19) was the player with the highest dependency on the other players.
In the 4th match the most dependent players were the midiel-der (7) and the left midielmidiel-der (13). The less dependent players were the central defender (18) and the left midielder (8).
Lastly, in the 5th match the less dependent players were the midielder (14) and the left midielder (13). On the other hand, the most dependent players were the central defender (3) and the striker (11).
Discussion
This paper aimed to analyze the network properties of a football team by applying some metrics. Those metrics were proposed for two main levels of analysis: i) ‘meso’ level; and ii) ‘micro’ level. At the meso level of analysis, two methods
were used: i) the scaled connectivity and ii) the clustering coeficient. Both metrics are between the ‘macro’ and ‘micro’ level analysis, thus providing information about global position in relation to the team.
The scaled connectivity was performed to analyze how each player interacts and connects with his teammates. The results suggested that the defenders (lateral and central) and midielders are the players with the most connectivity with their teammates. Thus, it is possible to discuss that the offensive building style of the team is based on support play, mainly in the irst half. Therefore, it is normal and understandable that the defenders and midielder players connect more with each other. In a regu-lar way, the less-pressed area is the team’s half ield (Fonseca, Milho, Travassos, & Araújo, 2012). Thus, it is easier to interact with higher frequency with the players that belong to this half ield (i.e., the defenders and the midielders). Moreover, the
midielder players and the lateral defenders, who many times support the offensive actions by the lateral allowing the lateral midielders to occupy more central areas, act as links between the defense and the attack (Bloomield, Polman, & O’Donoghue, 2007; Reilly & Thomas, 1976). Nevertheless, the connectivity is not the homogeneous type previously analyzed that suggests a tendency of clusters emerging inside the team. Therefore, a clustering coeficient analysis was performed in order to identify the players that contribute most to the generation of clusters.
The players with the highest clustering coeficients were the goalkeeper, wing midielders, and the forwards. As previously described, greatest values of clustering coeficient means the greatest cooperation among teammates around a speciic player. Thus, the results suggest that those players (goalkeeper, wing midielders and forwards) participate in more attacking plays that involve a large number of teammates. Another interesting result showed that the majority of the players with higher clus-tering coeficient values had low connectivity values. Therefore, the results suggest that despite the reduction in global connecti -vity, these players participate in offensive plays with teammates who also have a higher level of interaction with each other. This is also important because it can generate a higher participation of all players in the offensive play, increasing the possibilities for new solutions and reducing the clusters inside the team. In the speciic case of goalkeeper, it is possible to discuss that the attacking plays that involves such player had more possibility to include more players mainly in the defensive region where the opponent’s defensive pressing is not too great. Such process may increases the participation of more teammates, thus justifying the great clustering coeficient of goalkeeper.
The team’s analysis is not complete until individual partici-pation and interaction have been explored at the ‘micro’ level. Therefore, the players that contribute the most to the offensive plays and cooperation were analyzed and also the dependency between teammates was explored. The results suggested that the lateral defenders (mainly the right defender), central defenders, and the midielders are the centroid players. These results conirm the higher connectivity of these positions and their preponderance to build the offensive plays. Moreover, the results also conirm the lower values for the lateral midielders, forwards, and stri-kers. Thus, the defenders and central midielders are the players
1st Match 2nd Match 3rd Match 4th Match 5th Match
Player Dependence from “n”
players
Player Dependence from “n”
players
Player Dependence from “n”
players
Player Dependence from “n”
players
Player Dependence from “n”
players
Less
Dependency
1 3 1 2 10 2 18 3 14 2
7 4 14 3 1 3 8 4 13 3
Most
Dependency
12 13 5 12 19 13 7 13 3 13
4 13 11 11 4 11 13 12 11 12
that generate offensive plays with more frequency. This can be explained by two main factors. The irst is related to the type of the defensive strategy. If the team opts to press closer to its own goal, the ball will be recovered by the defenders or midielders in the defensive zone, thus increasing their participation in the offensive plays. The second explanation is related to the team’s own offensive strategy. If the team opts to build the offensive play around their defenders in order to ‘attract’ the opponents out of their defensive zone, it would be expected that the higher cen-tralization of play would be with the defenders and midielders. Nevertheless, the centroid players are not the only important aspect to consider in order to understand how players connect with each other. The centroid provides useful information for understanding who the most prominent players are in building the offensive plays. This information can help the opponent team understand the main players that generate the attack. However, the dependency between players can also be important to im -prove the understanding about intra-team relationships. Thus, the topological interdependency metric was calculated.
The most independent players in a regular way during all matches analyzed were the midielders. These results suggest that midielders are the players that can connect with any other player on the team most easily. Observing the behavior of defenders, it is possible to understand that the offensive play needs to pass by the midielder players in order to reach the offensive zone. Thus, it is normal that the defenders are not the most independent players. Moreover, the forward players alone cannot be the most independent players because the players that most usually recover balls during the matches are the defenders and midielders. Therefore, forward players need someone (i.e., teammates) in order to recover the ball and generate the
offensive plays. Thus the dependency can be a useful tool to understand how to ‘block’ the offensive plays of the opponent team. Moreover, when associated with other network concepts (e.g., centroid player) the relative topological dependency allows for the identiication of possible dependencies between players and even hierarchical relations. As a result, the herein proposed script returns the centroid conformity as well as the topological overlap of a given player’s network.
This pilot study had a set of limitations due by their own characteristics. One of the main limitations was the sample. In fact, ive games could be too small to generalize the results as recommended. Moreover, these metrics were not applied until now in other studies that used the network approach. Thus, the speciic results of this pilot study cannot be compared with other network studies on football. Therefore, it is quite important to increase the sample and the application of such metrics in further studies in order to establish some comparisons between studies and to determine the best methods to apply in a sports context.
Despite the study’s limitations, a new solution for match analysis emerges from the network. In fact, using a simple observational method that records the interaction between te -ammates can originate a great opportunity to quickly identify the properties of the team style of play. Such analysis does not replace the traditional notational analysis. In fact, for their own properties, the network analysis is per se a new vision for football analysis thus increasing the range of observation.
Nevertheless, a great research investment must be performed to consolidate the network as a match analysis method. Thus, new studies using similar approaches should be undertaken in the future to compare similar results and to compare the eficacy of the results. Moreover, software dedicated to analyzing the match and recording the interactions between teammates would be a very useful solution for generalizing this method. In fact, until now, only general statistical solutions based on a network have been developed. Thus, speciic software dedicated to network analysis in sports could be the next step forward to consolidate this method. Using such an analysis could be possible in the future to reduce the time expended in the observational and paper-and-pencil analysis, thus providing new solutions and possibilities for coaches and sports analysts. As future work, it would be interesting to identify how the team’s networks are built based on the speciic region of the ield. Moreover, it would be interesting to analyze only the network that resulted in goals or shots suffered and scored. Another interesting study would be to identify the defensive coverage between teammates and even the defensive coverage against the opponents.
Conclusion
Two main kinds of analysis about the network were perfor -med in this study: i) ‘meso’ analysis; and ii) ‘micro’ analysis. The scaled connectivity and the clustering coeficient were applied for the ‘meso’ analysis. Using such methods, it was possible to identify that the defenders (lateral and central) and midielders are the players with the most connectivity with their teammates. Lastly, the centroid signiicance and conformity and the typological overlapping that were measured were applied to the ‘micro’ analysis. The results reveal that the lateral defenders (mainly the right defender), central defenders, and midielders are the centroid players of the team. The most independent players in a regular way during all matches analyzed were the midielders. Such results suggest that while the midielders are the most independent players during the match, they are also the players that interact most with the remaining teammates. In sum, this pilot study proposed a set of network metrics that can increase the range of match analysis, complementing the traditional notational analysis and giving new solutions to un -derstanding the teammates’ interactions during a match.
References
Albert, R., Jeong, H., & Barabasi, A. L. (2000). Error and attack tole-rance of complex networks. Nature, 406, 378-382.
Araújo, D., Davids, K., Bennett, S., Button, C., & Chapman, G. (2004). Emergence of sport skills under constraint. In A. Williams, & N. Hodges, Skill acquisition in sport: Research, Theory and Practice (pp. 409-433). London: Routledge, Taylor & Francis.
Bloomield, J., Polman, R., & O’Donoghue, P. (2007). Physical de-mands of different positions in FA Premier League football. Journal of Sports Science and Medicine, 6, 63-70.
Carling, C., Reilly, T., & Williams, A. (2009). Performance assessment
for ield sports. London: Routledge.
Clemente, F. M., Couceiro, M. S., Martins, F. M., & Mendes, R. (2013). An online tactical metrics applied to football game. Rese-arch Journal of Applied Sciences, Engineering and Technology, 5, 1700-1719.
Couceiro, M. S., Clemente, F. M., & Martins, F. M. (2013). Towards the evaluation of research groups based on scientiic co-authorship networks: The RoboCorp case study. Arab Gulf Journal of Scientiic Research, 31, 36-52.
Duarte, R., Araújo, D., Correia, V., & Davids, K. (2012). Sports teams as superorganisms: Implications of sociobiological models of behaviour for research and practice in team sports performance analysis. Sports Medicine, 42, 633-642.
Duch, J., Waitzman, J. S., & Amaral, L. A. (2010). Quantifying the performance of individual players in a team activity. PLoS ONE, 5, e10937.
Estrada, E. (1995). Edge adjacency relationships in molecular graphs containing heteroatoms: A new topological index related to mo -lecular volume. Journal of Chemical Information and Computer Science, 35, 701-707.
Fajen, B. R., Riley, M. R., & Turvey, M. T. (2009). Information, affordances, and control in sport. International Journal of Sports Psychology, 40, 79-107.
Fiduccia, C. M., & Mattheyses, R. M. (1982). A linear-time heuristic for improving network partitions. 19th Design Automation Conference, IEEE, (pp. 175-181). Schenectady, NY.
Fonseca, S., Milho, J., Travassos, B., & Araújo, D. (2012). Spatial dynamics of team sports exposed by Voronoi diagrams. Human Movement Science, 31, 1652–1659.
Fortunato, S. (2010). Community detection in graphs. Physics Reports, 486, 75-174.
Gréhaigne, J. F. (1992). L’organisation du jeu en football. Joinville-le -Pont, France: Éditions Actio.
Gréhaigne, J. F., & Godbout, P. (1995). Tactical knowledge in team sports from a constructivist and cognitivist perspective. Quest, 47, 490-505.
Gréhaigne, J. F., Bouthier, D., & David, B. (1997). Dynamic-system analysis of opponent relationship in collective actions in football. Journal of Sports Sciences, 15, 137-149.
Gréhaigne, J. F., Godbout, P., & Bouthier, D. (1999). The foundations of tactics and strategy in team sports. Journal of Teaching in Physical Education, 18, 159-174.
Gréhaigne, J. F., Godbout, P., & Zerai, Z. (2011). How the “rapport de forces” evolves in a football match: The dynamics of collec -tive decisions in a complex system. Revista de Psicología del Deporte, 20, 747-765.
Gréhaigne, J. F., Richard, J. F., & Grifin, L. (2005). Teaching and learning team sports and games. New York: Routledge Falmar. Grunz, A., Memmert, D., & Perl, J. (2009). Analysis and simulation
of actions in games by means of special self-organizing maps. International Journal of Computer Science in Sport, 8, 22-36. Grunz, A., Memmert, D., & Perl, J. (2012). Tactical pattern recognition
in football games by means of special self-organizing maps. Human Movement Science, 31, 334-343.
Hespanha, J. P. (2004). An eficient MATLAB algorithm for graph
partitioning. University of California.
Horvath, S. (2011). Weighted Network Analysis: Applications in
Ge-nomics and Systems Biology. New York: Springer.
Hughes, M., & Franks, I. M. (2004). Notational analysis – a review of the literature. In M. Hughes, & I. M. Franks, Notational analysis of sport: Systems for better coaching and performance in sport (pp. 59-106). New York: Routledge.
Hughes, M., & Franks, M. (2004). Notational analysis of sport: Systems for better coaching and performance in sport. New York, NY: Routledge. Lim, C., Bohacek, S., Hespanha, J., & Obraczka, K. (2005). Hierar-chical max-low routing. Global Telecommunications Conference
- GLOBECOM ‘05 IEEE. Los Angeles, CA.
Malta, P., & Travassos, B. (2014). Characterization of the defense-at-tack transition of a soccer team. Motricidade, 10, 27-37. McGarry, T. (2005). Soccer as a dynamical system: Some theoretical
considerations. In T. Reilly, J. Cabri, & D. Araújo, Science and Football V (pp. 570-579). London and New York: Routledge, Taylor & Francis Group.
McGarry, T., Anderson, D., Wallace, S., Hughes, M., & Franks, I. (2002). Sport competition as a dynamical self-organizing system. Journal of Sports Sciences, 20, 771-781.
Memmert, D., & Perl, J. (2009). Game creativity analysis using neural networks. Journal of Sports Sciences, 27, 139-149.
Metzler, J. (1987). Fondements théoriques et pratiques d’une démarche d’enseignement des sports collectifes. Spirales, 1 (Complément), 143-151.
Parrish, J., & Edelstein-Keshet, L. (1999). Complexity, pattern, and evolutionary trade-offs in animal aggregation. Science, 284, 99-101. Passos, P., Araújo, D., Davids, K., Gouveia, L., & Serpa, S. (2006).
Interpersonal dynamics in sport: The role of artiicial neural ne-tworks and 3-D analysis. Behavior Research Methods, 38, 683-691. Passos, P., Davids, K., Araújo, D., Paz, N., Minguéns, J., & Mendes,
J. (2011). Networks as a novel tool for studying team ball sports as complex social systems. Journal of Science and Medicine in Sport, 14, 170-176.
Ravasz, E., Somera, A. L., Mongru, D. A., Oltvai, Z. N., & Barabasi, A. L. (2002). Hierarchical organization of modularity in metabolic networks. Science, 297, 1551-1555.
Reilly, T., & Thomas, V. (1976). A motion analysis of work-rate in dif-ferent positional roles in professional football match-play. Journal of Human Movement Studies, 2, 87-97.
Reimer, T., Park, E. S., & Hinsz, V. B. (2006). Shared and coordina-ted cognition in competitive and dynamic task environments: An information-processing perspective for team sports. International Journal of Sport and Exercise Psychology, 4, 376-400.
Salas, E., Dickinson, T. L., Converse, S. A., & Tannenbaum, S. I. (1992). Toward an understanding of team performance and trai-ning. In Swezey, R. W., & E. Salas, Teams: Their training and performance (pp. 3–29). Norwood, NJ: Ablex.
Watts, D. J. (2002). A simple model of global cascades on random networks. Proceedings of the National Academy of Sciences of the United States of America, 99, 5766–5771.
Wu, M. (2009). wgPlot-Weighted Graph Plot. MatLab Central File Ex-change. Retrieved January 10, 2012, from http://www.mathworks. com/matlabcentral/ileexchange/24035
Authors’ note
Filipe Manuel Clemente (ilipe.clemente5@gmail.com) is afiliated with the Polytechnic Institute of Coimbra, ESEC, Department of Education, Polytechnic Institute of Coimbra, RoboCorp, ASSERT. He is also afiliated with the Faculty of Sport Sciences and Physical Education, University of Coimbra, Portugal.
Fernando Manuel Lourenço Martins (fmlmartins@esec.pt) is afiliated with the Instituto de Telecomunicações, Delegação da Covilhã. He is also afiliated with the Polytechnic Institute of Coimbra, ESEC, De-partment of Education; and with the Polytechnic Institute of Coimbra, RoboCorp, ASSERT, Portugal.
Rui Sousa Mendes (rmendes@esec.pt) is afiliated with the Polytech-nic Institute of Coimbra, ESEC, Department of Education, and he is also afiliated with the Polytechnic Institute of Coimbra, RoboCorp, ASSERT, Portugal.
Acknowledgements
This work was supported by FCT project PEst-OE/EEI/LA0008/2013 and by a PhD scholarship (SFRH/BD /73382/2010) by the Portuguese Foundation for Science and Technology (FCT). Also, this work was made possible with the support and assistance of Carlos Figueiredo and Monica Ivanova. The authors would like to thank them for their cooperation and advice that were vital to fulil some works of tech-nical nature. This work was supported by FCT project PEst-OE/EEI/ LA0008/2013.
Corresponding author
Filipe M. Clemente:
Polytechnic Institute of Coimbra, Coimbra College of Education, Department of Education, Portugal
http://www.researchgate.net/proile/Filipe_Clemente, E-mail: ilipe.clemente5@gmail.com
Manuscript received on September 26, 2013 Manuscript accepted on May 31, 2014