DOI: 10.4025/jphyseduc.v27i1.2741
Original Article
CAN ANTHROPOMETRIC MEASURES DISCRIMINATE BIOCHEMICAL FACTORS IN PHYSICALLY ACTIVE WOMEN OVER THE AGE OF 50 YEARS?
MEDIDAS ANTROPOMÉTRICAS DISCRIMINAM FATORES BIOQUIMICOS EM MULHERES ACIMA DE 50 ANOS PRATICANTES DE ATIVIDADE FÍSICA?
Daniel Rogério Petreça1,2, Eduardo Hauser1, Eduardo Capeletto1, Fabiano José Santana2, Monique da Silva Gevaerd1and Giovana Zarpellon Mazo1
1Universidade do Estado de Santa Catarina, Florianópolis-SC, Brasil. 2
Universidade do Contestado, Mafra-SC, Brasil.
RESUMO
No Brasil, são encontrados maiores índices de sobrepeso e obesidade na faixa etária de 55 a 64 anos. Nesse sentido, tais distúrbios da composição corporal podem associar-se às alterações metabólicas, tornando-se relevante investigar quais as medidas antropométricas podem discriminar níveis de alterações bioquímicas. O objetivo deste estudo foi analisar por meio da sensibilidade e especificidade se variáveis antropométricas são discriminadoras de alterações bioquímicas de colesterol, triglicerídeos e glicemia em mulheres acima de 50 anos praticantes de atividade física. Participaram 139 mulheres com 50 anos ou mais de idade praticantes de atividade física regular. As variáveis antropométricas analisadas foram: Índice de Massa Corporal (IMC); Perímetro de Cintura (PC); Razão cintura-quadril (RCQ); razão cintura estatura (RCE); Índice de conicidade (IC) e percentual de Gordura (%G). As variáveis bioquímicas analisadas foram: Glicemia (GL); Triglicerídeos (TG) e colesterol total (CT). Foi utilizada a estatística descritiva e a curva ROC. Como resultado, IMC, PC, RCQ, RCE e %G discriminaram GL aumentada. A RCQ discriminou TG aumentada e nenhuma variável antropométrica discriminou CT aumentada. Conclui-se que o risco aumentado de alterações bioquímicas, glicemia e triglicerídeos, podem ser discriminadas por algumas variáveis antropométricas em mulheres acima de 50 anos praticantes de atividade física.
Palavras-chave: Antropometria. Atividade Motora. Composição Corporal.
ABSTRACT
In Brazil, higher rates of overweight and obesity are observed in the age group of 55-64 years. These body composition disorders may be associated with metabolic changes and it is therefore important to investigate which anthropometric measures can discriminate levels of biochemical changes. The aim of this study was to analyze by means of sensitivity and specificity if anthropometric variables can discriminate biochemical changes in cholesterol, triglycerides and glucose in physically active women over the age of 50 years. A total of 139 women aged 50 years and older who take part in regular physical activity participated in the study. The following anthropometric variables were analyzed: body mass index (BMI), waist circumference (WC), waist-to-hip ratio (WHR), waist-to-height ratio (WHtR), conicity index, and body fat percentage (BF%). The biochemical variables analyzed were blood glucose, triglycerides, and total cholesterol (TC). Descriptive statistics and ROC curves were used. The results showed that BMI, WC, WHR, WHtR and BF% were able to discriminate increased blood glucose. The WHR discriminated elevated triglycerides, while none of the anthropometric variable was able to discriminate increased TC. In conclusion, some anthropometric variables can be used to identify an increased risk of biochemical changes, such as elevated blood glucose and triglycerides, in physically active women over the age of 50 years. Keywords: Anthropometry. Body composition. Motor Activity.
Introduction
Over the age of 50 years, women show a greater predisposition to metabolic changes than men1. This increased predisposition can be attributed to the arrival of the postmenopausal period, which is responsible for different physiological alterations in the female body2. Consequently, postmenopausal women are at a higher risk of having metabolic disorders3.
status, smoking, physical activity level, inadequate diet, and body composition disorders1. Elevated serum levels of biochemical parameters such as triglycerides, total cholesterol, and fasting glucose are also risk factors for metabolic disorders and cardiovascular diseases5-7.
Within this context, body composition disorders such as overweight and obesity, in addition to being associated with metabolic changes8, are also considered a problem of pandemic proportion because of the high prevalences found9. In Brazil, the highest rates of overweight and obesity are observed in the age group of 55 to 64 years10. Studies designed to identify risk factors for the development of metabolic changes are important to raise the awareness of the population to improve their health condition11,12. In this respect, anthropometric measurements such as body mass index (BMI), conicity index (CI), waist circumference (WC), waist-to-hip ratio (WHR), waist-to-height ratio (WHtR) and body fat percentage (BF%)13-15 may be useful to discriminate biochemical alterations because of their practicality and low operational cost16,17.
Based on this assumption, it is necessary to investigate which anthropometric measures are most indicated to discriminate biochemical changes since the pattern of body fat distribution has been shown to be a determinant factor for defining an individual’s metabolic profile18. In this respect, only anthropometric measures will permit referral for further evaluation and monitoring so that the most appropriate treatments and interventions can be implemented. Furthermore, exercise in women over the age of 50 years has been shown to be effective in reducing anthropometric variables and biochemical alterations2,19, but specific studies involving this population are necessary.
Therefore, the objective of the present study was to analyze by means of sensitivity and specificity if anthropometric variables can discriminate biochemical changes in cholesterol, triglycerides, and glucose in physically active women over the age of 50 years.
Methods
Study Design
This was a cross-sectional, observational study with analysis of quantitative data.
Participants
Approximately 200 individuals taking part in physical activities of the Programa Mafra em Forma conducted by the Municipal Health Department through the Gyms for Senior Citizens (ATI in the Portuguese acronym) project participated in the study. The objective of the ATI is to provide stretching, muscle strengthening, and aerobic exercises21. The ATI are offered at two squares of the town and consist of 10 physical activity devices: stretching place, rowing machine, walker machine, shoulder rotator, rider, ski machine, leg press, extensor, flexor, and development). The subjects are invited at the Basic Health Units. People older than 50 years can participate. The activities are supervised and monitored by Physical Education professionals and students and are performed in circuit training comprising stretching and warm-up, main part (strength exercises), and relaxation.
Nonprobability purposive sampling was used for this study. The following inclusion criteria were adopted: age of 50 years or older, female gender, participation in the ATI project for at least 6 months, and a class attendance of at least 75%. Thus, 139 women aged 50 years and over who took part in regular physical activity participated in the study.
Instruments and Data Collection
The following instruments, respectively, were used for the determination of body weight, height and waist and hip circumferences: Welmy® scale; WCS® wall-mounted stadiometer on a flat surface; Cescorf® anthropometric measurement tape. The anthropometric measurements were obtained according to the protocol of the International Society for the Advancement of Kinanthropometry (ISAK)22.
The BMI was obtained by dividing the body weight (kg) by the square of the height (m). For the determination of WHR, WC (cm) was divided by hip circumference (cm). The WHtR was calculated by dividing WC (cm) by height (cm). The following equation was used to determine the CI: WC (cm)/0.019 x square root of body weight (kg)/height (m). BF% was measured using the protocol for body density as described by Tran and Weltman23,34 and the equation of Brozek et al.25.
Table 1 shows the reference values used to classify the anthropometric and metabolic
variables as “risk condition”.
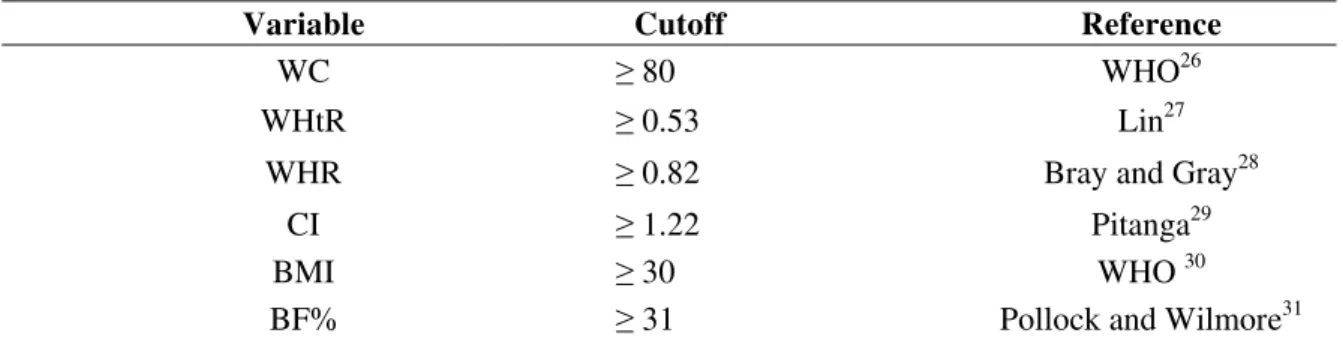
Table 1. Reference values of the anthropometric and metabolic variables used to define a health risk in women.
Variable Cutoff Reference
WC ≥ 80 WHO26
WHtR ≥ 0.53 Lin27
WHR ≥ 0.82 Bray and Gray28
CI ≥ 1.22 Pitanga29
BMI ≥ 30 WHO 30
BF% ≥ 31 Pollock and Wilmore31
WC = waist circumference (cm); WHtR = waist-to-height ratio; WHR = waist-to-hip ratio; CI = conicity index; BMI = body mass index (kg/m²); BF% = body fat percentage;. The assessment criteria were grouped for the definition of health risk: waist circumference (“moderate risk” and “high risk”); BMI(“obesity I”, “obesity II”, and “morbid obesity”).
Source: The authors.
The anthropometric evaluations occurred in the second week of March, 2012, and were conducted by previously trained (12 hours of training) Physical Education students. After the anthropometric measurements, the participants had an interval of 2 weeks for collection of the biochemical variables.
Biochemical Variables
The biochemical variables analyzed in this study were fasting glucose, triglycerides, and total cholesterol. The blood collections and biochemical analyses were performed by a clinical analysis laboratory in the town of Mafra, SC. For the analysis of serum fasting glucose, triglycerides and total cholesterol, approximately 5 ml venous blood samples were collected from the participants for the separation of serum. The analyses were carried out by a colorimetric enzymatic method using specific kits (Biotécnica®, Belo Horizonte, MG, Brazil). The reactions were read in a BTLyzer 100 spectrophotometer (Biotécnica®, Belo Horizonte, MG, Brazil) at a wavelength of 500 nm and the results are expressed as milligram per deciliter blood (mg/dL).
The following cutoffs were used for the biochemical variables: glucose, ≥ 100 mg/dl below and above the recommended); triglycerides, > 200 (“high” and “very high”); total cholesterol, > 239 (“borderline” and “high”)32.
Ethical Aspects
The study was approved the Ethics Committee on Research Involving Humans of Universidade do Contestado (UnC) (Protocol 192/10). All participants received information about the objective of the study and signed the free informed consent form.
Data Analysis
Descriptive statistics (frequency, mean, and standard deviation) was used for analysis of the data. Receiver operating characteristic (ROC) curves were utilized to verify the sensitivity and specificity for each cutoff between the biochemical and anthropometric variables. Still, it was identified the total area under the curve and statistical significance. The better sensitivity and specificity values corresponded to the cutoffs between the biochemical and anthropometric variables. A 95% confidence interval was used for all analyses.
Results
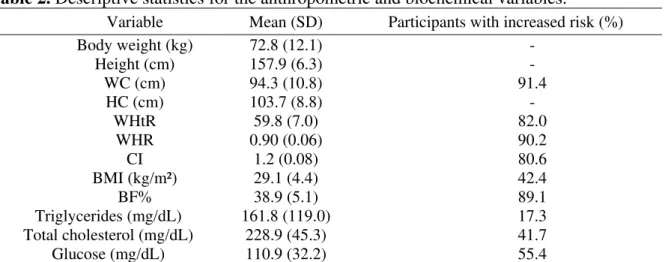
A total of 139 women with a mean age of 62.2 (SD=7.3) years participated in the study. Table 2 shows the descriptive statistics for the anthropometric (BMI, WC, CI, WHR, WHtR, and BF%) and biochemical variables (triglycerides, total cholesterol, and blood glucose) and the frequency of a risk condition.
Table 2. Descriptive statistics for the anthropometric and biochemical variables.
Variable Mean (SD) Participants with increased risk (%)
Body weight (kg) 72.8 (12.1) -
Height (cm) 157.9 (6.3) -
WC (cm) 94.3 (10.8) 91.4
HC (cm) 103.7 (8.8) -
WHtR 59.8 (7.0) 82.0
WHR 0.90 (0.06) 90.2
CI 1.2 (0.08) 80.6
BMI (kg/m²) 29.1 (4.4) 42.4
BF% 38.9 (5.1) 89.1
Triglycerides (mg/dL) 161.8 (119.0) 17.3
Total cholesterol (mg/dL) 228.9 (45.3) 41.7
Glucose (mg/dL) 110.9 (32.2) 55.4
WC = waist circumference; HC = hip circumference; WHtR = waist-to-height ratio; WHR = waist-to-hip ratio; CI = conicity index; BMI = body mass index; BF% = body fat percentage; SD = standard deviation.
Source: The authors.
Analysis of the frequency of the anthropometric variables showed an increased risk among 91.4% of the subjects for WC, 90.2% for WHR, and 89.1% for BF%. Regarding the biochemical variables, 55.4% of the participants exhibited an unacceptable blood glucose level.
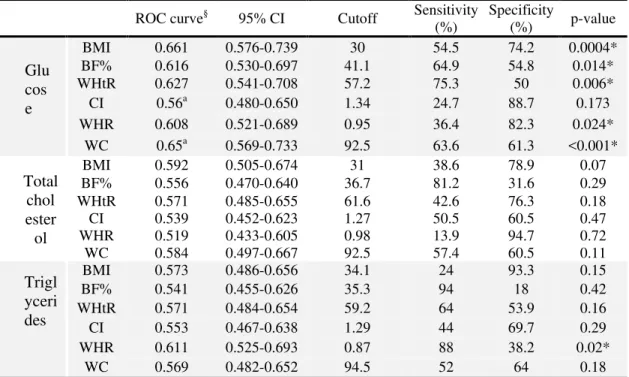
Table 3. ROC curve values, cutoffs, sensitivity and specificity, statistical differences between curves, and confidence intervals of the biochemical and anthropometric variables.
ROC curve§ 95% CI Cutoff Sensitivity
(%) Specificity (%) p-value
BMI 0.661 0.576-0.739 30 54.5 74.2 0.0004*
BF% 0.616 0.530-0.697 41.1 64.9 54.8 0.014*
WHtR 0.627 0.541-0.708 57.2 75.3 50 0.006*
CI 0.56a 0.480-0.650 1.34 24.7 88.7 0.173
WHR 0.608 0.521-0.689 0.95 36.4 82.3 0.024*
WC 0.65a 0.569-0.733 92.5 63.6 61.3 <0.001*
BMI 0.592 0.505-0.674 31 38.6 78.9 0.07
BF% 0.556 0.470-0.640 36.7 81.2 31.6 0.29
WHtR 0.571 0.485-0.655 61.6 42.6 76.3 0.18
CI 0.539 0.452-0.623 1.27 50.5 60.5 0.47
WHR 0.519 0.433-0.605 0.98 13.9 94.7 0.72
WC 0.584 0.497-0.667 92.5 57.4 60.5 0.11
BMI 0.573 0.486-0.656 34.1 24 93.3 0.15
BF% 0.541 0.455-0.626 35.3 94 18 0.42
WHtR 0.571 0.484-0.654 59.2 64 53.9 0.16
CI 0.553 0.467-0.638 1.29 44 69.7 0.29
WHR 0.611 0.525-0.693 0.87 88 38.2 0.02*
WC 0.569 0.482-0.652 94.5 52 64 0.18
* = p<0.05. BMI = body mass index (kg/m²); BF% = body fat percentage; WHtR = waist-to-height ratio; CI = conicity index; WHR = waist-to-hip ratio; WC = waist circumference. §Variables followed by the same superscript letter present significant
differences between areas under the ROC curve. Source: The authors.
The largest areas under the ROC curve for glucose were obtained for BMI (0.661) and WC (0.654). The best cutoffs of these variables in the present study were 30 kg/m² and 92.5 cm, respectively. In this respect, BMI discriminated 54.5% of women with acceptable blood glucose and 74.2% with unacceptable blood glucose and WC discriminated 63.6% of women with acceptable blood glucose and 61.3% with unacceptable blood glucose. Comparison between ROC curves showed no statistically significant difference, except for CI and WC in relation to blood glucose.
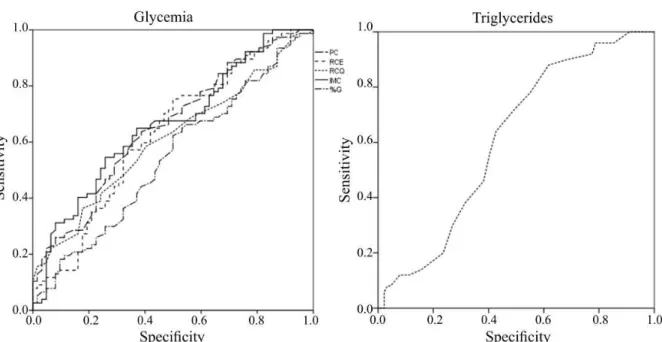
With respect to total cholesterol, none of the anthropometric variables was able to discriminate elevated levels of this biochemical variable. In the case of triglycerides, the WHR was able to discriminate altered levels, identifying 88% of women with acceptable triglyceride levels and 38.2% with unacceptable levels. However, there was no significant difference between WHR and the other variables analyzed. Figure 1 illustrates the area under the ROC curve between the biochemical and anthropometric variables for which a significant difference was obtained.
Glu cos e
Total chol ester ol
Figure 1. The area under the ROC curve between the biochemical and anthropometric variables for which a significant difference was obtained.
Source: The authors.
Discussion
The objective of this study was to analyze by means of sensitivity and specificity if anthropometric variables can discriminate biochemical changes in cholesterol, triglycerides and blood glucose in physically active women over the age of 50 years. The anthropometric variables WC, WHtR, WHR, BMI and BF% were able to discriminate increased blood glucose levels, while WHR was also able to discriminate elevated triglyceride levels. However, none of the anthropometric variables was able to discriminate elevated levels of total cholesterol.
Regarding the anthropometric variables, although the participants performed physical activity, a high percentage of the women were considered at risk situation by the cutoffs proposed in the literature, especially when BF%, WHR and WC were analyzed. This fact may have been a limitation of the study considering the homogeneity of the group.
Similarly, other studies investigating samples of women of the same age group also found a considerable number of subjects at an increased risk based on WHR33,34 and WC35.
However, based on BF%, less than 40% of the sample studied were considered to be “at risk”11.
These results can be explained by the fact that obesity in women is related to the postmenopausal period which, in turn, causes physiological alterations such as an increase in adipose tissue and a reduction in lean mass and bone mass. These alterations are caused by hormonal changes and can change the lipid profile2.
With respect to the biochemical variables, our results showed a higher prevalence of women with elevated total cholesterol and blood glucose levels when compared to the prevalence of elevated triglycerides. At the same proportion, another study demonstrated a higher prevalence of elevated total cholesterol (67.8%) compared to triglycerides (45.8%)35.
but not with abdominal circumference or BMI37. A study involving 102 older women ranging in age from 60 to 84 years found a significant association for total cholesterol only in the group older than 70 years, in which this parameter was associated with BMI, WHR and abdominal circumference38. It should be noted that abdominal circumference (measured 5 cm above the umbilical scar) was not used in the present study, but WC was measured as the smallest circumference between the 10th rib and iliac crest according to the procedure proposed by Stewart22.
In the present study, WHR was able to discriminate elevated triglycerides. A study involving subjects aged 15 to 64 years also found WHR to be the anthropometric variable that explained most of the variation in triglycerides39. Another study investigating associations between anthropometric variables and lipid profile in adult women concluded that the strongest relationship occurred between triglycerides and WHR14. In a study involving older adults from Saudi Arabia40, triglycerides were associated with WHR, BMI and abdominal circumference. A relationship of WHR and WC with triglycerides has also been reported in another study, but only in subjects older than 70 years38.
These findings agree with the results of the present study in which only WHR was able to discriminate elevated triglycerides. However, according to the literature12, caution is needed when this variable is used in older adults. According to that study, WHR is an inaccurate measure of internal fat and is influenced by hormonal changes12. In addition, WHR does not detect a proportional increase in the waist and hip, with the individual gaining weight while its initial and final WHR are the same. Thus, although WHR significantly discriminated elevated triglyceride levels, the results obtained for the population studied should be viewed with caution considering that the women of the present study were older than 50 years.
With respect to blood glucose levels, except for CI, the anthropometric variables were able to discriminate increased glucose levels. Divergent results regarding this association have been reported in the literature. A study evaluating the relationship of blood glucose with BF%, abdominal circumference and BMI found an association with abdominal circumference and BMI, but not with BF%37. In another study36, the only variable associated with blood glucose was abdominal circumference. Based on this finding, the authors highlighted the determinant role of blood glucose in the accumulation of fat in the central region of the body. A cross-sectional study38 corroborated this finding by showing a significant association of fasting glucose with BMI, WHR and abdominal circumference in older adults aged 60 to 69 years. However, another study14 found no association between blood glucose and anthropometric variables. However, the present findings demonstrate that anthropometric variables can be indicators of increased blood glucose.
Corroborating our findings, according to the guidelines of the Brazilian Diabetes Society41, obesity, and central obesity is a predictive factor of insulin resistance and BMI and WC are correlated with blood glucose levels. According to the literature42, anthropometric and biochemical measures are important for evaluating nutritional status and the evolution of diabetic subjects since they help monitor possible changes and identify the most appropriate dietary treatment
One limitation of the present study was the fact that only total cholesterol was measured, which may be a limited prognostic value in women who frequently exhibit elevated levels of high-density lipoprotein-cholesterol (HDL-C) and in subjects with diabetes or metabolic syndrome who often progress to low HDL-C levels32.
Anthropometric variables can discriminate some biochemical changes in physically active women over the age of 50 years. The anthropometric variables studied (WC, WHtR, WHR, BMI, and BF%) were able to discriminate increased blood glucose, while only WHR was able to discriminate elevated triglycerides in women. In addition, none of the anthropometric variables was able to discriminate increased levels of total cholesterol and a significant difference between curves was only observed for WC and CI in relation to blood glucose.
Taken together, the results suggest that the easy application of anthropometric measures makes them a low-cost alternative to verify increased blood glucose levels. However, further studies are needed to confirm the capacity of anthropometric evaluations to discriminate increased biochemical parameters. In addition, studies using total cholesterol fractions (HDL and LDL) and involving samples of women and men of other age groups should be conducted.
References
1. Mendes KG, Theodoro H, Rodrigues AD, Olinto MTA. Prevalência de síndrome
metabólica e seus componentes na transição menopáusica: uma revisão sistemática. Cad Saúde Pública 2012;28(8):1423-1437.
2. Chagas B, Federighi E, Bonfim MR, Brondino M, Cristina N, Monteiro HL. Exercício físico e fatores de risco cardiovasculares em mulheres obesas na pós-menopausa. Rev Bras Med Esporte 2015;21(1):65-69.
3. Eshtiaghi R, Esteghamati A, Nakhjavani M. Menopause is an independent predictor of metabolic syndrome in Iranian women. Maturitas 2010;65(3):262-266.
4. Cameron AJ, Shaw JE, Zimmet PZ. The metabolic syndrome: prevalence in worldwide populations. Endocrinol Metab Clin North Am 2004;33(2):351-375.
5. Sarwar N, Danesh J, Eiriksdottir G, Sigurdsson G, Wareham N, Bingham S, et al.
Triglycerides and the risk of coronary heart disease 10 158 incident cases among 262 525 participants in 29 western prospective studies. Circulation 2007;115(4):450-458.
6. Farzadfar F, Finucane MM, Danaei G, Pelizzari PM, Cowan MJ, Paciorek CJ, et al. National, regional, and global trends in serum total cholesterol since 1980: systematic analysis of health examination surveys and epidemiological studies with 321 country-years and 3· 0 million participants. The Lancet 2011;377(9765):578-586.
7. Fan J, Song Y, Wang Y, Hui R, Zhang W. Dietary glycemic index, glycemic load, and risk of coronary heart disease, stroke, and stroke mortality: a systematic review with meta-analysis. PloSone 2012;7(12):e52182.
8. Vieira EC, Peixoto MDRG, Silveira EAD. Aparecida da Silveira. Prevalence and factors associated with Metabolic Syndrome in elderly users of the Unified Health System. Rev Bras Epidemiol 2014;17(4):805-817.
9. Swinburn BA, Sacks G, Hall KD, McPherson K, Finegood DT, Moodie ML, et al. The global obesity pandemic: shaped by global drivers and local environments. The Lancet 2011; 378(9793):804-814.
11. Mota JF, Rinaldi AEM, Pereira AF, Orsatti FL, Burini R C. Indicadores antropométricos como marcadores de risco para anormalidades metabólicas. Cien Saude Colet
2011;16(9):3901-3908.
12. Benedetti TRB, Meurer ST, Morini S. Índices antropométricos relacionados a doenças cardiovasculares e metabólicas em idosos. Rev Educ Fís UEM 2012;23(1):123-130. 13. Rocha NPD, Siqueira-Catania A, Barros CR, Pires MM, Folchetti LD, Ferreira SRG.
Análise de diferentes medidas antropométricas na identificação de síndrome metabólica, com ou sem alteração do metabolismo glicídico. Arq Bras Endocrinol Metabol
2010:54(7):636-643.
14. Oliveira MAMD, Fagundes RLM, Moreira EAM, Trindade EBSDM, Carvalho TD. Relação de indicadores antropométricos com fatores de risco para doença cardiovascular. Arq Bras Cardiol 2010;94(4):478-485.
15. Pitanga FJG, Lessa I. Indicadores antropométricos de obesidade como instrumento de triagem para risco coronariano elevado em adultos na cidade de Salvador-Bahia. Arq Bras Cardiol 2005;85(1):26-31.
16. Matheus SC, dos Santos L, Behenck MS, Both DR. O uso da antropometria para avaliar a distribuição de gordura corporal de pacientes com HIV/AIDS. Arq Ciên Saúde
2015;22(1):64-69.
17. Neves EB, Ripka W L, Ulbricht L, Stadnik AMW. Comparação do percentual de gordura obtido por bioimpedância, ultrassom e dobras cutâneas em adultos jovens. Rev Bras Med Esporte 2013;19(5):323-327.
18. Weiss, R. Fat distribution and storage: how much, where, and how? Eur J Endocrinol 2007;157(1):S39-S45.
19. Buonani C, Rosa CSDC, Diniz TA, Christofaro DGD, Monteiro HL, Rossi F, et al. Prática de atividade física e composição corporal em mulheres na menopausa. Rev Bras Ginecol e Obstet 2013;35(4):153-158.
20. Gil, A.C. Como elaborar projetos de pesquisa. 5. ed. São Paulo: Editora Atlas; 2010. 21. Petreça DR, Rodrigues FH, Mazo GZ, Sandreschi PF, Antunes GA, Albino M. Mafra em
forma: a way to be healthy! 5th International Congress on Physical Activity and Public Healthy; 8-11 April 2014, Rio de Janeiro, Brazil. Anais (5th International Congress on Physical Activity and Public Healthy. 2014)
22. Stewart A, Marfell-Jones M, International Society for the Advancement of
Kinanthropometry. International standards for anthropometric assessment. ISAK: Lower Hutt, New Zealand; 2011, p. 48-80.
23. Tran, ZV, Weltman, A. Predicting body composition of men from girth measurements. Human biology 1988;60(1):167-175.
24. Tran, ZV, Weltman A. Generalized equation for predicting body density of women from girth measurements. Med Sci Sports Exerc 1989;21(1):101-104.
25. Brožek J, Grande F, Anderson JT, Keys, A. Densitometric analysis of body composition: revision of some quantitative assumptions. Ann N Y Acad Sci 1963;110(1):113-140. 26. World Health Organization. Division of Noncommunicable Diseases. Program me of
27. Lin WY, Lee LT, Chen CY, Lo H, Hsia HH, Liu IL, et al. Optimal cut-off values for obesity: using simple anthropometric indices to predict cardiovascular risk factors in Taiwan. Int J Obes Relat Metab Disord 2002;26(9):1231-1238.
28. Bray GA, Gray DS. Obesity. Part I-Pathogenesis. West J Med 1988;149(4):429-441. 29. Pitanga FJG. Antropometria na avaliação da obesidade abdominal e risco coronariano. Rev
Bras Cineantropom Desempenho Hum 2011;13(3):238-241.
30. World Health Organization. Obesity: preventing and managing the global epidemic. World Health Organization, 2000. [accessed 11 July 2016]. Available at
http://www.who.int/nutrition/publications/obesity/WHO_TRS_894/en/.
31. Pollock ML, Wilmore JH. Exercícios na Saúde e na Doença: Avaliação e Prescrição para Prevenção e Reabilitação. Rio de Janeiro: MEDSI; 1993.
32. Xavier HT, Izar MC, Faria Neto JR, Assad MH, Rocha VZ, Sposito AC, et al. V Diretriz brasileira de dislipidemias e prevenção da aterosclerose. Arq Bras Cardiol 2013;101(4):1-22.
33. Munaretti DB, Barbosa AR, Marucci MDFN, Lebrão ML. Hipertensão arterial referida e indicadores antropométricos de gordura em idosos. Rev Assoc Méd Bras 2011;57(1):25-30.
34. Santos CCB, Egito Carvalho SCB, Barros MVG. Indicadores antropométricos de obesidade abdominal: revisão dos artigos indexados na biblioteca SciELO. Rev Bras Cineantropom Desempenho Hum 2009;11(2):217-225.
35. Orsatti FL, Nahás EAP, Nahas-Neto J, Maestá N, Padoani NP, Orsatti CL. Indicadores antropométricos e as doenças crônicas não transmissíveis em mulheres na pós-menopausa da região Sudeste do Brasil. Rev Bras Ginecol Obstet 2008;30(4):182-189.
36. Glaner MF, Pelegrini A, Nascimento TBR. Perímetro do abdômen é o melhor indicador antropométrico de riscos para doenças cardiovasculares. Rev Bras Cineantropom Desempenho Hum 2011;13(1):1-7.
37. Rezende FAC, LEFPL, R, Ribeiro RDCL, Vidigal FDC, Vasques ACJ, Bonard IS, et al. Índice de massa corporal e circunferência abdominal: associação com fatores de risco cardiovascular. Arq Bras Cardiol 2006;87(6):728-34.
38. Reis Filho AD, Coelho CF, Voltarelli FA, Ferrari Junior JF, Ravagnani FCP, Fett WCR, et al. Associação entre variáveis antropométricas, perfil glicêmico e lipídico em mulheres idosas. Rev Bras Geriatr Gerontol 2011;14(4):675-686.
39. Gharakhanlou R, Farzad B, Agha-Alinejad H, Steffen LM, Bayati M. Medidas
antropométricas como preditoras de fatores de risco cardiovascular na população urbana do Irã. Arq Bras Cardiol 2012;98(2):126-135.
40. Alhamdan, AA. Body mass index, waist, waist to hip ratio and lipid profile in elderly subjects living in a nursing home. J Med Sci 2008;8(2):177-181.
41. Diretrizes da Sociedade Brasileira de Diabetes: 2014-2015 (Brasil). Sociedade Brasileira de Diabetes. Organização José Egidio, Paulo de Oliveira, Sérgio Vencio. – São Paulo: AC Farmacêutica; 2015.
Received 28/10/2015. Revised 11/04/2016. Accepted 25/05/2016.