THE FOOD PYRAMID ADAPTED TO
PHYSICALLY ACTIVE ADOLESCENTS AS
A NUTRITION EDUCATION TOOL
1MS. CAMILA BRANDÃO GONÇALVES Programa de Pós-gradação em Educação Física, Faculdade
de Educação Física, Universidade de Brasília
(Brasília – Distrito Federal – Brasil) E-mail: [email protected]
DRA. JÚLIA APARECIDA DEVIDÉ NOGUEIRA Programa de Pós-gradação em Educação Física, Faculdade
de Educação Física, Universidade de Brasília
(Brasília – Distrito Federal – Brasil) E-mail: [email protected]
DRA. TERESA HELENA MACEDO DA COSTA Departamento de Nutrição, Faculdade de Ciências da Saúde,
Universidade de Brasília (Brasília – Distrito Federal – Brasil)
E-mail: [email protected]
ABSTRACT
This study aimed to assess the understanding of the Food Pyramid Adapted to Physically Active Adolescents as an educational tool to improve nutrition knowledge. Adolescents engaged in sport training responded to a nutrition knowledge questionnaire before and after the intervention. The pyramid intervention group received the printed educational material, and the broad intervention group received the printed material followed by a lecture. As a result, mean initial nutrition knowledge was average (59.9 ± 18 points), increasing (p<0.001) after the intervention (69.1 ± 20 points) without signiicant difference between interventions. In conclusion, adolescents’ nutrition knowledge improved, even with the use of the Food Pyramid alone, indicating its use to promote nutritional knowledge.
KEYWORDS: Adolescence; Sports; Eating Habits; Food Groups.
INTRODUCTION
Adolescence is a period of growth, maturation and rapid physiological and psychological changes (ALBERGA et al., 2012). It is also a critical period for behavioral
changes that might be sustained throughout the lifespan: physical activity and sports participation decline during adolescence, especially in girls (ALLISONet al., 2007);
and adolescents are vulnerable to poor nutritional status resulting from inadequate food intake and unhealthy dietary practices (DWYER et al., 2001). These changes
during adolescence require the attention of parents and professionals that work with adolescents to promote health and prevent the onset of obesity and its associated
diseases (REES et al., 1999; ALBERGA et al., 2012).
In this regard, regular physical activity such as sports participation (AMERICAN ACADEMY OF PEDIATRICS et al., 2006) and healthy eating (REES et al.,
1999) are systematically encouraged as part of healthy living (WORLD HEALTH ORGANIZATION, 2004). However, on top of the speciic nutritional requirements arising from inherent biological changes (REES et al., 1999; ALBERGA et al., 2012),
adolescents engaged in sports participation have increased energy and carbohydrate requirements, which may further prevent them from obtaining nutritional balance (INSTITUTE OF MEDICINE, 2002; AMERICAN HEART ASSOCIATION, 2006). Nutrition education is an essential tool to promote healthy eating habits (PÉREZ-RODRIGO; ARANCETA, 2001; WORSLEY, 2002; PRELIP, 2011). When nutrition education is used as an intervention strategy, there is an improvement in nutrition knowledge, attitudes and eating behavior (PÉREZ-RODRIGO; ARANCETA, 2001; PRELIP, 2011). Although the change in eating behavior is part of a broader
perspective of adherence, which involves the environment and individuals’ interactions,
correct notions of diet and nutrition continue to play a key role in the adoption of healthy habits (WORSLEY, 2002).
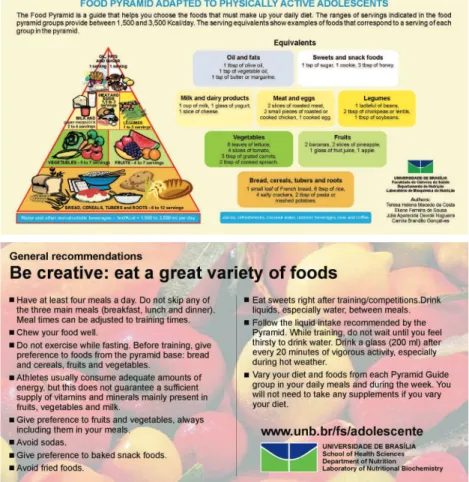
There are tools that provide guidance on food intake, are widely accepted and well understood and, for this reason, are known by the general population (PHILIPPI et al., 1999; UNITED STATE, 2012). The food pyramid is a visual guide used to teach the general population and athletes how to adequately select foods (PHILIPPI et al., 1999; NOGUEIRA; DA COSTA, 2004; METTLER; MANNHART; COLOMBANI, 2009). In this context, the Food Pyramid Adapted to Physically Active Adolescents showed in Figure 1 (DA COSTA et al., 2012) was developed from the
Food Pyramid adapted to the Brazilian population (PHILIPPI et al., 1999), as a tool
to provide guidance on how to obtain a balanced diet.
fruits, vegetables, milk, meat and legumes) intake of physically active adolescents. In addition, it was designed in a colorful and attractive way and included descriptions of adequate eating habits (PHILIPPI et al., 1999; DA COSTA et al., 2012; UNITED STATE,
2012). In 2011, the United Sates Department of Agriculture (USDA) introduced a new food guide for the American population, using a circle to characterize a plate of food (USDA, 2012). In the case of individuals engaged in sports, the pyramidal shape is consistent with some training proposals and can be better understood (FLECK; KRAEMER, 2004; METTLER; MANNHART; COLOMBANI, 2009).
Thus, the present study aimed to evaluate the understanding of the Food Pyramid Adapted to Physically Active Adolescents as a simple, inexpensive, self
--explanatory and easily applicable nutrition education tool.
METHODS
The present study had an analytical, longitudinal and intervention design and was approved by the National Research Ethics Committee, registered under number 7364/2003. A search in the Brasília-Brazil phone book identiied a total of 32 sports
clubs that were situated in the Plano Piloto, an area that houses the upper-middle
socio-economic class. A non-probabilistic random selection to draw 4 sports clubs out of the 32 available was carried out, followed by a telephone call to conirm if they would agree to participate in the study and if they fulilled the following criteria, previously deined for inclusion in the study: a) work with adolescents who were between 12 and 15 years of age until the day of the interview; b) provide three or more hours of training per week; c) have technical guidance; and d) participate in any level of competition.
All adolescents from the four sports clubs selected were invited and agreed to participate (n=58) and each adolescent and their responsible adult signed an informed consent form to participate in the study. Exclusion criteria were: a) the adolescent being ill (or using a cast) and b) pregnant girls. No adolescents met the exclusion criteria and, consequently, all of them were included.
In stage 1, adolescents responded to the following questionnaires: socio
--demographic; sexual maturation; daily and physical activities; nutrition knowledge questionnaire (NKQ); and three non-consecutive 24-hour food recall questionnaires; applied by trained interviewees. Next, anthropometric measurements (weight, height, and triceps and subscapular skinfolds) were assessed by a single evaluator, according to the Anthropometric Standardization Reference Manual (LOHMAN; ROCHE; MARTORELL, 1988). Data collection was performed in the training location, during the usual time of activities.
The questionnaires applied in the present study were adapted from instruments used in previous research with adolescents (NOGUEIRA; DA COSTA, 2009) and tested with a pilot study. Sexual maturation was identiied through self-reporting the presence of menarche in girls and the presence of thick and abundant underarm hair in boys. The presence of underarm hair in boys is a practical non-intrusive methodology used to identify the presence or absence of sexual maturation in adolescents, when a complete physical exam is not appropriate (NOGUEIRA; DA COSTA, 2009).
The NKQ was adapted from studies conducted with Brazilians (LIMA; MONTEIRO; PAES, 1985; TRICHES; GIUGLIANI, 2005), to which three speciic questions about the food pyramid were added. Questions were scored according to the level of dificulty, with the question that directly analyzed knowledge about the food pyramid recommendation having a higher score. Adolescents completed
the questionnaires blind to the score of each question. Data on the food recall
questionnaires were input into the NUTRISURVEY software (2005 version), grouped into servings of food groups, and subsequently compared with the intakes recommended by the Food Pyramid Adapted to Physically Active Adolescents (DA COSTA et. al., 2012).
When stage 1 inished, sports teams were randomly divided into two inter
-vention groups, mindful of different groups not being in contact with one another. Because sport teams have a different number of players, this resulted in a different number of subjects in each intervention type. The Broad intervention group (BI; n=24) received the printed educational material about the Food Pyramid Adapted to Physically Active Adolescents (FIGURE 1) in return for their participation in the study and attended a ten-minute lecture on this material, the pyramid food groups and the recommendations included on the back of the material. Then, adolescents were encouraged to ask their questions, although there were few questions, which lasted less than ive minutes in all. The Pyramid intervention group (PI; n=34) received only the printed educational material on the Food Pyramid Adapted to Physically Active Adolescents (FIGURE 1) in return for their participation in the study, without any additional explanations about the material.
One month after the intervention, in stage 2, adolescents responded to the questionnaires again, in a manner similar to that described in stage 1. In stage 2, however, there was no food recall questionnaire and there was a loss of ive individuals, who stopped participating in the regular training activities, did not answer the telephone calls, and consequently did not respond to the questionnaires.
The data collected were analyzed to search for inconsistencies, which were not found, and subsequently tabulated. The socioeconomic level was categorized according to the Brazilian economic classiication criteria recommended by the
Associação Brasileira de Empresas de Pesquisa (ABEP – Brazilian Association of Market
Research Companies), which includes the description of household consumer goods and the head of the household’s level of formal education (ABEP, 2003). Body weight and height were used to calculate the body mass index (BMI), which was subsequently categorized according to the criteria established by Cole et al. (2000)
Lohman and Slaughter (1985). Data on daily activities and physical activities were used to calculate the physical activity level (PAL), according to the FAO/ WHO/ UNU (2001), and this level was classiied according to the Institute of Medicine’s (IOM) criteria (INSTITUTE OF MEDICINE, 2002).
The level of nutrition knowledge was analyzed from the sum of points obtained from the NKQ, which enabled adolescents to score between zero and 100 points. The improvement in the level of nutrition knowledge was taken into consideration when the sum of points in stage 2 was higher than that in stage 1.
The statistical analysis was performed using the SPSS software program (version 13). The normality of distribution was tested with the Kolmogorov-Smirnov test. Continuous variables were expressed as central tendency measure (mean) and their
dispersion as standard deviation (SD), and minimum (Min.) and maximum (Max.)
values. The frequencies of distribution were used for categorical variables. Pearson’s correlation was used to observe a linear association of the PAL values and the total number of hours spent on sedentary activities with the total number of points obtained from the NKQ in stage 1. The analysis of variance for randomized trials (ANOVA) was used to verify the differences in level of nutrition knowledge among economic classes. Data stratiied by sex or intervention group were compared in the two stages using the non-parametric Wilcoxon test. The Chi-square test was performed to compare the proportion of adolescents who reported changing their food choices in stage 2, according to intervention group. A ive percent signiicance
level was adopted (p<0.05).
RESULTS
Table 1. Age, level of education and body composition of adolescents of sports clubs, according to type of intervention. Brasília, Brazil
Type of intervention
Total (n=58)
Pyramid (n=34) Broad (n=24)
Mean (SD) Mean (SD) Mean (SD)
Age (years) 13.8 (0.71) 13.7 (0.87) 13.7 (0.77)
Level of education (years) 6.06 (0.85) 5.88 (1.23) 5.98 (1.02)
Weight (kg) 61.1 (15.26)* 53.6 (8.67) 57. 9 (13.37)
Height (cm) 170.4 (9.86)* 162.3 (7.10) 167.1 (9.62)
BMI (kg/m2) 20.9 (4.32) 20.3 (2.44) 20.7 (3.65)
BF (%) 20.0 (6.76) 21.1 (8.20) 20.5 (7.34)
SD, Standard deviation; BMI, Body mass index; %BF, Percentage of body fat; *p <0.05, signiicant difference between intervention groups.
The distribution of adolescents per school year was as follows: 21% were
enrolled in the 6th year, 33% were in the 7th year, and 38% were in the 8th year
of elementary school. The majority (85%) of adolescents reported signs of sexual maturation; of these, 65% belonged to the PI group and 35% to the BI group. The PI group was comprised of slightly older individuals and a higher percentage of girls, factors that inluenced the presence of sexual maturation.
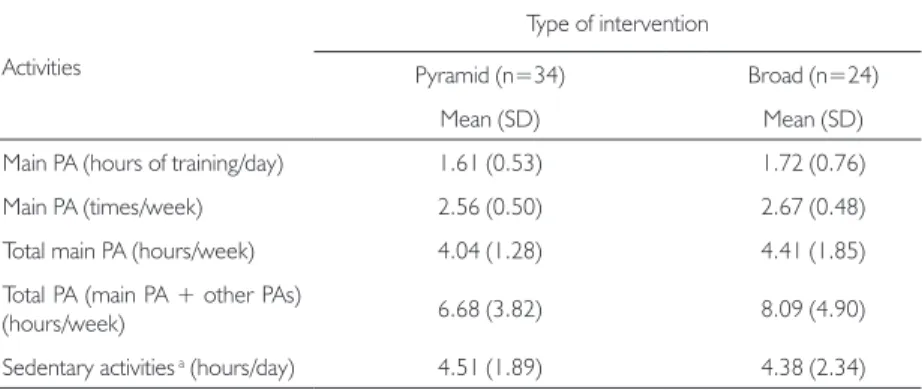
There were no signiicant differences in economic classiication or level of education between intervention groups, or in the duration and frequency of physical activities and sedentary activities (TABLE 2).
Table 2. Characteristics of time spent on physical activities and sedentary activities by adolescents from sports clubs and schools, according to type of intervention. Brasília, Brazil
Activities
Type of intervention
Pyramid (n=34) Broad (n=24)
Mean (SD) Mean (SD)
Main PA (hours of training/day) 1.61 (0.53) 1.72 (0.76)
Main PA (times/week) 2.56 (0.50) 2.67 (0.48)
Total main PA (hours/week) 4.04 (1.28) 4.41 (1.85)
Total PA (main PA + other PAs)
(hours/week) 6.68 (3.82) 8.09 (4.90)
Sedentary activities a (hours/day) 4.51 (1.89) 4.38 (2.34)
The mean PAL (SD) of adolescents from the PI group was 1.41 (0.12) and of the BI group was 1.52 (0.20), with p<0.05. However, both groups were categorized as low active by the mean PAL.
Adolescents’ food intake was assessed according to the number of servings recommended by the Food Pyramid Adapted to Physically Active Adolescents. The majority of adolescents had an intake lower than the number of servings of fruits (83% of adolescents), vegetables (98%), and legumes (72%). Also, most of the adolescents reported consuming a number of servings higher than the recommended for meat and eggs (71% of adolescents), sweets and snack foods (98%) and fats (69%). The prevalence of adolescents with adequate intake was 52% for the bread, cereals, tubers and roots group (carbohydrates), and 45% for milk and dairy products group. Even so, 43% of adolescents consumed less than the recommended intake for carbohydrates and 48% for milk and dairy groups.
When separated into groups per type of intervention, the proportion of intake remained below the value recommended by the Adapted Food Pyramid for fruits (76% and 92%), vegetables (97% and 100%), legumes (82% and 58%; p<0.05) and milk and dairy products (38% and 63% of adolescents in the PI and BI groups, respectively). Intake remained higher than the recommended values for meat and eggs (71% and 71%), sweets and snack foods (97% and 100%) and fats (74% and 63% of adolescents in the PI and BI groups, respectively). The intake of the breads, cereals, tubers and roots group was the same as that of the food pyramid for 50% and 54% of adolescents in the PI and BI groups, respectively. There was a signiicant difference (p<0.05) in the adequate intake of milk and dairy products, with the majority of adolescents (53%) in the PI group and only 33% of those in the BI group consuming the recommended amount.
The initial nutrition knowledge among adolescents, assessed in stage 1, did not vary signiicantly according to social class, level of education, BMI, or intervention group. However, when categorized by sex, the mean (SD) of the total score, and that of the speciic question about distribution of groups in the Food Pyramid of boys (60.4±18.3 and 28.8±17.5, respectively) were signiicantly higher (p < 0.05) than those of girls (50.4±14.5 and 20.2±10.3).
Boys and girls had signiicant improvements in the mean score (SD) of total nutrition knowledge in stage 2 (girls: 67.8 ± 19.1, p<0.001; boys: 70.3±20.8, p<0.05). In stage 2, the increase in the mean score (SD) of the speciic question about distribution of food groups in the Food Pyramid was signiicant for girls (36.9±17.5, p<0.001) and not signiicant for boys (37.4±20.5; p=0.06).
signiicant improvements in the mean scores of the NKQ, the minimum score obtained and the scores obtained from the speciic question about distribution of food groups in the Food Pyramid. For all parameters, there were no signiicant differences in improvements between groups, i.e. the PI and BI groups showed better scores in stage 2, regardless of the type of intervention (Figure 2).
Figure 2. Mean score (standard deviation) obtained in the nutritional knowledge questionnaire (NKQ), according to type of intervention (Pyramid / Broad) and research phase (Pre / Post intervention).
Label: Data in columns refer to: Total = mean score on the questionnaire; Know = mean score of adolescents that declared to know the pyramid food guide previously; Don’t Know = mean score of adolescents that declared to not know the pyramid food guide previously; Minimum = lowest score on the questionnaire; Speciic question = mean score on the speciic question about the distribution of food groups on the pyramid food guide. Signiicant statistical differences ***, p<0.001; **, p<0.01; *, p<0.05 by Wilcoxon test between stages 1 and 2.
DISCUSSION
The study sample relects a proile of Brazilian adolescents who are pubescent, have normal weight, and are engaged in sports training, although with a high level of sedentary activities. Several studies conducted with physically active adolescents (DE SOUSA et al., 2008; NOGUEIRA; DA COSTA, 2009; DOWDA et al., 2001;
EISENMANN; BARTEE; WANG, 2002; GARRIDO; WEBSTER; CHAMORRO, 2007; IGLESIAS-GUTIÉRREZ et al., 2008) have indicated a higher prevalence of
normal BMI. There were signiicant differences in weight and height between groups, which probably relect the distinct types of sports practiced by these groups. The PI group included adolescents who practiced basketball and volleyball, sports in which height is the usual selection parameter. In addition, the BI group included more boys than girls, so it was less homogeneous with respect to gender than the PI group. Girls’ initial knowledge was lower than boys, which may be regarded as a potential disadvantage for the PI group.
Although the total number of hours spent on physical activities was slightly higher in the BI group than the PI group, adolescents from both groups met the recommendations of 60 minutes of daily moderate to vigorous physical activity on most days of the week and were considered as physically active (INSTITUTE OF MEDICINE, 2002; WHO, 2004; AMERICAN ACADEMY OF PEDIATRICS et al.,
2006). In addition, the mean values found were in agreement with those of other studies conducted with physically active individuals that reported approximately between 5 and 12 weekly hours of physical activities (GARRIDO; WEBSTER; CHAMORRO, 2007; DE SOUSA et al., 2008; IGLESIAS-GUTIÉRREZ et al., 2008;
NOGUEIRA; DA COSTA, 2009).
In contrast, the mean number of hours spent on sedentary activities (hours of television, DVD and computer) per day by adolescents in the present study was higher than the recommendation of up to two hours per day of electronic media for entertainment (WHO, 2004; AMERICAN ACADEMY OF PEDIATRICS et al.,
2006), despite being in agreement with other studies conducted with children and adolescents (DOWDA et al., 2001; EISENMANN; BARTEE; WANG, 2002). This
fact helps to explain why the mean PAL was categorized as low active (INSTITUTE OF MEDICINE, 2002). None of the previously mentioned studies reported PAL
values for comparison.
Based on the data on low intake of servings of the fruits, vegetables and legumes groups and high intake of the fats, sweets and snack foods group and meat and eggs group, this study showed that there is still room and the need for information about
by these adolescents relect patterns of unhealthy eating habits, also found among adolescents of various other countries (D’ALESSANDRO et al., 2007; GARRIDO;
WEBSTER; CHAMORRO, 2007; IGLESIAS-GUTIÉRREZ et al., 2008; DA COSTA et al., 2012). The maintenance of diets with little variety of foods and the fact that regular
physical activity practice increases nutritional requirements of energy and certain nutrients (INSTITUTE OF MEDICINE, 2002; AMERICAN HEART ASSOCIATION, 2006) could mean that adolescents engaged in sports are at a higher risk of developing nutritional deiciencies.
In addition, the present study showed that adolescents’ knowledge about diet and nutrition is average (mean of 55 points) and is not inluenced by PAL, BMI and economic class. There were also other studies that did not ind signiicant differences in nutrition knowledge between obese and normal children and adolescents categorized by the BMI (THAKUR; D’AMICO, 1999; REINEHR et al., 2001).
When analyzed by sex, the mean score obtained from the NKQ pointed to boys showing a better result. The fact that boys had a higher mean age and were one school year ahead of girls on average could help to explain these initial differences. Studies assessing the gain in nutrition knowledge by adolescents did not perform an assessment according to sex (THAKUR; D’AMICO, 1999; REINEHR et al., 2001;
TRICHES; GIUGLIANI, 2005; WATSON et al., 2009), although one study pointed
to girls having better nutrition knowledge than boys, as they were more involved with food preparation and cared more for their body image in general (TURCONI
et al., 2008). However, the initial differences were disregarded after the intervention,
when boys and girls obtained similar mean total numbers of points from the NKQ. There was a greater improvement in knowledge among girls, which could have been due to their lower initial nutrition knowledge.
However, the self-explanatory capacity, which is independent of the time duration
between exposure and evaluation of the tool, was proven.
The present study did not investigate the change in eating habits resulting from the increase in adolescents’ nutrition knowledge. This limitation was due to the short space of time between interviews. However, the increase in nutrition knowledge is viewed as a key factor to change eating habits (PÉREZ-RODRIGO; ARANCETA, 2001; WORSLEY, 2002; TRICHES; GIUGLIANI, 2005; PRELIP, 2011). In this context, the adapted food pyramid can be used as a visual tool to facilitate understanding and the maintenance of a healthy diet (PHILIPPI et al., 1999; GONZÁLEZ-GROSS et al., 2008; METTLER; MANNHART; COLOMBANI, 2009). However, nutrition
knowledge does not necessarily inluence food choices and preferences. The increase in nutrition knowledge causes the understanding of healthier food choices, which is an important determinant of attitudes, although eating habits are inluenced by other basic concepts inherent in individuals that are not affected by nutrition knowledge (WORSLEY, 2002; CRITES; AIKMAN, 2005). These other factors that inluence eating habits need to be better understood for the development of nutrition interventions that can improve these habits among adolescents (STORY; NEUMARK-SZTAINER; FRENCH, 2002; CRITES; AIKMAN, 2005).
Following recommendations that accessible and effective tools should be used in health promotion programs including eating habits and knowledge (PHILIPPI
et al., 1999; CRITES; AIKMAN, 2005; AMERICAN HEART ASSOCIATION, 2006;
GONZÁLEZ-GROSS et al., 2008; METTLER; MANNHART; COLOMBANI,
2009; UNITED STATE, 2012) the present study proposed the use of the Food Pyramid Adapted to Physically Active Adolescents as a nutrition education tool for this group. This tool was found to be appropriate, as it is accessible and effective in the dissemination of information about nutrition among this population. Efforts to promote healthy lifestyle among adolescents are needed and should place greater emphasis on combining physical activity with a balanced diet, since sport activities may increase nutritional needs.
CONCLUSION
The Food Pyramid Adapted to Physically Active Adolescents is an educational tool that can be understood in a self-explanatory way by adolescents, regardless of sex, previous nutrition knowledge, BMI and PAL. Thus, health professionals, sports coaches and physical education teachers can use this Food Pyramid to inform physically
active adolescents about food choices and to help them to improve nutritional
Pyramid must be analyzed in future studies, as nutrition knowledge acquisition is only one of the essential steps in this process.
A pirâmide alimentar adaptada para adolescentes isicamente
ativos como ferramenta de educação nutricional
RESUMO: O estudo avaliou a compreensão da Pirâmide Alimentar Adaptada para Adolescentes Fisicamente Ativos como ferramenta educacional para melhorar o conhecimento em nutrição. Adolescentes que treinam um esporte responderam questionário de conhecimento em nutrição antes e depois da intervenção. O grupo de intervenção pirâmide recebeu o material educacional impresso e o grupo intervenção ampla recebeu o material impresso seguido de palestra. O conhecimento nutricional inicial foi mediano (59,9 ± 18 pontos), com aumento (p <0,001) após a intervenção (69,1 ± 20 pontos), sem diferença signiicativa por tipo de intervenção. O conhecimento de adolescentes em nutrição melhorou, mesmo com o uso da Pirâmide Alimentar sozinha, indicando seu uso para promover o conhecimento nutricional. PALAVRAS-CHAVE: Adolescência; esportes; hábitos alimentares; grupos de alimentos.
La pirámide alimentar adaptada para adolescentes físicamente activos como herramienta de educación en nutrición
RESUMEN: Lo estudio evaluó la comprensión de la pirámide de alimentos adaptado a los ado-lescentes físicamente activos como una herramienta educativa para mejorar el conocimiento de la nutrición. Los adolescentes que participan en el entrenamiento deportivo respondió a un cuestionario de conocimientos sobre nutrición antes y después de la intervención. El grupo de intervención la pirámide recibió material educativo impreso, y la intervención amplia recibió el material impreso seguido por una conferencia. Como resultados, la media de conocimientos sobre nutrición inicial era (59,9 ± 18 puntos), con aumento (p <0,001) después de la intervención (69,1 ± 20 puntos), sin diferencia signiicativa entre las intervenciones. El conocimiento de Adolescentes sobre nutrición foie mejorada, incluso con el uso de la pirámide de alimentos solo, lo que indica su uso para promover el conocimiento nutricional.
PALABRAS CLAVE: Adolescencia; deportes; hábitos alimentarios; grupos de alimentos.
REFERENCES
ALBERGA, A. S. et al. Overweight and obese teenagers: why is adolescence a critical period? Pediatric Obesity, Oxford, v. 7, n. 4, p. 261-273, aug. 012.
ALLISON, K. R.et al. The decline in physical activity among adolescent students: a cross --national comparison. Canadian Journal of Public Health, Ottawa, v. 98, n. 2, p. 97-100,
mar./apr. 2007.
AMERICAN HEART ASSOCIATION. Scientiic statement: diet and lifestyle recommendations
revision 2006. Circulation, Baltimore, v. 114, n. 1, p. 82-96, july 2006.
ASSOCIAÇÃO BRASILEIRA DE EMPRESAS DE PESQUISA (ABEP). 2003. Disponível em: <http://www.abep.org/codigosguias/ABEP_CCEB.pdf> Acesso em: 17 dez. 2009. BOILEAU, R. A.; LOHMAN, T. G.; SLAUGHTER, M. H. Exercise and body composition of children and youth. Scandinavian Journal of Sports Science, v. 7, n. 1, p. 17-27, 1985.
COLE, T. J. et al. Establishing a standard deinition for child overweight and obesity worldwide: international survey. British Medical Journal, London, v. 320, p.1240-1247, may 2000.
COLE, T. J.; KATHERINE, M. F. Body mass index cut offs to deine thinness in children and adolescents: international survey. British Medical Journal, London, v. 335, p.194-202, july 2007.
CRITES, S. L.; AIKMAN, S. N. Impact of nutrition knowledge on food evaluations. European Journal of Clinical Nutrition, London, v. 59, n. 10, p. 1191-1200, oct. 2005.
D’ALESSANDRO, C. et al. Proiling the diet and body composition of subelite adolescent rhythmic gymnasts. Pediatric Exercise Science, Champaign, v. 19, n. 2, p. 215-227, may 2007.
DA COSTA, T. H. et al. Avaliação nutricional de atletas adolescentes do Distrito Federal. Dispo
-nível em: <http://www.unb.br/fs/adolescente/pira_internet.pdf.> Accesso em: 16 jan. 2012. DE SOUSA, E. F. et al. Assessment of nutrient and water intake among adolescents from sports federations in the Federal District, Brazil. British Journal of Nutrition, Cambridge, v. 99,
n. 6, p. 1275-1283, june 2008.
DOWDA, M. et al. Environmental inluences, physical activity, and weight status in 8- to
16-year-olds. Archives of Pediatrics & Adolescent Medicine, Chicago, v. 155, n. 6, p.711-717,
june 2001.
DWYER, J. et al. Adolescents’ eating patterns inluence their nutrient intakes. Journal of the American Dietetic Association, New York, v. 101, n. 7, p. 798-802, july 2001.
EISENMANN, J. C.; BARTEE, R. T.; WANG, M. Q. Physical activity, TV viewing, and weight in U.S. youth: 1999 Youth Risk Behavior Survey. Obesity Research, Baton Rouge, v.10, n. 5,
p. 379-385, may 2002.
FLECK, S. J.; KRAEMER, W. J. Designing resistance training programs. 3rd ed. Champaign: Human Kinetics, 2004.
FOOD AND AGRICULTURE ORGANIZATION (FAO). Expert consultation: human energy requirements. FAO food and nutrition technical report series 1. Rome, 2001.
GONZÁLEZ-GROSS, M. et al. The “healthy lifestyle guide pyramid” for children and ado -lescents. Nutritíon Hospitalaria, Madrid, v. 23, n. 2, p. 159-168, mar./apr. 2008.
IGLESIAS-GUTIÉRREZ, E. et al. Food preferences do not inluence adolescent high-level
athletes’ dietary intake. Appetite, London, v. 50, n. 2-3, p. 536–543, mar./may 2008.
INSTITUTE OF MEDICINE. Dietary reference intakes for energy, carbohydrate, iber, fat, fatty aci -ds, cholesterol, protein, and amino acids (Macronutrients). Washington: National Academy, 2002.
INTERNATIONAL PHYSICAL ACTIVITY QUESTIONNAIRE (IPAQ): short format version.
Disponível em: <http://www.ipaq.ki.se/downloads.htm>. Accesso em: 17 dec. 2009.
LIMA, E. D.; MONTEIRO, E. A.; PAES, A. Educação nutricional na escola do primeiro grau em Pernambuco (Brasil): diagnóstico. Revista de Saúde Pública, São Paulo, v. 19, n. 6,
p. 508-520, dez. 1985.
LOHMAN, T. G.; ROCHE, A. F.; MARTORELL, R. Anthropometric standardization reference manual. Champaign: Human Kinetics Books, 1988.
METTLER, S.; MANNHART C.; COLOMBANI, P. C. Development and validation of a food
pyramid for swiss athletes. International Journal of Sport Nutrition and Exercise Metabolism,
Champaign, v. 19, n. 5, p. 504-518, oct. 2009.
NOGUEIRA, J. A.; DA COSTA, T. H. Gender differences in physical activity, sedentary behavior and its relation to body composition in active Brazilian adolescents. Journal of Physical Activity & Health, Champaign, v. 6, n. 1, p. 93-98, jan. 2009.
NOGUEIRA, J. A.;DA COSTA, T. H. Nutrient intake and eating habits of triathletes on a brazilian diet. International Journal of Sport Nutrition and Exercise Metabolism, Champaign,
v.14, n. 6, p. 684-697, dec. 2004.
PÉREZ-RODRIGO, C.; ARANCETA, J. School-based nutrition education: lessons learned and
new perspectives. Public Health Nutrition, Wallingford, v. 4, n. 1A, p. 131-139, feb. 2001.
PHILIPPI, S. T. et al. Pirâmide alimentar adaptada: guia para escolha dos alimentos. Revista de Nutrição, Campinas, v.12, n. 1, p. 65-80, jan./apr. 1999.
PRELIP, M. et al. Effects of a school-based nutrition program diffused throughout a large urban
community on attitudes, beliefs, and behaviors related to fruit and vegetable consumption.
Journal of School Health, Hoboken, v. 81, n. 9, p. 520-529, sept. 2011.
REES, J. M. et al. Improving the nutritional health of adolescents -position statement- society
for adolescent medicine. Journal of Adolescent Health, New York, v. 24, n. 6, p. 461-462, june 1999.
SIRI, W. E. The gross composition of the body. Advances in Biological and Medical Physics,
New York, v. 4, p. 239-280, jan. 1956.
STORY, M.; NEUMARK-SZTAINER, D.; FRENCH, S. Individual and environmental inluences on adolescent eating behaviors. Journal of the American Dietetic Association, Chicago, v. 102,
n. S3, p. S40-S51, mar. 2002.
THAKUR, N.; D’AMICO, F. Relationship of nutrition knowledge and obesity in adolescence.
Family Medicine, Kansas, v. 31, n. 2, p. 122-127, feb. 1999.
TRICHES, R. Z.; GIUGLIANI, E. R. Obesidade, práticas alimentares e conhecimentos de
nutrição em escolares. Revista de Saúde Pública, São Paulo, v. 39, n. 4, p. 541-547, aug. 2005
TURCONI, G. et al. Eating habits and behaviors, physical activity, nutritional and food safety
knowledge and beliefs in an adolescent Italian population. Journal of the American College of Nutrition, New York, v. 27, n. 1, p. 31-43, feb. 2008.
UNITED STATE. DEPARTMENT OF AGRICULTURE (USDA). Choose my plate. Disponível em: <http://www.choosemyplate.gov/>. Accesso: 16 jan. 2012.
WATSON, L. C. et al. Evaluation of the nutrition knowledge, attitudes, and food consumption
behaviors of high school students before and after completion of a nutrition course. Family and Consumer Sciences Research Journal, Thousand Oaks, v. 37, n. 4, p. 523-534, jul. 2009.
WORLD HEALTH ORGANIZATION (WHO). Global strategy on diet, physical activity and health: ifty-seventh World Health Assembly (WHA 57.17), may 2004. Disponível em:
<www.who.int/dietphysicalactivity/strategy/eb11344/strategy_english_web.pdf>. Accesso em: 12 dec. 2009.
WORSLEY, A. Nutrition knowledge and food consumption: can nutrition knowledge change food behavior? Asia Paciic Journal of Clinical Nutrition, Melbourne, v. 11, s. 3, p. S579-585, jan. 2002.
Recebido em: 30 set. 2012
Aprovado em: 21 maio 2013
Endereço para correspondência:
Júlia Aparecida Devidé Nogueira
Faculdade de Educação Física,
Campus Universitário Darcy Ribeiro Universidade de Brasília; Brasília-DF