Food intake and meal patterns
of adolescents, São Paulo, Brazil
Consumo alimentar e padrão de
refeições de adolescentes, São Paulo,
Brasil
Greisse Viero da Silva Leal
ISonia Tucunduva Philippi
ISandra Marcela Mahecha Matsudo
IIErika Christiane Toassa
IIII Faculdade de Saúde Pública da Universidade de São Paulo - USP, SP, Brasil. II Centro de Estudos do Laboratório de Aptidão Física de São Caetano do Sul – CELAFISCS, São Caetano do Sul, SP, Brasil.
III Programa Internunidades Nutrição Humana Aplicada – PRONUT da Universidade de São Paulo – USP, SP, Brasil.
Correspondência: Greisse Viero da Silva Leal,Departamento de Nutrição da Faculdade de Saúde Pública da Universidade de São Paulo - USP, Av. Dr Arnaldo, 715 CEP 01246-904, São Paulo, SP - Bra-sil, E-mail: [email protected]
Abstract
Objective: In order to assess the food in-take and meal patterns of adolescents, a cross-sectional study was conducted with 228 adolescents from a public school in SP, Brazil. Methods: Energy, macronutrients, calcium, iron and vitamin A intake were evaluated. The food pattern was compared with the eating patterns established by the Food Pyramid for Adolescents. Meal fre-quency was veriied to determine meal skip-ping. Descriptive statistics and Chi-square were used. Results: The mean energy intake was 66% lower than the recommendations, the carbohydrate intake was 50% lower, the fat intake was 50% higher and the protein intake was 40% higher. Among the studied adolescents, 21% skipped breakfast and a third have snacks instead of lunch or dinner.
Conclusion: The adolescents presented an energy insufficient diet with inadequate fruit and vegetable intake. The meal pat-terns were satisfactory, but breakfast should be encouraged.
Introduction
Adolescents are a nutritionally vulnera-ble age group, considering their increased nutritional needs, eating patterns, life style, and susceptibility to environmental inluen-ces 1,2. Therefore, providing access to
infor-mation about nutrition and the monitoring of eating habits is important for identifying risky behavior as well as for ensuring their full growth and development potential.
At this age, an excessive consumption of soft drinks, sweets and fast food combined with a low intake of fruit, vegetables and dairy products is common 3, 4, 5, 6,. This eating
pattern is concerning, because it can lead to overweight and a higher probability of non-transmissible chronic diseases (NTCD) such as diabetes, high blood pressure and dyslipidemia later in life 7, 8.
Thus, it is necessary to promote healthy eating during this growth stage. The use of an eating guide such as the Food Pyramid is appropriate, considering that this ins-trument has been adapted for the speciic nutritional needs of adolescents, plotting the number of portions according to age, gender and level of physical activity 1.
The objective of the present study was to evaluate the pattern of meals and food intake of adolescents from a public school.
Methods
This cross-sectional study was perfor-med in a public school in Ilhabela, a city of 26,000 inhabitants in the state of São Paulo, Brazil. The research was done in partnership with the Centro de Estudos e Laboratório de Aptidão Física de São Caetano do Sul (CELAFISCS), an institution that has been conducting a longitudinal study named Pro-jeto Ilhabela for 30 years, with the objective of studying and following the growth, deve-lopment and physical aptitude of students from low socio-economic backgrounds.
The city of Ilhabela has 5 public schools administered by the State of Sao Paulo, and the CELAFISCS project is carried out at a school named Escola Estadual Profª Eva
Resumo
Objetivo: Avaliar o consumo alimentar e o padrão de refeições de adolescentes, São Paulo, Brasil. Métodos: Por meio do Recor-datório de 24 horas, avaliou-se o consumo energético total, de macronutrientes, cálcio, ferro e vitamina A e a omissão de refeições ou sua substituição por lanche, de adoles-centes de uma escola pública de Ilhabela. Comparou-se o consumo alimentar por grupo com a Pirâmide Alimentar do ado-lescente. Foi realizada análise descritiva, aplicou-se o teste Qui-quadrado (p≤ 0,005), além de análise qualitativa. Resultados:
o consumo energético total foi inferior ao estimado para 66% dos adolescentes, o per-centual de carboidratos foi abaixo do reco-mendado e o de lipídios e proteínas acima. Houve omissão do café da manhã entre 21% dos adolescentes e um terço deles substituiu almoço ou jantar por lanche. Conclusão: Os adolescentes apresentaram insuiciência calórica na dieta e baixo consumo de frutas, verduras e legumes, o padrão de refeições foi satisfatório, mas o café da manhã deve ser incentivado.
Esperança Silva. The inclusion criteria for the study were that the adolescents had to be part of the above-mentioned project and from 10 to 18 years old.
The school has 640 students from ifth to ninth grades from 10 to 18 years old, approximately 50% of whom participate in Projeto Ilhabela. The sample was composed of adolescents who accepted the invitation to take part in the study and obtained per-mission from their parents (approximately 70 % of the eligible students). Exclusion criteria were not illing in either the diet questionnaire, the instrument for evalua-tion of physical activity level or for refusing to allow height and weight measurement.
Data was collected in September and October of 2006, using a 24-hour recall (24hR) to evaluate food intake. The infor-mation was collected on weekdays except Mondays. The instrument chosen for data collection was the Dunker and Philippi model 9, which can be used in groups, is
self-answered and recommended for ho-mogeneous populations (similar age, social class and level of schooling). The students illed out the 24hR in class using an expla-nation manual whose main points were copied on the chalkboard. An example diet was provided featuring all the items under consideration (time and type of meal, va-riation in foods and quantities). To obtain information about the usual consumption measurements, a number of common ki-tchen items were used (e.g., a soupspoon, teaspoon, ladle, and common food product containers as reference amounts). Any ques-tions were answered collectively in order to help everyone to understand and reinforce the concepts. All 24hR forms were reviewed as they were handed in to minimize possible mistakes, and afterwards they were reevalu-ated to verify consistency of the data.
The quantitative variables studied were the total caloric value (TCV ) of the diet and the consumption of macronutrients (carbohydrates, protein and lipids) and mi-cronutrients (calcium, iron and vitamin A). To calculate the estimated energy need (EEN) of each adolescent, the equations
recommended in the Dietary Reference Intake (DRI)10 were used. Adolescents with
caloric intakes below 500 kcal or above 6000 kcal were excluded11. The TCV of each
subject’s diet was compared to 100% of the EEN and classiied as either above or below the recommended standard.
The ingestion of macronutrients was classiied according to the recommenda-tions of the WHO/FAO12 as either below the
minimum, above the maximum, or within the recommended interval. Consumption of the micronutrients vitamin A and iron was regarded as either above or below re-commended standards (i.e., 100% of the USRDA)10 and the standard for calcium was
100% of the Adequate Intake10.
The intake of the three main meals (bre-akfast, lunch and dinner) was evaluated, as well as the intake from the three intermedia-ry meals (morning snack, afternoon snack, and evening snack) using the 24hR. For this analysis, probable intervals for mealtimes were established: breakfast between 6 and 9 AM; morning snack between 9 and 11 AM; lunch between 11 AM and 2 PM; afternoon snack between 2 and 6 PM; supper between 6 and 9 PM; and evening snack between 9 PM and 12 AM. The students reported their food intake according to this schedule; when they did not report a meal time, it was considered to have been skipped. The pos-sible replacement of lunch or dinner with a snack was also taken into consideration.
The foods mentioned in the 24hR were listed and classiied according to the groups in the Food Pyramid for Adolescents, which recommends a diet of about 2800 kcal for adolescents between 10 and 19 years old13.
The expected frequency (EF) for each food group was established by multiplying the portion quantity recorded on the 24hR (n=228) by the median number of recom-mended portions for each food group, as presented in Table 1. In order to verify the adequacy of the food intake according to the Food Pyramid groups, the ratio between EF and the observed frequency (OF) was calculated.
was conducted, and the Kolmogorov-Smirnov test was used to verify adherence to the normal curve. The result was a non-parametric distribution, and therefore a logarithmic transformation (y = log x) was used that yielded normally distributed data. The chi-square (X²) test was used to explore the possible association between the variables total caloric intake/day, ma-cronutrients, calcium, iron, and vitamin A according to gender. Statistical signiicance was set at 5% (p≤0.05).
The data was processed using Virtual Nutri14 software; foods and types of
pre-paration that were not part of the software database were included using the “Tabela de composição de alimentos: suporte para deci-são nutricional” (Table of food composition: support for nutritional decisions)15 and the
labels of regionally produced foods. Data analysis was performed using Microsoft Excel XP, Epi-Info (version 6.04) and SPSS (version 13.0).
This study was approved by the Ethics in Research Committee of the School of Public Health of the Universidade de São Paulo. The parents or guardians of the adolescents signed a written consent form allowing them to participate in the study.
Results
The total number of adolescents evalu-ated was 228, which represented 35% of the student body. There were 115 (51%) boys,
and 113 (49%) girls, aged between 10 and 13 (48%) and 14 and 18 (52%) years old.
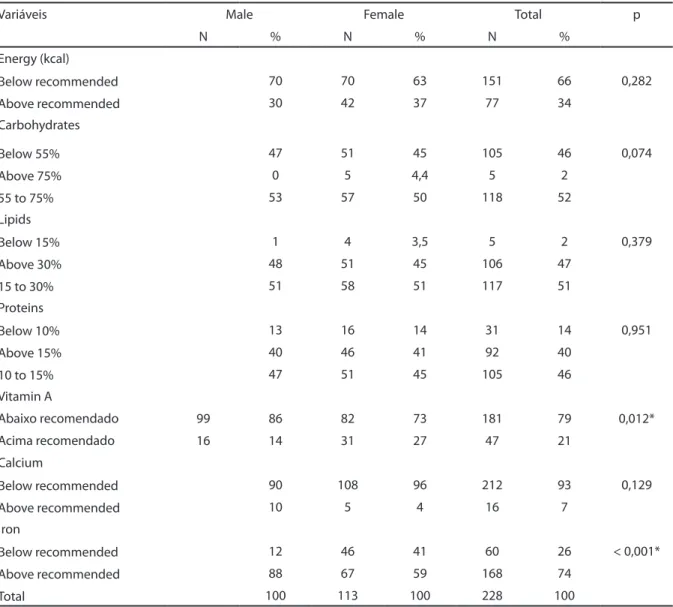
The total energy intake was lower than recommended for 66% of the adolescents. This percentage was higher among the boys (70%) than the girls (63%, p=0.282) (Table 2).
Macronutrient consumption was within recommended limits for carbohydrates (52% of the adolescents), lipids (51%), and proteins (46%). The consumption of lipids was above the upper recommended limit for 47% of the adolescents. The intake of pro-teins also was above the recommendation for 40% of the sample. On the other hand, the intake of carbohydrates was below the lower recommended limit for 46% of the adolescents (Table 2).
The intake of vitamin A was below re-commended for 86% of the boys. There was a positive association between being male and low intake of vitamin A (Table 2).
According to the recommendations, 96% of the girls and 90% of the boys ingested an insuficient quantity of calcium.
There was a statistically significant association (p<0.001) between the over-consumption of iron and being male (88%); iron overconsumption was 59% among girls.
Food intake data was also evaluated according to meal patterns. It was obser-ved that most adolescents have all three main meals: breakfast (79%), lunch (93%) and supper (94%). As for snacks, 42% had a morning snack, 78% had an afternoon sna-ck, and 16% had an evening snack (Table 3). Nevertheless, it is important to emphasi-ze that 21% of the adolescents did not have breakfast. This igure was higher among girls (29%) than boys (13%), resulting in a positive association between being female and skip-ping this meal (p=0.002). Regarding the other two main meals, the study veriied that 7% of the adolescents did not have lunch, and 6% did not have supper. There was an associa-tion between being male and not having an afternoon snack (p=0.03), which occurred in 28% of the boys and 16% of the girls (Table 3).
Another common habit among ado-lescents was discovered in the analysis: 70 subjects (30.8%) replaced lunch or supper,
Table 1 – Expected frequency per group of the Adolescent Food Pyramid.Ilhabela, SP, 2006.
Food Groups Portions Expected
frequency
Rice, bread, pasta, potato, cassava
9 2052
Vegetables 4 912
Fruits 5 1140
Milk, cheese & yogurt 4 912
Meats and eggs 2 456
Dry Beans, Nuts & Seeds 1 228
Fats and oils 1 228
which normally consists of rice, beans, meat and salad, with a snack. Only 6.2% of the students did this at lunch, but 24.6% did for supper (20.9% of the boys and 28.3% of the girls) (Table 3).
The most common replacements for a meal were milk, chocolate milk, French bread, margarine, and soft drinks.
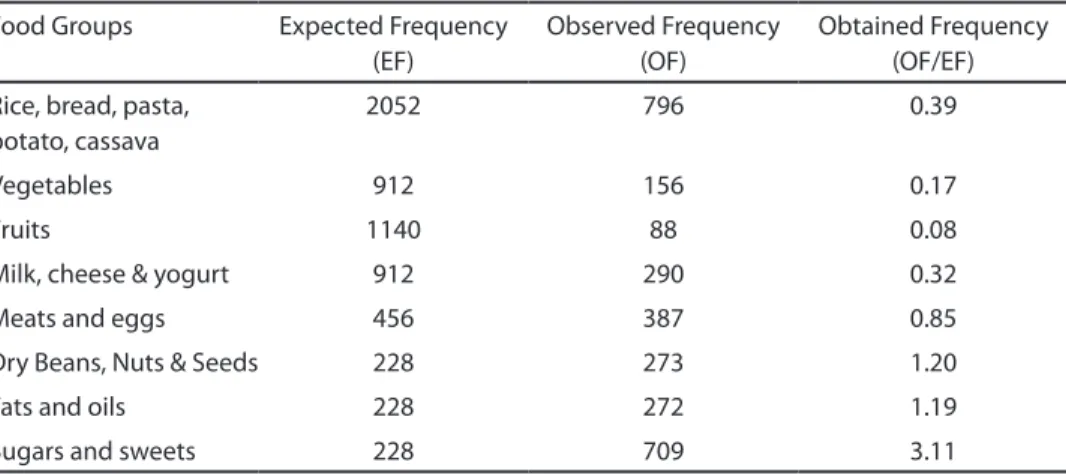
When the OF of food groups and number of portions in the 24hR was compared to the EF in the Food Pyramid for Adolescents using the ratio OF/EF, the consumption of the group sugars and sweets was found to be 3.11 times the expected quantity, while the fruit group intake was 0.08 of what was
expected. Furthermore, intake from the vegetable group was 0.17 (Table 4).
When the obtained frequency for each food group was transformed into Food Pyramid portions, an inversion was noticed in the position of the groups: the low intake of fruit, greens and vegetables put them at the top of the pyramid, while the group fats, oils and sweets was the base of the pyramid due to elevated intake (Figure 1).
Discussion
It is important to meet energy needs du-ring adolescence because an energy deicit
Table 2 – Distribution of energy consumption, macronutrients, calcium, iron, and vitamin A intake by gender. Ilhabela, SP, 2006.
Variáveis Male Female Total p
N % N % N %
Energy (kcal)
Below recommended 70 70 63 151 66 0,282
Above recommended 30 42 37 77 34
Carbohydrates
Below 55% 47 51 45 105 46 0,074
Above 75% 0 5 4,4 5 2
55 to 75% 53 57 50 118 52
Lipids
Below 15% 1 4 3,5 5 2 0,379
Above 30% 48 51 45 106 47
15 to 30% 51 58 51 117 51
Proteins
Below 10% 13 16 14 31 14 0,951
Above 15% 40 46 41 92 40
10 to 15% 47 51 45 105 46
Vitamin A
Abaixo recomendado 99 86 82 73 181 79 0,012*
Acima recomendado 16 14 31 27 47 21
Calcium
Below recommended 90 108 96 212 93 0,129
Above recommended 10 5 4 16 7
Iron
Below recommended 12 46 41 60 26 < 0,001*
Above recommended 88 67 59 168 74
Total 100 113 100 228 100
can compromise growth and development. For 66% of the adolescents, the total ca-loric value of the diet was below recommen-ded, which agrees with the observations of researchers5 in the city of Florianópolis,
Santa Catarina who also used a 24hR and found substandard caloric consumption in 50% of the adolescents. On the other hand, in the city of Piracicaba, São Paulo16,
resear-chers using a food frequency questionnaire (FFQ) and the same formulas as the present study to calculate estimated caloric need, found that 83.8% of the adolescents were
overeating. Slater et al. (2007)17, in a study
about the correction of dietary data, obser-ved that the median values found after the application of three 24hRs or one FFQ were close regarding caloric intake, with a small overestimation from the FFQ.
It has been argued that the use of only one 24hR limits studies of food intake because it does not characterize the habitual consump-tion of the individuals. The methodological choice of applying one 24hR, however, agrees with other authors18,19,20 who recognize this
methodology as valid due to the sample size.
Table 3 – Distribution of meal frequency by gender. Ilhabela, SP, 2006.
Meal Eaten? Male
(n=115)
Female (n=113)
Total (n=228)
p
n % n % n %
Breakfast Yes 100 87 80 71 180 79 0.002*
No 15 13 33 29 48 21
Morning snack
Yes 49 43 46 41 95 42 0.771
No 66 57 67 59 133 58
Lunch Yes 110 96 102 90 212 93 0.111
No 5 4 11 10 16 7
Afternoon snack
Yes 83 72 95 84 178 78 0.030*
No 32 28 18 16 50 22
Supper Yes 110 96 104 92 214 94 0.255
No 5 4 9 8 14
Evening snack
Yes 16 14 21 19 37 16 0.339
No 99 86 92 81 191 84
*p<0.05
Table 4 – ObtainedFrequency in the diet of adolescents according to groups in the Food Pyramid for Adolescents. Ilhabela, SP, 2006.
Food Groups Expected Frequency
(EF)
Observed Frequency (OF)
Obtained Frequency (OF/EF)
Rice, bread, pasta, potato, cassava
2052 796 0.39
Vegetables 912 156 0.17
Fruits 1140 88 0.08
Milk, cheese & yogurt 912 290 0.32
Meats and eggs 456 387 0.85
Dry Beans, Nuts & Seeds 228 273 1.20
Fats and oils 228 272 1.19
The mean values of total caloric intake were 2501.93 kcal for boys and 2285.48 kcal for girls, which were similar to those reported by Albano et al. (2001)21 in São
Paulo (2733.87 kcal for boys and 2197.23 kcal for girls), who also used a 24hR. A study analyzing the mean caloric intake found in several other studies6 veriied that in all
cases the boys presented higher values. This is to be expected since that boys require a higher energy intake than girls.
Concerning macronutrients, approxi-mately half of the subjects presented a low intake of carbohydrates and a high intake of proteins and lipids. This agrees with Nuzzo (1998)22, who observed that the
consump-tion of carbohydrates by adolescents was below the recommended standard while their consumption of proteins and lipids was high. Carmo et. al.16 also emphasized
the high intake of lipids (36.7%) found among the adolescents from Piracicaba. Such an unbalanced diet can contribute to a higher risk of overweight and obesity during adolescence.
Upon analyzing the number of portions for each Food Pyramid group, quantitati-ve similarities were found for sources of
macronutrients, vitamin A, calcium and iron (Table 2). More studies using the food groups as a parameter for quantitative comparison would be both important and necessary. According to the DRI, vitamin A consumption was low for most of the adolescents, as was the intake of dairy, fruit, greens and vegetables. Appropriate consumption of the liposoluble vitamin A is essential for maintaining ocular health and is especially important for normal skeletal growth and development during this phase. The mean consumption of calcium among the adolescents (541.30mg) was less than 50% of the recommended stan-dard, a inding repeated in other studies
21, 22, 23. When comparing the 24hR results
to the Food Pyramid for adolescents 13, it
was observed that the primary source of calcium, the dairy group, amounted to only 0.32 of the expected amount (Table 4). A study of adolescents carried out in the city of Guarulhos, São Paulo22 resulted in
similar indings: in the sample of 400 24hRs, 1600 occurrences for the dairy group were expected but only 673 were found (0.42) for milk and cheese.
Humans can only obtain calcium
gh the diet; it is important to ensure sufi-cient ingestion of this mineral for complete skeletal growth and maturation, especially considering that it is during adolescence that the acquisition of bone mass reaches its peak23.
Iron intake was above that recommen-ded for most adolescents, but it was still low in a majority of the girls. This result is concerning, because girls have a greater need for this mineral to compensate for postmenarcheal losses3. Nevertheless,
iron was the mineral closest to the recom-mended values, perhaps due to a greater consumption of beans and meat than other foods from the cereal, fruit and vegetable groups. If lunch and supper were not ski-pped, it would be reasonable to assume that these adolescents could reach the iron recommendation, since the meat group frequency was close to the expected level, and the principal consumption of meat normally occurs during these two meals.
The evaluation of meal frequency was satisfactory, seeing that 79% of the sub-jects had breakfast, 93% had lunch, and 94% had supper, which are strong values for the three main meals. In a study eva-luating the eating habits of adolescents in the city of Porto Alegre, Rio Grande do Sul24, 96% of the adolescents had lunch
and 86.8% had supper every weekday. In the state of Bahia, the percentage was even higher: 96.6% of the adolescents had three or more meals per day25.
However, the percentage of adolescents who skipped breakfast was high (21%), gre-ater than values from the cities of Niterói, Rio de Janeiro26 (13.6% for boys and 18.7%
for girls), Porto Alegre24 (16%), Viçosa, Minas
Gerais27 (11%), Rio de Janeiro28 (8%) and
Guarulhos22 (2.5%).
Skipping meals is a very common habit among adolescents, especially breakfast, and this could have contributed to the difi-culty achieving nutritional needs, especially calcium, found in this study. Because many important foods commonly ingested at me-altimes (e.g. rice, beans and salad) are rarely consumed at other times of the day, this
ha-bit can increase the risk of obesity as well as negatively affect school performance3, 26,28.
Another eating characteristic of adoles-cents is to replace a more traditional lunch and/or supper for caloric snacks usually la-cking in nutritional value such as soft drinks, cookies, chocolate, ice cream, French fries, and potato chips 3,11.
The criterion meal replacement, howe-ver, presented satisfactorily low results. In addition, the main foods used to replace meals were: French bread, margarine, milk, chocolate milk, and soft drinks. These foods, with the exception of the last item, can be considered healthy and nutritive. The ex-pectation was to ind a higher consumption of fast food and processed foods like potato chips and sweets in general. However, it is important to point out that there are no major fast food chains in Ilhabela, and the access to such venues could further be limited due to low family income and their disproportionately high prices in Brazil29.
In order to illustrate the adolescents’ intake according to the Food Pyramid 23, the
groups with the highest and lowest intake frequency were replaced in the igure to allow better visualization of the results. The fats, oils and sweets group served as the base of the pyramid, and due to the low intake of fruit and vegetables, this group was at the top of the pyramid.
In another study based on the Food Pyramid, Dalla Costa et al.30 observed that
considering foods and not just isolated nutrients would serve the public interest better, since this approach would be more tangible and could more easily be trans-formed into health practices, such as local public initiatives to develop healthier eating habits.
Other studies evaluating food intake found similar results. Researchers evalua-ting 4452 adolescents in the city of Pelotas, Rio Grande do Sul31, found out that the
vegetables in about 89% of the subjects according to the recommendations of the Food Pyramid 32.
In the present study, aside from the small quantities, the varieties of fruit and vegetables were also quite limited (only bananas, oranges, apples, lettuce, onions and tomatoes), indicating possible food monotony, which could be related to higher risk of nutritional deiciencies.
The adolescents presented a higher consumption of beans than expected (1.20), which could have contributed to the high protein intake. Eating beans can be encou-raged because it is a traditional component of Brazilian cuisine and they have high nu-tritional value due to concentrations of iber, proteins, iron and folic acid, making them an important source of iron and protein for low income adolescents.
Intake from the group including meat and eggs was considered satisfactory be-cause it was close to the expected frequency (0.85). Even though ish is not stereotypi-cally a part of adolescent eating habits 4,25,
it was expected that subjects from Ilhabela,
an island, would have it more frequently in their meals due to availability and low cost. The evaluation of the adolescents’ food intake according to the Food Pyramid groups was methodologically satisfactory because it allowed the identiication of eating patterns. Additionally, the methodology of using the observed/expected frequency (Table 4) of each Pyramid group allowed a faster and more effective visualization of eating patterns.
Adolescents should be instructed to mo-dify their eating habits to better conform to the Food Pyramid for Adolescents, reducing the intake of fats and sugars while increasing the consumption of fruit, vegetables and whole grains. School- and community-based intervention measures are necessary to develop a healthy lifestyle in adolescence and to maintain it in adulthood.
Based on the results presented in this study, we can conclude that most of these adolescents presented caloric insuficiency with an alarmingly low consumption of fruit and vegetables. Even though the meal fre-quency pattern was considered satisfactory, breakfast should be especially encouraged.
References
1. Philippi ST. Alimentação saudável e a pirâmide dos alimentos. In: Philippi ST. Pirâmide dos alimentos - Fundamentos básicos da nutrição. Barueri: Manole; 2008. p.1-29.
2. World Health Organization. Nutrition in adolescence: issues for the health sector: issues in adolescent health and development. Geneva; 2005. http://www.who.int/ child_adolescenthealth/publications/ADH/Discussion_ papers.htm/ [acessado em 20/Mar/2008].
3. Fisberg M, Bandeira CRS, Bonilha EA, Halpern G, Hirschbruch MD. Hábitos alimentares na adolescência. Pediatr Mod 2000; 36: 766-70.
4. Carvalho CMRG, Nogueira AMT, Telles JBM, Paz SMR, Sousa RML. Consumo alimentar de adolescentes matriculados em um colégio particular de Teresina, Piauí, Brasil. Rev Nutr 2001; 14: 85-93.
5. Kazapi IM, Pietro PFD, Avancini SRP, Freitas SFT, Tramonte VLCG. Consumo de energia e macronutrientes por adolescentes de escolas públicas e privadas. Rev Nutr 2001; 14 (1 Suppl): 27-33.
6. Garcia GCB, Gambardella AMD, Frutuoso MFP. Estado nutricional e consumo alimentar de adolescentes de um centro de juventude da cidade de São Paulo. Rev Nutr 2003; 16: 41-50.
7. Veiga GV, Cunha AS, Sichieri R. Trends in overweight among adolescents living in the poorest and richest regions of Brazil. Am J Public Health 2004; 94:1544-1548.
8. World Health Organization. Physical status: use and interpretation of anthropometry. Report of a WHO Expert Committee.Geneva, 1995. [WHO Technical Report Series, 834].
9. Dunker KLL, Philippi ST. Recordatório alimentar de 24 horas “modiicado”, avaliação do consumo alimentar de adolescentes. [Apresentado ao I Congresso Latino-Americano de Nutrição Humana; 1999;Gramado, Brasil].
11. Andrade RG, Pereira RA, Sichieri R. Consumo alimentar de adolescentes com e sem sobrepeso do Município do Rio de Janeiro. Cad Saúde Pública 2003; 19: 1485-1495.
12. World Health Organization. Diet, Nutrition and the Prevention of Chronic Diseases. Report of a joint WHO/ FAO expert consultation.Geneva, 2003. [WHO Technical Report Series, 916].
13. Philippi ST, Aquino RC, Leal GVS. Necessidades e recomendações nutricionais. In: Palma D, Oliveira FLC, Escrivão MAMS. Guia de nutrição clínica na Infância e na adolescência. Barueri, SP: Manole, 2009. p. 55-67.
14. Philippi ST, Szarfarc SC, Latterza AR. Virtual Nutri [software]. Versão 1.0 for Windows. Departamento de Nutrição/ Faculdade de Saúde Pública/ Universidade de São Paulo, 1996.
15. Philippi, S.T. Tabela de Composição de Alimentos: suporte para decisão nutricional. Brasília: Anvisa, Finatec/Nut-UnB, 2001.
16. Carmo MB, Toral N, Silva MV, Slater B. Consumo de doces, refrigerantes e bebidas com adição de açúcar entre adolescentes da rede pública de ensino de Piracicaba, São Paulo. Rev Bras Epidemiol 2006; 9: 121-130.
17. Slater B, Marchioni DML, Voci SM. Aplicação de regressão linear para correção de dados dietéticos. Rev Saúde Pública 2007; 41:190-196.
18. Demory-Luce D, Morales M, Nicklas T, Baranowski T, Zakeri I, Berenson G. Changes in food group consumption patterns from childhood to Young adulthood: The Bogalusa Heart Study. J Am Diet Assoc. 2004; 104:1684-1691.
19. Thomson CA, Guiliano A, Rock CL, Ritenbaugh CK, Flatt SW, Faieber S, et al. Measuring dietary change in a diet intervention trial: comparing food frequency questionnaire and dietary recalls. Am J Epidemiol. 2003; 157: 754-762.
20. Block G. A review of validations of dietary assessment methods. Am J Epidemiol. 1982; 115: 492-505.
21. Albano RD, Souza SB. Ingestão de energia e nutrientes por adolescentes de uma escola pública. J Pediatr 2001; 77: 512-516.
22. Nuzzo L. Avaliação do estado nutricional de adolescentes de uma instituição particular de ensino [Dissertação de Mestrado]. São Paulo: Faculdade de Saúde Pública, Universidade de São Paulo; 1998.
23. Lerner BR, Lei DLM, Chaves SP, Freire RD. O cálcio consumido por adolescentes de escolas públicas de Osasco, São Paulo. Rev Nutr 2000; 13: 57-63.
24. Feijó RB, Sukster EB, Friedrich L, Fialho L, Dziekaniak KS, Christini DW, et al. Estudo de hábitos alimentares em uma amostra de estudantes secundaristas de Porto Alegre.Ped. 1997; 19: 257-262.
25. Santos JS, Costa MCO, Sobrinho CLN, Silva MCM, Souza KEP, Melo BO. Peril antropométrico e consumo alimentar de adolescentes de Teixeira de Freitas, Bahia. Rev Nutr 2005; 18: 623-632.
26. Fonseca VM, Sichieri R, Veiga GV. Fatores associados à obesidade em adolescentes. Rev Saúde Pública 1998; 32: 541-549.
27. Vieira VCR, Priore SE, Ribeiro SMR, Franceschini SCC. Alterações no padrão alimentar de adolescentes com adequação pôndero-estatural e elevado percentual de gordura corporal. Rev Bras Saúde Matern Infant 2005; 5: 93-102.
28. Estima CCP, Costa RS, Sichieri R, Pereira RA, Veiga GV. Meal consumption patterns and anthropometric measurements in adolescents from a low socioeconomic neighborhood in the metropolitan area of Rio de Janeiro, Brazil. Appetite 2009; 52: 735-739.
29. IBGE - Instituto Brasileiro de Geograia e Estatística. Resultados da Amostra do Censo Demográico 2000 - Malha municipal digital do Brasil: situação em 2001. Rio de Janeiro: IBGE, 2001. Disponível em: http://www.ibge. gov.br/cidadesat. Acesso em: 15 abr. 2008.
30. Dalla Costa MC, Cordini Júnior L, Matsuo T. Hábito alimentar de escolares adolescentes de um município do oeste do Paraná. Rev Nutr. 2007; 20: 461- 471.
31. Neutzling MB, Araujo CLP, Vieira MFA, Hallal PC, Menezes AMB. Freqüência de consumo de dietas ricas em gordura e pobres em ibra entre adolescentes. Rev Saúde Pública 2007; 41: 336-342.
32. Toral N, Slater B, Cintra IP, Fisberg M. Adolescent eating behavior regarding fruit and vegetable intakes.Rev Nutr 2006; 19: 331- 340.