TOWARDS A GIS-T DATABASE DESIGN AND
IMPLEMENTATION FOR PUBLIC TRANSIT PLANNING
Zakaria Robert Ngereja
ii
TOWARDS A GIS-T DATABASE DESIGN AND IMPLEMENTATION
FOR PUBLIC TRANSIT PLANNING
The case study of Dar-es-Salaam metropolitan city, Tanzania
Dissertation supervised by
Professor Pedro da Costa Brito Cabral, PhD
Dissertation co-supervised by
Professor Marco Octávio Trindade Painho, PhD
Professor Michael Gould, PhD
iii
DEDICATION
This dissertation is dedicated to my beloved wife Olipa and daughter
iv
ACKNOWLEDGEMENTS
Iwould like to express my sincere gratitude to the Education, Culture,
and Youth Commission of the European Union for granting Erasmus Mundus
Scholarship, which has made my study towards MSc. Degree in Geospatial
Technology possible, and has contributed significantly to building human
resource capacity for my country and my employer at Ardhi University.
I greatly appreciate the coordinators of the program from Universitat
Jaume I in Spain where I started my first semester, Institute for
Geoinformatics (IFGI), University of Münster, Germany for the second
semester and ISEGI, New University of Lisbon, where my dissertation project
was done and completed for their facilitation and support that made life go
through smoothly in all countries. Thanks Professor Michael Gould from
Universitat Jaume I, Castellon, Spain; Dr. Christoph Brox from Institute for
Geoinformatics (IFGI), University of Münster, Germany and Professor Marco
Octávio Trindade Painho of the Higher Institute for Statistics and Information
Management, New University of Lisbon, Portugal.
I wish to extend deep gratitude to my main supervisor, Professor
Pedro da Costa Brito Cabral for his guidance and constructive inputs to my
project. I also appreciate the kindness and willingness of his consultation time
he gave from time to time. My very special thanks go to my loving wife Olipa
Simon for her encouragement and support throughout the entire period of
studies. I sincerely appreciate the effort, and time she used in taking care of
family in my absence.
Zakaria Robert Ngereja,
Lisbon,
v
TOWARDS A GIS-T DATABASE DESIGN AND IMPLEMENTATION
FOR PUBLIC TRANSIT PLANNING
The case study of Dar-es-Salaam metropolitan city, Tanzania
ABSTRACT
In the last decade, we have witnessed tremendous advances and
developments in the applications of Geographic Information Systems (GIS), in
terms of technological hardware, software, methods, and data models. One
of the applications that have attracted much attention in the use of GIS is the
transportation sector mainly for planning, public transport routing,
management and operations. This has made it important to have a unified or
universal GIS-T standard data model, specifically, in the area of transportation
applications. Several data models have been developed over the past 20
years, like the ArcInfo route system, National Cooperative Highway Research
Program (NCHRP) Project 20-27, Federal Geographic Data Committee,
Enterprise GIS-T data model and the UNETRANS data model to mention just
few. This research project focused into the GIS-T database design and
implementation for public transit planning and management in the
Dar-es-Salaam City, and used part of the UNETRANS data model. As part of this
research, the UNETRANS data model was thoroughly examined, and
extracted useful elements useful for the geodatabase design of GIS-T for
Dar-es-Salaam City. The outcome of the project is a designed GIS-T database
model for Dar-es-Salaam and its prototype implementation in ArcGIS 9.3. In
addition, an output of the network analysis for determining the closest bus
stop to hospitals, shortest routes from an incident location as well as service
area surrounding hospital facilities, and recommendations for future works
vi
KEYWORDS
Database
Data Model
Geographic Information Systems
Geographic Information Systems for Transportation
vii
ACRONYMS
ESRI - Environmental Systems Research Institute
GDFS - Geographic Data File Standard
GIS - Geographic Information System
GIS-T - Geographic Information System for Transportation
IRA - Institute of Resource Assessment
NCGIA - National Centre for Geographic Information Analysis
NCHRP - National Cooperative Highway Research Program
SUMATRA - Surface and Maritime Transportation Regulatory Authority
TIS - Transportation Information System
viii
TABLE OF CONTENTS
DEDICATION ... iii
ACKNOWLEDGEMENTS ... iv
ABSTRACT ... v
ACRONYMS ... viii
INDEX OF TABLES ... x
INDEX OF FIGURES ... xi
1. INTRODUCTION ... 1
1.1 AN OVERVIEW ... 1
1.2 RESEARCH PROBLEM ... 3
1.3 RESEARCH OBJECTIVES ... 3
1.4 RESEARCH QUESTIONS ... 3
1.5 RESEARCH HYPOTHESIS ... 4
1.6 STRUCTURE OF THE THESIS ... 4
2. LITERATURE REVIEW... 6
2.1 INTRODUCTION ... 6
2.2 CONCEPTS AND COMPONENTS OF GIS ... 6
2.3 GIS FOR TRANSPORTATION ... 8
2.3.1 Applications within GIS-T ... 10
2.3.2 Users of GIS-T ... 11
2.4 GIS-T DATA MODEL ... 12
2.4.1 The Enterprise GIS-T Data Model ... 13
2.4.2 The UNETRANS Data Model ... 15
2.4.3 Improved UNETRANS Data Model ... 18
2.5 CONCLUSIONS ... 19
3. BUILDING A TRANSPORTATION DATA MODEL FOR DAR ES SALAAM ... 21
3.1 INTRODUCTION ... 21
3.2 THE STUDY AREA ... 21
3.3 DATA AVAILABILITY, QUALITY AND COMPLETENESS ... 23
3.4 METHODS ... 24
ix
3.4.2 Logical Model design ... 28
3.4.3 Physical Model Design ... 30
3.5 SETTING-UP THE GEODATABASE ... 31
3.5.1 Creating Geodatabase in ArcGIS-ArcInfo ... 32
3.5.2 Creating Roads and Bus Route Feature Datasets ... 33
3.5.3 Creating Transport Junctions Feature Class ... 35
3.5.4 Creating Network Datasets... 36
3.5.5 Populating Geodatabase ... 37
3.5.6 Network Analysis Applications ... 38
3.6 RESULTS ... 39
3.6.1 GIS-T Database Model ... 39
3.6.2 Network analysis on a network location ... 40
3.7 CONCLUSIONS ... 45
4. CONCLUSIONS AND RECOMMENDATIONS ... 46
4.1 MAIN CONCLUSIONS ... 46
4.2 VERIFICATION OF RESEARCH QUESTIONS AND HYPOTHESIS ... 47
4.2.1 Verification of research questions... 47
4.2.2 Verification of research hypothesis ... 48
4.3. LIMITATIONS AND FUTURE WORK ... 49
4.4 RECOMMENDATIONS ... 50
BIBLIOGRAPHIC REFERENCES ... 51
x
INDEX OF TABLES
Table 1: GIS Application groups as identified by Sutton (Sutton, 2004) ... 11 Table 2: The entity types and definitions for the Enterprise data model ... 14 Table 3: Entity definitions of the basic enterprise data model (Duecker, 1997)
... 15 Table 4: Event subtypes for the enterprise data model (Duecker, 1997)... 15 Table 5: The layer view descriptions of the UNETRANS data model (Curtin,
2003) ... 16 Table 6: Analysis view descriptions of the UNETRANS data model (Curtin,
2003) ... 18 Table 7: Aggregated package definition of the UNETRANS data model (Butler, 2008) ... 19 Table 8: The type of data used in the research and their source ... 24 Table 9: Object and Feature class definitions for the conceptual design of the
xi
INDEX OF FIGURES
Figure 1: Structure and Organization of the thesis ... 5
Figure 2: GIS-T as an integrated GIS and Transportation Information System (TIS) ... 10
Figure 3: The role of data model in GIS (Longley, 2005) ... 12
Figure 4: The basic enterprise GIS-T data model (Duecker, 1997) ... 14
Figure 5: Analysis diagram of the UNETRANS data model (Curtin, 2003) ... 17
Figure 6: The improved UNETRANS packages (Butler, 2008) ... 19
Figure 7: Location of the study area: Dar-es-Salaam, Tanzania ... 22
Figure 8: Research methods ... 25
Figure 9: Data model packages for Dar-es-Salaam ... 25
Figure 10: Conceptual design of the network package for Dar-es-Salaam case study ... 26
Figure 11: Conceptual design of Events Package ... 27
Figure 12: Logical design of the Network package ... 29
Figure 13: Logical design of the Events package ... 30
Figure 14: ArcGIS Geodatabase types (ESRI, 2007b) ... 31
Figure 15: Primary dataset types in geodatabase ... 32
Figure 16: The creation of geodatabase in ArcGIS-ArcInfo ... 33
Figure 17: Part of road feature dataset of Dar-es-Salaam city ... 34
Figure 18: Part of Bus Routes feature dataset of Dar-es-Salaam city ... 35
Figure 19: Part of transport junctions within road feature dataset ... 36
Figure 20: The Network dataset for DarRoads (a) and BusRoutes (b) respectively ... 37
Figure 21: An example showing the closest bus stops to the network location (Hospital facilities) ... 41
Figure 22: An example showing routes to nearest hospitals from a simulated accident location on a network ... 42
Figure 23: Illustrated service area at 1000m ring from Hospital facilities ... 43
1
1. INTRODUCTION
1.1 An Overview
A Geographic Information System (GIS) is a technology with unique
and valuable applications for policy makers, planners, engineers, and
managers in many fields, including the transportation sector. In a broad
sense, a GIS is an information system specializing in the input, storage,
manipulation, analysis, reporting, and visualization of geographically
referenced data (de By 2004, Worboys 2004, Longley 2005, Shaw 2006).
Among the wide range of potential applications of GIS, the
transportation sector has received a lot of attention and has become of much
interest in recent years (Shaw 2006). This is in the context that many transport
information problems exist in a geographic context (geographic location).
The result of this is the emergence of a new and specific branch within GIS
applied to transportation issues commonly referred to as GIS-T. GIS-T is a GIS
for Transportation, and has been defined as “principles and applications of
applying geographic information technologies to transportation
problems
The transportation sector has many dimensions in which GIS-T can be
applied, they cover a wide range of transportation issues such as
infrastructure planning, design and management, transportation safety
analysis, travel demand analysis, traffic monitoring and control, public transit
planning and operations, environmental impacts assessment, hazards
mitigation, and Intelligent Transportation Systems (ITS) (Shaw 2006). A GIS-T
integrates transport network databases and spatial databases in a GIS-based
information system to facilitate planning functions and decision-making
2
transportation related data in order to facilitate the input, analysis, and
display of transport networks.
The use of GIS for transportation applications gained momentum in
the 2000’s when Environmental Systems Research Institute (ESRI), which is a
software development and services company, initiated and funded a project
to develop a generic data model for transportation applications. Under the
project, ESRI in collaboration with the National Centre for Geographic
Information Analysis (NCGIA) at the University of California, Santa Barbara;
developed a transportation data model called the Unified Network for
Transportation (UNETRANS) using ESRI ArcGIS 8 software (Huang 2003,
NCGIA 2003). The data model is now an ESRI’s ArcGIS standard
transportation data model which is implemented in ArcGIS 8.3 and its
subsequent upgrades of ArcGIS 9.X. UNETRANS is a comprehensive
conceptual object model for transport features, incorporating multiple modes
of travel, and accommodating multiple scales of interpretation of the real
world (NCGIA 2003).
A data model for transportation, in this case UNETRANS is complex
because it cater for varied uses of transportation data. Therefore, the model
may be customized to specific uses based on the type of transportation data.
This research is aimed at studying the UNETRANS data model and extract
relevant packages, classes and attributes to design and implement a
prototype GIS-T for Dar-es-Salaam city. Some of the packages, classes, and
attributes may not be relevant depending on the country’s way of keeping
3
1.2 Research Problem
Dar-es-Salaam city experiences poor public transport system
(Kanyama 2004), the existing transport system lacks among other
characteristics; passenger trip guidance, bus route maps and a GIS for
transportation route planning and operations. Therefore, there is a need for
implementing a geographic database for public transportation planning and
operations within the city. This will greatly enhance efficiency and facilitate
transportation planning and operations of the public transportation within
the city.
1.3 Research Objectives
The main objective of the research is to design and create a prototype
of Geographic Information System for Transportation (GIS-T) database for
public transport route planning and operations in Dar-es-Salaam City. The
specific objectives of the research are to:
i. Review and analysis of the existing GIS for Transportation data
model, specifically the ESRI’s ArcGIS standard Unified Network
Transportation (UNETRANS) data model;
ii. Design a GIS-T database for public transport route planning and
operations for Dar-es-Salaam City;
iii. Apply the design through prototyping.
1.4 Research Questions
The questions that this research will address are: what are appropriate
packages, classes and attributes in GIS-T data model that will support public
transport planning and operations for Dar-es-Salaam City? This question may
4
i. Is the Unified Network for Transportation (UNETRANS) data
model as a whole suitable for Dar-es-Salaam city public
transport planning and operations?
ii. Is the available spatial data for Dar-es-Salaam city fit in the
UNETRANS data model?
1.5 Research Hypothesis
The overall hypotheses that my research argues are the following:
i. It is possible to build an effective transportation data model for
Dar-es-Salaam City based on part of the UNETRANS GIS-T data
model;
ii. Building an effective GIS-T data model for Dar-es-Salaam City
requires comprehensive spatial data and technology;
iii. Lack of well-documented and organized transportation data is a
hurdle to effective GIS-T database design and implementation.
1.6 Structure of the Thesis
This dissertation is organised into four main parts (see Figure 1). Part 1
is the introduction and consists of an overview, statement of the problem,
research objectives, research questions, and hypotheses of the research. Part
2 examines the literature review related to Geographic Information System, a
highlights of general concepts and definitions of GIS is given as well as
applications for transportation (GIS-T). It also reviews an enterprise GIS-T
data model and the Unified Network Transportation (UNETRANS) Data
Model. Part 3 is about building a transportation data model for
Dar-es-Salaam. In this section; the study area, methods used, and results are
5
research, it also underscore some limitations and future work that need to be
undertaken.
Figure 1: Structure and Organization of the thesis
INTRODUCTION
LITERATURE REVIEW
BUILDING A TRANSPORTATION DATA MODEL FOR
DAR-ES-SALAAM
CONCLUSIONS AND RECOMMENDATIONS
• An overview
• Objectives
• Research Questions
• Research Hypothesis
• Structure of the Thesis Part 1
• Main conclusions
• Limitations and future work
• Recommendations Part 4
• Introduction
• The study area
• Data availability, quality and completeness
• Methods
• Setting-up the geodatabase Part 3
• Introduction
• Concepts and Components of GIS
• GIS for Transportation
• Application within GIS-T
6
2. LITERATURE REVIEW
2.1 Introduction
This chapter describes briefly the general overview of GIS and
highlights the key concepts, key components and data structure applied in
GIS systems. A brief and general overview of the GIS-T is also presented,
highlighting the applications within GIS-T, some selected examples of GIS-T
applications and users of GIS-T. In part two, the GIS-T Data model is
explained with more emphasis on the Unified Network Transportation
(UNETRANS).
2.2 Concepts and Components of GIS
The general concepts and components of GIS are quite familiar to
almost all who deals with GIS. Since the emergency of GIS in the 1960’s, there
have been developments in the field, which has lead to the refinement of the
GIS definition, core components, and its key functions. There is no single
definition of the term GIS, and the definitions vary from one user to another
to suit his/her application area. However, the following definitions are
prominent and acceptable among GIS users and researchers.
Longley (2005) defined GIS as follows; “Geographic information systems
are a special class of information systems that keep track not only of
events, activities, and things, but also of where these events, activities,
and things happen or exist.”
de By (2004) defined a geographic Information System as “a
7
analysis, and presentation especially in cases when we are dealing with
geo-referenced data”
Burrough was quoted in Maguire (1991) defined it as “a powerful set of
tools for collecting, storing, retrieving at will, transformation and
displaying spatial data from the real world’.
Worboys (2004) have defined Geographic information system (GIS) as
“a computer-based information system that enables capture, modeling,
storage, retrieval, sharing, manipulation, analysis, and presentation of
geographically referenced data”
The main common and important element in all definitions is that GIS
deals with data that has a geographic location (geo-referenced data or
spatially referenced data. All definitions tell what GIS does; specifically the
one given by Worboys (2004) is a functional-based definition that enlists the
functions of GIS-based information system.
In the last decade from 1990s, Goodchild (1991) defined the well
known four components of GIS which operate in institutional settings and
comprised of the following; computer hardware, computer software, data and
people. However, today, due to advances and developments that has evolved
in the GIS field in the 2000s, the network is today’s most fundamental GIS
component, and of course procedures. Thus, there are six main components
of GIS as maintained by Longley (2005) and Worboys (2004), namely:
i. Computer hardware;
ii. Computer software;
8
iv. People;
v. Procedures, and
vi. Network.
Another vital concept is data structure, GIS employ two types of data
structures for representing objects in the computer environments, the two
famous structures are vector and raster data. Much have already been written
about GIS data structures or data models, as it can be found in many
literatures like (Maguire 1991, Bernhardsen 1992, Burrough 1998, de By 2004,
Worboys 2004, Longley 2005, Neteler 2005, and Galati 2006).
In the GIS definition given by (Worboys 2004), he has enlisted some
functions which a GIS does. Generally, the functions of a GIS can be
generalized into five core functions, namely;
i. Data capture and editing;
ii. Data manipulation (storage, management, retrieval &
updating);
iii. Spatial analysis and modelling;
iv. Data integration;
v. Geovisualization (Output/Display).
2.3 GIS for Transportation
GIS have been widely used in the field of transportation since location
information is critical for transportation applications such as transportation
planning, intermodal facility management, pavement management, bridge
inventory and modelling, accident analysis, fleet management, transit service
9
transportation applications require transportation network data, and GIS has
been used for representation and analysis of transportation networks.
Thus, the GIS-T acronym was coined to refer to Geographic
Information Systems for Transportation. In the introduction section of this
report, GIS-T is defined as “principles of applying geographic information
technologies to transportation problems” (Miller and Shaw 2001) cited in
(Shaw 2006). GIS-T is a very broad term that encompasses all of the activities
that involve the use of geographic information systems for some aspects of
transportation planning and management. Government institutions, agencies
and private companies are just some of the entities that build and use GIS-T
applications (Curtin 2003, Rodrigue 2006).
GIS-T Application requires the design and development of a
geographic database that has the following key items:
i. Development of geo-database;
ii. Development of attribute or non-spatial database;
iii. Development of spatial referencing system.
Therefore, in general, transportation data that can be supported in GIS-T
includes nodes, links and networks, paths, and origin-destinations data. As a
matter of facts, GIS-T combines the use of GIS and Information Technology in
the transportation field known as Transportation Information System (TIS)
10
Figure 2: GIS-T as an integrated GIS and Transportation Information System (TIS) (Vonderohe, 1993)
2.3.1 Applications within GIS-T
Due to its broadest nature, GIS-T applications are very diverse; this
report is only mentioning a small sampling of the applications as examples
cited by (Curtin 2003, Rodrigue 2006) includes:
• Alternative Transport Planning;
• Bus Route Development;
• Emergence Dispatch and Route Planning;
• Fleet Management;
• Hazardous Waste Transport;
• Location Referencing Systems;
• Package and Service Delivery;
• Road Surveying and Engineering;
• Street Signage;
• Traffic Counts;
• Traffic Demand Modelling;
• Intersection Inventory.
A survey conducted by Sutton (2007) for the transportation research
board in the USA categorized GIS-T application into five groups, in which
GIS TIS
11
almost all applications of GIS-T falls in one or more of these groups listed
below (table 1).
Group Description
Planning Includes route and facility planning, automatic passenger
counting systems, demographic analysis, and modelling tool.
Information Technology It involves hardware, software, custom tools, and standards.
Operations Consists of vehicle and facility maintenance, vehicle location,
routing and scheduling, and real-time traffic information.
Management This is about safety, security and incident response, system
performance and reporting, asset management, and finance.
Customer service Deals with route planning, customer relations, real-time
customer information, public information, and marketing.
Table 1: GIS Application groups as identified by Sutton (Sutton, 2004)
2.3.2 Users of GIS-T
In section 2.3.1 on the applications within GIS-T, it is obvious that users
of GIS-T are also diverse group. In many cities and municipalities,
departments of transportation, urban planning, engineering & survey and
mapping, are using GIS-T. However, private sectors also do uses GIS-T for
activities such as fleet management, package and service delivery to mention
just few.
All users are in some way implementing a database of its kind that
requires some type of spatial datasets and business information. The
common datasets for all users will be transportation networks and place
names. On the other hand, users have to develop and implement a database
to facilitate several functions and activities of their processes. The common
items within several users provide an opportunity of data modelling, which
12
2.4 GIS-T Data Model
Any GIS is built under certain data model; according to Longley et al
(2005), data model is the heart of any GIS. There are several definitions of the
term “data model“, which essentially mean the same thing. Butler (2008)
define data model as “a set of construction plans for a database”, while
Longley et al (2005) define it as “set of constructs for representing objects and
processes in the digital environments of the computer”. This means in order to
represent transportation data which are having both spatial and non-spatial
characteristics in a computer environment, there must be a way of
representing all the objects and processes in a geographic database. Through
data model, people can implement, interact, query, and make analysis within
a geographic database. Therefore, data model plays a key role in GIS
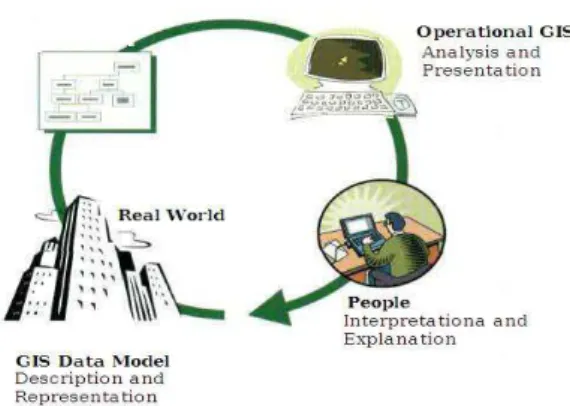
functionality as illustrated in Figure 3.
Figure 3: The role of data model in GIS(Longley, 2005)
There has been several data models developed in the past 20 years,
specifically, for the special needs of transportation datasets and applications.
They include the ArcInfo route system structure, National Cooperative
Highway Research Program (NCHRP) Project 20-27(3), the Transportation
Feature Identification Standard (TFIS) proposed by the Federal Geographic
13
2008). However, Duecker (1997) came up with the data model named
Enterprise GIS-T Data Model which tried to bring consistency to the
representation as well as sharing of transportation data. In reviewing GIS-T
data sharing issues, Dueker (1999) noted the two specific data models namely
Geographic Data File Standard (GDFS) and the NCHRP 20-27 as the mostly
used by transportation agencies in the USA. The later data model was the
one tried to standardize GIS-T data models in the United States of America.
Effortless endeavours to develop a universal industry standard GIS-T
data model continued, the result of which is the Unified Network
Transportation data model abbreviated as UNETRANS. This was a result of
collaboration between software developer and provider, ESRI and the
National Centre for Geographical Information Analysis (NCGIA), University of
California at Santa Barbara. The developed UNETRANS is to be a unified or
universal as well as industry standard GIS-T data model. This data model is an
ESRI’s ArcGIS standard transportation data model.
It is not the intention of this research to make a detailed review of all
mentioned data models, but only two data models are dealt with in the
following two sub-sections. More importantly, the UNETRANS data model is
the focus of this research and thoroughly reviewed.
2.4.1 The Enterprise GIS-T Data Model
The enterprise GIS-T data model was developed by (Duecker and
Butler (1997) and aimed at providing a universal enterprise-level data model
and physical database design for GIS to be used by transportation agencies.
The model developed using entity-relationship diagrams, and the entire
model comprised of the basic data model in figure 4 having the following
14
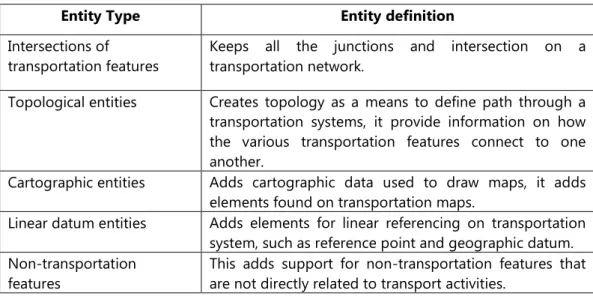
Entity Type Entity definition
Intersections of transportation features
Keeps all the junctions and intersection on a transportation network.
Topological entities Creates topology as a means to define path through a
transportation systems, it provide information on how the various transportation features connect to one another.
Cartographic entities Adds cartographic data used to draw maps, it adds
elements found on transportation maps.
Linear datum entities Adds elements for linear referencing on transportation
system, such as reference point and geographic datum. Non-transportation
features
This adds support for non-transportation features that are not directly related to transport activities.
Table 2: The entity types and definitions for the Enterprise data model (Duecker, 1997)
Developers of this data model were focusing on transportation data sharing
between various transportation agencies. This is one of the transportation
data models that tried to unify the way transportation data can be
represented and shared among GIS-T users.
Figure 4: The basic enterprise GIS-T data model (Duecker, 1997)
15
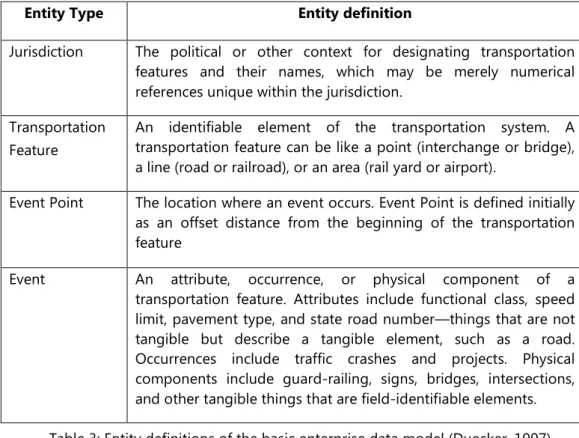
Table 3: Entity definitions of the basic enterprise data model (Duecker, 1997)
Subtype Event Subtype event definition
Point Event A component or attribute that is found at a single location (one
event point). Point events may occur independently or on transportation features of the linear or area form
Linear Event A component or attribute that is found along a segment of a linear
transportation feature. Linear events are defined by two event points (beginning and ending). Linear events may occur only on linear transportation features
Area Event A transportation feature component or a non-transportation entity
that affects a transportation feature. Areas can be explicitly represented as polygons or implicitly represented as to where they intersect transportation features.
Table 4: Event subtypes for the enterprise data model (Duecker, 1997)
2.4.2 The UNETRANS Data Model
The UNETRANS data model has a primary focus on the needs of
organizations that manage road and rail transportation networks. The model
is intended to provide a usable transportation GIS data model to: simplify
Entity Type Entity definition
Jurisdiction The political or other context for designating transportation
features and their names, which may be merely numerical references unique within the jurisdiction.
Transportation Feature
An identifiable element of the transportation system. A transportation feature can be like a point (interchange or bridge), a line (road or railroad), or an area (rail yard or airport).
Event Point The location where an event occurs. Event Point is defined initially
as an offset distance from the beginning of the transportation feature
Event An attribute, occurrence, or physical component of a
16
enterprise project implementation, encourage consistency in data structures
to facilitate data sharing and provide a common starting point for application
developers (Curtin et al 2003). In principle, the UNETRANS data model has
become the ESRI’s ArcGIS standard transportation data model designed to
help in the development of transportation applications. According to Curtin
et al (2003), the UNETRANS data model is presented in two ways: a layer view
of the data model, and an analysis diagram view of objects that comprise the
data model.
2.4.2.1 Layer View of UNETRANS data model
The best way of visualizing geographic data is to separate objects from
one another into layers of objects that share some similarity and functions.
These transportation layers can be combined to develop a transportation
application. Therefore, the UNETRANS data model separates three types of
transportation layers as shown in table 5 below.
Layer Descriptions
Reference
Network
The transportation network consists of several sets of data that represents the roads, railroads, waterways and other pathways along which transportation activities take place in a linear spatial representation.
Route Feature Route feature layer that are built from the links in the Reference Network
Layer.
Events Transportation-related objects that are related to the Reference Network
or Route Feature but are not part of the network itself. However, these events are integral to the operation of the transportation system.
Table 5: The layer view descriptions of the UNETRANS data model (Curtin, 2003)
2.4.2.2 Analysis diagram view of UNETRANS data model
The analysis diagram view illustrated in figure 5 is a layout of all the
data objects that comprise the data model. Different objects specified with
17
connections. Therefore, all the objects and features comprising the
UNETRANS data model are presented in the analysis diagram. These
diagrams contain set of packages that contains subsets of these feature
classes and tables. Each feature class represents a table of information in the
database that is represented by a single class box in the diagram. The analysis
diagram uses the Unified Modelling Language (UML) notations.
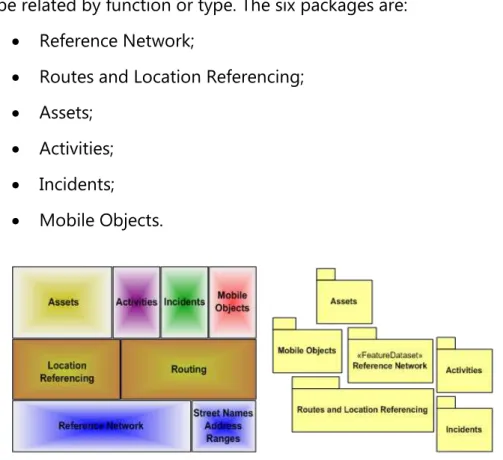
The UNETRANS data model is sub-divided into six logical groups
called packages of related objects and feature classes. A package of objects
may be related by function or type. The six packages are:
• Reference Network;
• Routes and Location Referencing;
• Assets;
• Activities;
• Incidents;
• Mobile Objects.
Figure 5: Analysis diagram of the UNETRANS data model (Curtin, 2003)
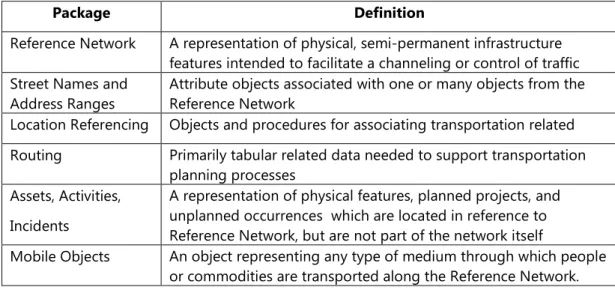
Each package illustrated in figure 5 above represent some activities or
functions in the data model; thus, table 6 below present the definitions
18
Package Definition
Reference Network A representation of physical, semi-permanent infrastructure
features intended to facilitate a channeling or control of traffic Street Names and
Address Ranges
Attribute objects associated with one or many objects from the Reference Network
Location Referencing Objects and procedures for associating transportation related
Routing Primarily tabular related data needed to support transportation
planning processes Assets, Activities,
Incidents
A representation of physical features, planned projects, and unplanned occurrences which are located in reference to Reference Network, but are not part of the network itself
Mobile Objects An object representing any type of medium through which people
or commodities are transported along the Reference Network.
Table 6: Analysis view descriptions of the UNETRANS data model (Curtin, 2003)
2.4.3 Improved UNETRANS Data Model
According to Butler (2008) the evolution and advancement of ArcGIS
technology has necessitated the refinement and improvements of the
original data model. The improved data model consists of four packages
because of aggregation of the original six packages. The aggregated new
packages are as shown in the analysis diagram in figure 6, and the associated
package definitions in table 7.
The improved data model include support for transportation facilities
of all types, including their characteristics and elements, it also include
editing support offered by ArcGIS software, another improved feature is the
ability to support temporal data and a separation of position data from other
entity attributes. This feature allows multiple datums to be accommodated in
19
Inventory Network
Events Mobile
Objects
Figure 6: The improved UNETRANS packages (Butler, 2008)
The following table explains various package definitions of the improved
UNETRANS data model.
Package Definitions
Inventory This package includes support for all types of transportation
facilities, including their characteristics and elements
The Network This takes care of the transportation-specific network data model
used by ArcGIS Network Analyst extension, which replaces the geometric network model used by the original UNETRANS
The Events This combines the former Activities and Incidents packages into
comprehensive group of entities that representing things that happens on and to transport facilities.
The Mobile Objects This package involves users of the transport system and it
expands the original Mobile Object package.
Table 7: Aggregated package definition of the UNETRANS data model (Butler, 2008)
2.5 Conclusions
This chapter has reviewed in brief the concepts of GIS. It has also
highlighted the concepts of GIS-T and its various transportation applications
within GIS-T. Finally, it has discussed issues related to data models,
specifically GIS-T data models used in the transportation sector, namely, the
Enterprise GIS-T and the UNETRANS data models. Parts of the discussed
ideas are used in chapter three to build a Transportation data model for
20
questions and hypothesis argued in chapter one which will be given in detail
21
3. BUILDING A TRANSPORTATION DATA MODEL FOR DAR ES SALAAM
3.1 Introduction
This chapter is about building a transportation data model and
designing a database for Dar-es-salaam. It will detail the methodology and
approach used for achieving the main objectives, hypothesis and research
questions that are addressed in this project. Situation analysis of
Dar-es-Salaam road network and availability of data are among the issue discussed.
Ultimately, the results achieved and observations that are drawn from the
project are given out.
3.2 The Study Area
The Dar-es-Salaam city (Figure 7) is located on the eastern part of
Tanzania between 6O
34’S and 7O
10’E along the Indian Ocean. It had a
population of 2.5 million according to 2002 census (National Bureau of
Statistics) which increased to approximately 4.0 million in 2008 (Kimbisa
2008). The city’s spatial extent was 30 km radius until 2001 (Kanyama 2004).
The city is having public transportation problems and road congestion
caused by poor road network infrastructure, increased number of vehicles
and unavailability of an efficient transport planning system which could ease
public transportation planning and management (Kanyama 2004).
Dar-es-Salaam city is currently in a process to implement a Rapid
Transport System named Dar-es-Salaam Rapid Transit (DART) (Kimbisa 2008).
The need for implementation of new transport mechanism requires not only
an information system, but also an information system that integrates
22
as well as transportation planners and managers. Therefore, GIS-T is the right
technology for the intended purpose.
Figure 7: Location of the study area: Dar-es-Salaam, Tanzania
A GIS-T integrates both non-spatial and spatial databases of transport
network to facilitate planning and routing functions and decision-making
processes. This also provides an efficient means for organizing basic
transportation related data in order to facilitate the input, analysis, and
23
The road network in Dar-es-Salaam is characterized and limited to
major trunk road network of national and regional level. The major trunk road
is arterial road network, which are the main entrance and exit to and from the
city respectively. The city consists of other roads at district and local level
known as access or collector roads and local or feeder roads. All together
form the core transportation network of the city. Most of access and feeder
roads are two directional single lane roads, and arterial roads are dual
carriageway (2 x 2) lanes at a certain length within the city.
3.3 Data Availability, Quality and Completeness
Data for this project were obtained from the Ardhi University, Institute
of Resource Assessment (IRA) of the University of Dar-es-Salaam and the
Surface and Maritime Transport Regulatory Authority (SUMATRA). The types
of data obtained were a GIS layer for Dar-es-Salaam roads and routes
information from SUMATRA’s website. However, the GIS layer for roads was
somehow incomplete because it lacked annotation of road names. Therefore,
other means like Google earth and personal experience with the city were
used to get those roads annotated. The quality of data sufficed the need of
this project, though the attributes of the data was not comprehensive and
incomplete to fit into the UNETRANS data model.
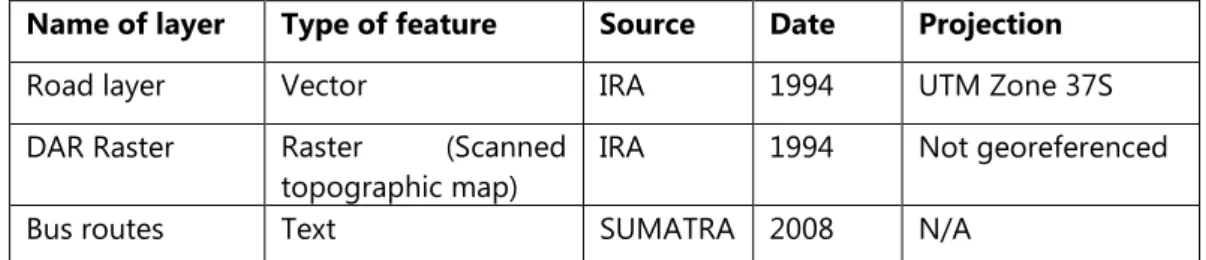
The following table 8 below shows the type of data used in this
research, type of feature, and source of data. The main GIS layers were vector
24
Name of layer Type of feature Source Date Projection
Road layer Vector IRA 1994 UTM Zone 37S
DAR Raster Raster (Scanned
topographic map)
IRA 1994 Not georeferenced
Bus routes Text SUMATRA 2008 N/A
Table 8: The type of data used in the research and their source
3.4 Methods
In order to tackle the stated problem in section 1.2 and accomplish the
outlined objectives in section 1.3, and ultimately answer the questions in
section 1.4, as well as the hypothesis in section 1.5 the following
methodological approach was used:
• Review of existing GIS-T data model, two data model were reviewed,
namely; GIS-T Enterprise data model and the UNETARANS model. Also
comprehensive Internet search from reliable websites such as ESRI and
published academic sources;
• Having studied the two existing data model, two packages have been
adopted for the proposed GIS-T database model for Dar-es-Salaam
City; the packages are the Network and Events packages. Detailed
explanation about the data model which includes; conceptual, logical
and physical model design is presented in subsequent sections 3.4.1.
through 3.4.3;
• Lastly, the proposed model design was implemented through
prototyping. During implementation, only a small part of the model
was implemented. Specifically, the Events Package was not
implemented. The Network package was implemented in ArcGIS 9.3
25
others were not populated due to unavailability of data. The methods
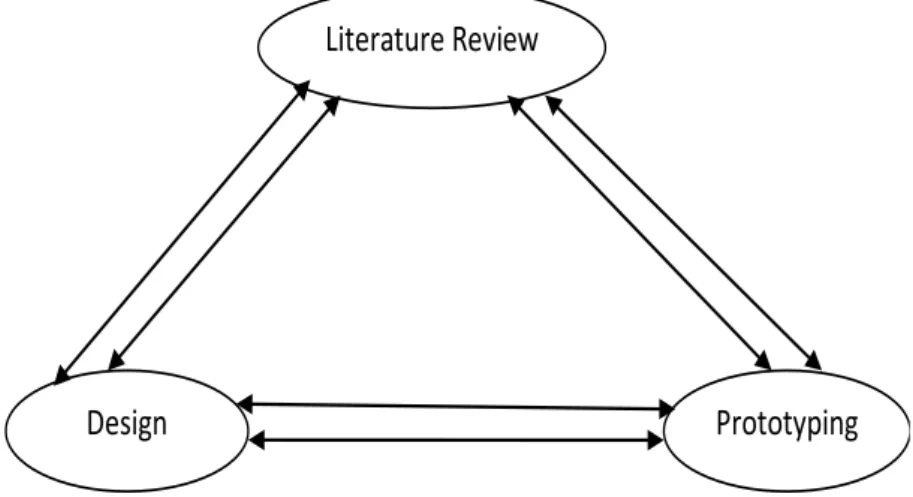
used are illustrated in figure 8 below.
Figure 8: Research Methods
3.4.1 Conceptual Model design
The conceptual model design for Dar-es-Salaam is a simplified model
that follows the UNETRANS data model because it is very comprehensive.
Thus, the conceptual model adapts two packages of the improved
UNETRANS data model, namely: the Network Package and Events Package
that areillustrated in figure 9. The proposed data model has been for
simplicity, taking into consideration the limitation of available spatial data.
The Network Package comprises a low‐level description of the transportation
network that includes basic transportation features (Road network, transport
routes, Junctions, bus stops, bus terminals).
Figure 9: Data model packages for Dar-es-Salaam
Network Events
Literature Review
26
Classes form packages, which can be either feature classes for spatial data or object classes for non-spatial data. These feature and object classes are depicted in figure 10 and figure 11 with their relationships as it will be implemented in the geodatabase. The corresponding feature and object class definitions are given in table 8 and table 9.
Figure 10: Conceptual design of the network package for Dar-es-Salaam case study
The following table presents features and object Classes definitions for the
Network Package.
Object/Feature Class Object/Feature class definition
SimpleJunctionFeature A simple feature class representing simple spatial feature
of transport network.
ObjectClass A list of tables representing non-spatial data related to
any transport network.
FeatureClass A spatial feature representing points, lines, or polygon on
transport network.
TransportJunction A feature that bounds a Route Link or any significant point
of interaction between transport routes.
BusRoutes An object that associates RouteFeature, BusStop or
BusTerminal into a comprehensive set of travel information.
RoadFeature Any linear object intended to represent a right-of-way for
transportation activities
27
Object/Feature Class Object/Feature class definition
BusStop A point where passengers can board or alight a public
transport.
BusTerminal One or more stops point close to each other. It is also a
type of TransportJunction representing a hub location for bus travel where passengers can board busses, transfer between busses, and obtain travel information.
BusInformation Records of all buses registered to carry transport business
as city buses.
Table 9 (Continues): Object and Feature class definitions for the conceptual design of the
Network Package
28
The following is a Features/Object Classes definition for the events package.
Feature Class Feature Class definition
Activity An Activity is one of several types of feature that
represents a planned operation. Activities are linearly referenced to the network. Activities can have point, line, or polygon spatial representations.
Incident Any type of unplanned, transient occurrence with a
reference to the Transport Network.
ActivityPoint The abstract feature class for any Activity that has a point
spatial representation.
ActvityLine The abstract feature class for any Activity that has a linear
spatial representation.
ConstructionPoint A construction activity with a point spatial representation,
referenced to the transportation network.
ConstructionLine A construction activity with a linear spatial representation,
referenced to the transportation network.
IncidentPoint Any type of Incident with a point representation.
IncidentLine Any type of Incident with a linear representation.
TrafficAccident A type of IncidentPoint representing a transient,
unplanned occurrence that must be maintained in the database.
LaneClosure A type of IncidentLine representing the transient,
unplanned closure of a lane on a BusRoute or
RoadFeature due to a TrafficAccident or other Incident.
Spill A type of IncidentPolygon representing the area affected
by an Incident such as a toxic spill or oil spill from a TrafficAccident on a TransportRoute.
RoadImprovementProject An object class representing any information about road
construction project undertaken on RouteFeature or Transport Network.
ConstructionPolygon A construction activity with a polygonal spatial
representation, referenced to the transportation network.
Table 10: Object and Feature Classes definition for the Events Package
3.4.2 Logical Model design
The purpose of logical design is to translate the conceptual schema
design into a logical schema customized to the specified database’s
29
database that can be processed by the database management software; it
includes attributes for each class or entity and data types for each attribute.
Therefore, a logical data model is the blueprint for designing and creating a
physical geodatabase (Baynon-Davies 2004, Butler 2008). In this case, the
designed logical schema is processed in the ArcGIS geodatabase model.
In fulfilling this, a logical design has been created using ArcInfo UML
model toolset template that is integrated into the ArcGIS-ArcInfo software,
and were developed using Microsoft Visio software. Thus, the conceptual
schema is mapped into logical design as presented in figures 12 & 13, and
whose entity descriptions were exemplified in tables 9 & 10 respectively.
Figure 12: Logical design of the Network package developed for the Dar-es-Salaam city case
30
Figure 13: Logical design of the Events package developed for the Dar-es-Salaam city case study.
3.4.3 Physical Model Design
Physical data model is the actual implementation of the logical data
model design where entities or classes are converted to relational tables in
specified database management systems (Baynon-Davies 2004, Butler 2008).
Therefore, the physical model design is implemented in ArcGIS 9.3 software
through geodatabase data model. A brief account about geodatabase is
given in the next section.
ConstructionLine ConstructionPolygon
+ObjectID : Object FeatureClass -ObjectID : Object
ObjectClass
+ActivityID : esriFieldTypeInteger +StartTime : esriFieldTypeDate +LocationDescription : esriFieldTypeString
Activity
+IncidentID : esriFieldTypeInteger +StartTime : esriFieldTypeDate +EndTime : esriFieldTypeDate +LocationDescription : esriFieldTypeString
Incident
+PointMeasure : esriFieldTypeDouble ActivityPoint
+FromMeasure : esriFieldTypeDouble +ToMeasure : esriFieldTypeDouble
ActivityLine
ConsturctionPoint
+StartTime : esriFieldTypeDate +EndTime : esriFieldTypeDate +PointMeasure : esriFieldTypeDouble
IncidentPoint
+FromMeasure : esriFieldTypeDouble +ToMeasure : esriFieldTypeDouble
IncidentLine
TrafficAccident LaneClosure
+IncidentID : esriFieldTypeInteger +StartTime : esriFieldTypeDate +EndTime : esriFieldTypeDate +FromMeasure : esriFieldTypeDouble +ToMeasure : esriFieldTypeDouble +LocationDescription : esriFieldTypeString
IncidentPolygon
+ProjectID : esriFieldTypeInteger +LocationDescription : esriFieldTypeString +EstimatedStartDate : esriFieldTypeDate +ActualStartDate : esriFieldTypeDate +EstimatedFinishDate : esriFieldTypeDate +ActualFinishDate : esriFieldTypeDate +MainContractor : esriFieldTypeString +ActualCost : esriFieldTypeInteger
RoadImprovementProject
31
3.5 Setting-up the geodatabase
According to Esri’s ArcGIS 9.3 Software documentation (ESRI 2007a)
Geodatabase is short form for “geographic database” and is data storage
format for ArcGIS products. Geodatabase is a collection of geographic
datasets of various types held in a common file system folder, a Microsoft
Access database, or a multiuser relational database management system. A
fundamental geodatabase concept is the dataset. It is the primary method
used to organize and use geographic information in ArcGIS products. ArcGIS
has three types of geodatabases (see also figure 14), namely:
i. File geodatabases - Stored as folders in a file system and
designed for use by one or a few people;
ii. Personal geodatabases - All datasets are stored within a
Microsoft Access data file. Like File geodatabase, it is also
designed for use by one or a few people;
iii. ArcSDE geodatabases - Stored in multi-user relational database
management system and designed to be accessed and edited
simultaneously by many users.
Figure 14: ArcGIS Geodatabase types (ESRI, 2007b) ArcGIS: – Geodatabase Types
Personal Geodatabase
File
Geodatabase GeodatabaseArcSDE
• Oracle
• SQL Server
• DB2
• Informix
32
The geodatabase contains three primary dataset types as illustrated in figure 15.
i. Feature classes
ii. Raster datasets
iii. Tables
Figure 15: Primary dataset types in geodatabase (ESRI, 2008)
The geodatabase designed such that there is a systematic data management
with common reference systems within the feature datasets and all feature
classes will have the same reference system.
3.5.1 Creating Geodatabase in ArcGIS-ArcInfo
The proposed database model consists of two packages that may be
implemented for Dar-es-salaam Rapid Transit planning and operations.
However, in this research project, only one package, the Network package is
been implemented in a prototype; and only four out of six classes were
populated with data. A personal geodatabase was manually created in ArcGIS
as seen in figure 16. This involved creating the personal geodatabase itself,
personal geodatabase feature dataset, feature classes, and personal
geodatabase tables. Attributes and data types were set accordingly to
33
Figure 16: The creation of geodatabase in ArcGIS-ArcInfo
3.5.2 Creating Roads and Bus Route Feature Datasets
Road feature and bus route feature datasets of the Metropolitan
portion of Dar-es-salaam City were created through on-screen digitization of
scanned topographic map of 1994 at 1:20,000 scale. The scanned map was
made from aerial photograph of 1992. This dataset was a base road map for
geodatabase development. It is true that the spatial dataset is 14 years old,
meaning that, significant changes have occurred to some of the roads.
However, changes, can be in terms of road improvements and may not affect
its spatial location of the. The digitized road dataset comprised of all road
classes, namely; regional roads, main roads and street roads. All roads are
represented with one symbol; a distinction was not made with regard to their
classification. The following maps in figures 17 depict portion of the digitized
road feature dataset, and figure 18 illustrate portion of the bus routes feature
34
35
Figure 18: Part of bus routes feature dataset of Dar-es-Salaam city
3.5.3 Creating Transport Junctions Feature Class
Transport Junctions feature class were created from a base road
feature dataset. Transport junctions comprised of all intersections where
36
or street dead-ends. The map in figure 19 depicts some of the created
transport junctions.
Figure 19: Part of transport junctions within road feature dataset
3.5.4 Creating Network Datasets
Creating network dataset from existing road feature class was one of
the important procedures in order to have a network dataset required for
network analysis. Therefore, two network datasets (DarRoadNetwork and
37
(b). The DarRoadNetwork Dataset incorporates all feature classes in the
geodatabase (transport junctions, RoadFeature, and BusRoutes), while the
BusRoutes Network Dataset incorporates BusRoute and BusStopsTerminal
Feature Classes. Principally, Network Datasets comprises of junctions and
edges of the feature class formed at every junction of feature class and at the
vertex of polylines. The two figures below present the created Network
Datasets.
Figure 20: The Network dataset for DarRoads (a) and BusRoutes (b) respectively
3.5.5 Populating Geodatabase
In the course of creating of the physical geodatabase tables and
feature classes, not all attributes were populated with respective non-spatial
data, due to unavailability of such data. There are few data populated in the
geodatabase table for prototyping and implementing part of the created
database model.
38
3.5.6 Network Analysis Applications
Network analysis is a way to solve network problems such as finding
the best route, finding the closest facility, and identifying a service area
around a location, to mention just few. This section details two network
applications that have been done; namely, finding the closest facility (Closest
Bus Stop to hospitals), and identifying a service area around hospitals’
location.
The closest facility is the nearest service facility such as emergency
vehicle (i.e Ambulance or fire tender), and hospital facility, to mention but
few. In case of any incident (i.e car accident or fire) along the route, rescuers
will want to know the closest hospital or emergency vehicle to an incident
location. On the other hand, as far as public transport is concerned, people
using public transport and travelling to any point of interest may want to
know the closest bust stop to a network location or the best route to a
certain facility such as a hospital, a tourist location within the city, etc.
In order to carry out a simple network analysis on bus routes, a
hospital facility layer was created and used along with the Bus Stops Network
dataset to determine the closest Bus Stops to a designated network location.
The procedure used was to use a graphic pick tool on a network analysis
extension, which allows creation of the point of interest and the closest bus
stops were automatically determined based on the shortest distance from a
number of bus stops near a network location, in this case, hospital locations
were selected to be the points of interest.
Service area is an area around a facility that may be served by the
39
This area is a polygon buffer created after specifying a distance criteria in
which a certain community must be served using the network.
3.6 Results
The process of building transportation geodatabase for Dar-es-Salaam
has several results that are found in sections 3.5.1 through 3.5.6 in this report.
From conceptual design to physical design of the geodatabase, and its
prototype implementation gives some kind output of the project that fulfil
the goals and objectives of this research project.
3.6.1 GIS-T Database Model
One of the objectives in this project was to design a GIS-T database
for public transport route planning and operations for Dar-es-Salaam City. In
order to come up with a functional database, a database model has to be
developed. In the project, a GIS-T database model has been developed and
implemented in ArcGIS 9.3. Though, the model is customised based on the
UNETRANS data model, it gives an opportunity for starting-up a GIS
database for transportation application, with specific emphasis on route
planning and operations for Dar-es-Salaam city.
The developed geodatabase consists of feature classes and object
classes. The former are tables holding spatial data, and the latter are tables
mainly for non-spatial data. In implementation through prototyping, all tables
were created in ArcGIS and partially populated with data, specifically, spatial
data in feature classes. However, populating object class tables was not
40
for the future work to ensure the database is comprehensive and fully
populated with associated data, be it spatial or non-spatial.
The developed GIS-T database model is not comprehensive due to
several reasons among them are the lack of both spatial and non-spatial
data, which are vitally important in building-up geodatabases. In addition,
lack of specific and well properly organized transportation data for
Dar-es-Salaam City hinders the comprehensively of the desired GIS-T.
When reviewing the UNETRANS data model, it was found that
UNETRANS model was developed to fit the US and other developed world
transportation infrastructural environments, this is not the case for
Dar-es-Salaam, Tanzania or any other Sub-Saharan African counties where its
transportation infrastructures are not yet stable and not comparable to that
of developed world like USA. Therefore, the GIS-T database for
Dar-es-Salaam, though customised based on some part of the UNETRANS data
model reflects the real and actual environment of roads network in
Dar-es-Salaam city, and availability of both spatial and non-spatial data related to
transportation.
3.6.2 Network analysis on a network location
The developed geodabase may be used in a number of applications;
one of them is to carryout network analysis as already explained in section
3.5.6. In this specific project, two types of network analysis were conducted,
that is, a network analysis aimed at determining service area and closest bus
stop facilities to certain locations on a network datasets (Examples are major
hospitals in the city). In urban public transport, knowing the closest bus stop
41
appropriate bus routes plying to those areas. Figure 21 depict some bus
stops closest to hospitals.
Two examples of network analysis applications based on simulated
incidences are presented in figure 22, figure 23 and figure 24. Figure 22
shows the route to the closest hospital facility from a simulated accident
location. The example in figure 22 does not take into consideration
information about two ways or one way nor does it consider time. It would be
better to consider time if available, however, for this case, only distance is
used. Figures 23 & 24 depicts the service area for hospital facilities at 1000m
and 2000m rings respectively.
42
43
Figure 23: Illustrated service area at 1000m ring from Hospital facilities
From the above illustration (Figure 23), it has been established by means of
selection by location method (and verified by selection statistics function) in
ArcGIS, that there are 98 out of 282 bus stops that are completely within the
service area (Polygons) of 1000m from the hospital facilities. This account to
34.8% of all bus stops on a transport network and the hospitals are fairly
44
Figure 24: Depicted service area at 2000m overlapping rings from Hospital facilities
From the above illustration (Figure 24), it has been established by means of
selection by location method (and verified by selection statistics function) in
ArcGIS, that there are 200 out of 282 bus stops that are completely within the
service area (Polygons) of 2000m from the hospital facilities, which is 70.9%
45
3.7 Conclusions
A designed GIS-T that has been dealt with in this chapter is a good
milestone and basis for future roadmap towards a comprehensive GIS-T for
Dar-es-Salaam City. More work still need to be done with emphasis on the
availability of required data, format, and organisation of data in an
interoperable manner. This chapter has therefore, completed a major tasks
for this project as outlined in the research objectives. In the next chapter, the
main conclusions and verification of the set hypothesis and research
46
4. CONCLUSIONS AND RECOMMENDATIONS
This chapter presents the conclusions and recommendations for the
project as detailed in chapters one, two, and three. The conclusions drawn
here are a reflection of the author’s view based on the work done and perusal
of the literature review.
4.1 Main Conclusions
The main objectives of this project as listed in section 1.3 were to
review and make analysis of existing GIS-T data model, specifically, the
UNETRANS; to design a GIS-T database for public transport route planning
and operation for Dar-es-Salaam city, and to implement the design through
prototyping.
The conclusion about these is that all objectives have been achieved,
few-selected GIS-T data model (the focus was on UNETRANS) were reviewed
and studied in detail, and customised GIS-T data model made out of it for
Dar-es-Salaam city. The designed and implemented database is not full and
comprehensive system, but a mere prototype, which can be further,
improved, and expanded.
Due to unavailability of enough spatial and non-spatial data, there
exist in the prototype many null values in the geodatabase tables; all these
need to be collected, documented, and implemented. A network analysis on
selected application was done to find the routes to existing hospital facilities
47
4.2 Verification of research questions and hypothesis
This research argued for two research questions and three hypothesis
as stipulated in sections 1.4 and 1.5 respectively, and which are discussed in
subsequent sections.
4.2.1 Verification of research questions
The major question addressed in this project was to know which
package and classes in GIS-T data model can support public transport
planning and operations for Dar-es-Salaam. This question is answered after
review of the UNETRANS data model discussed in section 2.2.2. It is my
opinion that two packages are required to support GIS-T data model for
Dar-es-Salaam, the packages are the Network and Events package. The prototype
in the project is implemented using one package only (the Network Package).
The other two sub-questions are answered as follows based on a detailed
review of the UNETRANS data model
i. UNETRANS is a comprehensive GIS-T model that caters for both
uni-modal and multi-modal transport systems, therefore, its full
implementation for Dar-es-Salaam city will require an
infrastructural setting that resembles the classes and features in the
model itself. In fact, the data model as a whole is not suitable for
implementation unless customized and use part of the packages
and classes from UNETRANS to reflect the real situation of Dar
–es-Salaam infrastructure and availability of spatial data.
ii. UNETRANS data model was developed in the US, so it fully reflect
the US infrastructural settings, open access to spatial data as well
48
Dar-es-Salaam city, and probably, most of developing African
countries.
iii. With regard to whether the available spatial data that can fit into
the UNETRANS data model, it can be concluded that, UNETRANS
data model requires complete spatial data for its full
implementation, the data that may not available for Dar-es-Salaam.
Thus, the available geodata does not fit in the current UNETRANS
GIS-T data model.
4.2.2 Verification of research hypothesis
Three-research hypothesis argued in this project are justified for as follows:
i. The first hypothesis contended that it is possible to build an
effective transportation data model for Dar-es-Salaam based on
part of UNETRANS GIS-T data model. This hypothesis is
accepted. Through customization, part of the UNETRANS data
model components may be used to build an effective data
model for Dar-es-Salaam. The designed and implemented
prototype in this project is an example of the positivity of the
hypothesis.
ii. The second hypothesis claimed that: Building an effective GIS-T
data model requires comprehensive spatial data and technology.
This hypothesis is also accepted. An effective and exhaustive
GIS-T data model will require extensive spatial data, but also,
the right technologies in terms of hardware, software, and
humanware. However, this does not mean that a simple GIS-T