INTRODUCTION
Clean wool colour is an important economic trait in the sheep industry. Yellow colour wools are penalised be-cause it affects industrial versatility as far as dyeing is concerned. Clean wool colour expression is known to be genetically and, more importantly, environmentally af-fected, thus results from direct selection would cause vari-able responses. Direct selection against clean wool colour would be particularly difficult at low-challenging environ-mental conditions where the identification of resistant sheep could be biased with false-positive phenotypes, caus-ing susceptible sheep to be selected along with resistant sheep, making selection against colour ineffective.
To overcome environmental influences on the expres-sion of clean wool colour, the potential of molecular mark-ers was investigated in order to allow genotypic identifica-tion of resistant and susceptible sheep to wool yellowing.
The aim of this experiment was to investigate the ex-istence of a DNA marker for susceptibility to wool yel-lowing by screening groups of resistant and susceptible sheep by means of the differential display technique.
MATERIAL AND METHODS
Animals
Australian Merino sheep data were collected from a private property (Omarama Station, Omarama, Central Otago, New Zealand). Records on 668 offspring from 22 sires were collected over a 4-year period. In consecutive years the total numbers of sires and offspring were 6 and 137, 6 and 153, 5 and 186, and 9 and 192, respectively, with an average of 25 progeny per sire.
Midside skin and wool samples (accepted under ethi-cal approval) were taken at shearing time. Yellow predictive colour (YPC) score was determined according to Wilkinson
(1981). Greasy fleece weight (GFW), clean fleece weight (CFW), scouring yield percentage (Yield), and mean fibre diameter (MFD) were also recorded at shearing.
Statistical analysis
Data were analysed using the general linear models (GLM) of SAS package V6 (SAS, 1990) to determine which were the significant fixed effects. Year of birth and sex were used as fixed effects and sire was included as a ran-dom effect.
The model fitted to each variable was:
Yijkl = µ + yobi+ xj+ sk + eijkl
where Yijkl= record of the lth individual; µ = population mean; yobi= year of birth; xj= sex; sk= sire, and eijkl= error of the lth individual.
Heritability of YPC was estimated from variance com-ponents calculated using restricted maximum likelihood (REML) procedures with the average information restricted maximum likelihood (AIREML) statistical package (John-son and Thomp(John-son, 1995) being used for the analyses.
Selection of individuals
The strategy used to select the animals for the differ-ential display (DD) experiment was the same as that used by Lander and Botstein (1989), which was based on select-ing individuals from the two YPC score extremes within the population. Ten unrelated sheep were selected based on YPC score’s breeding values (BV) out of the 668 Merino sheep. The resistant (lowest YPC score’s BVs) and susceptible (highest YPC score’s BVs) groups contained each 5 sheep. The YPC score’s breeding values corrected for the significant (P < 0.01) fixed effects of sex and year of birth were calculated using the following formulae:
A putative resistant DNA marker for wool yellowing susceptibility in sheep
M.V. Benavides, S. Damak and A.P. Maher
Abstract
An Australian Merino flock was screened for low (resistant) and high (susceptible) yellow predictive colour (YPC) breeding values in order to compare extreme individuals using the differential display of mRNA technique. One differentially expressed cDNA band was visualised only in the resistant group. This band showed no identity with the DNA sequences of public databases; however, they showed short homologies with three database sequences related to transmembrane signalling functions. The use of these candidate genes as DNA markers needs to be confirmed against sheep with a wide range of susceptibility to wool yellowing to verify the results.
Wool Science Department, Lincoln University, Canterbury, New Zealand.
BVijk = (YPCijk - YPCcij) * h2
where BVijk = the breeding value of the sheepk of the sexj in the yeari; YPCijk = YPC score of the sheepk of the sexj in the yeari; YPCcij = YPC correction for sexj and yeari,, and h2 =
heritability of YPC for the current flock (calculated as h2 =
0.25 ± 0.13).
where LSMij = least square mean of YPC for the sexj in the yeari; n = total number of animals in the flock over years and sexes.
Averages of both groups, low YPC score’s BV (resis-tant) and high YPC score’s BV (susceptible) are presented in Table I.
The animals had midside wool samples taken at hogget age and then again at adult age, to double check their YPC scores. Selection of the animals for DD analyses was based on adult YPC scores. Skin samples were also taken from the midside patch during adult wool sampling.
TECHNIQUES
RNA extraction
Whole skin samples were homogenised with a Poly-tron homogeniser (Kinematica GmbH, Luzern, Switzer-land) at speed 7 and RNA was extracted with TRIzol (Life Technologies, Auckland) according to the manufacturer’s instructions. RNA pellets were dissolved in 20 µl DEPC-treated water and the RNA concentration was measured at 260 nm (A260 nm) in a spectrophotometer. RNA samples
were run in 0.8% agarose gel in 1X TBE buffer to check whether RNA was degraded or intact.
RNA samples were DNA decontaminated by diges-tion at 37oC for 30 min with 10 U DNase I RNase-free
(Boehringer Mannheim), 1X DNase I buffer and 20 U RNase inhibitor (Boehringer Mannheim), followed by phenol/chloroform extraction, and ethanol precipitation. RNA concentrations were measured at A260 nm and RNA
integrity was checked again on 0.8% agarose gel. DNA-free RNA (0.2 µg) was transcribed to comple-mentary DNA (cDNA) in a total reaction volume of 20 µl, with 20 µM 4dNTP (dATP, dGTP, dTTP, dCTP), 1X rever-se transcriptarever-se buffer, 10 mM DTT, and 1 µM 14-mer oligo (dT) primer (OP) (Table II). The RNA reactions were incubated at 65oC for 5 min to allow RNA denaturing,
fol-lowed by a second incubation at 37oC for 10 min to allow
primer annealing. Ten units of reverse transcriptase (RT) from Moloney murine leukemia virus (MoMuLV; Life Technologies, Auckland) were added and the reaction was incubated at 37oC for 50 min, for RNA reverse
transcrip-tion into cDNA, followed by a final incubatranscrip-tion at 95oC for
5 min to inactivate the enzyme. The negative controls were
the reaction without reverse transcriptase and the reac-tion without RNA.
PCR amplification of cDNA was conducted using 2 µl of the RT product in a 20-µl reaction mixture con-taining 2 µM 4dNTP (dATP, dGTP, dTTP, dCTP), 1X PCR buffer, 0.2 µM 10-mer arbitrary primer (AP) (Table II), 1 µM14-mer oligo (dT) primer (OP) (Table II), 0.1 µCi
α32PdCTP, and 1 U Taq DNA polymerase (Boehringer
Mannheim). Forty microlliters of mineral oil was placed on the top of the reaction to avoid evaporation.
Four different oligo (dT) primers (Table II) were used in the current experiment, generating 4 different species of mRNA in the RT step. PCR amplification was performed using either an arbitrary primer and the oligo (dT) primer used for RT (OP-AP) or two different arbitrary primers (AP-AP) (Table II). The use of AP and OP primers in cDNA amplification has been described in Liang and Pardee (1992).
The PCR conditions were: 40 cycles of denatur-ation at 94oC for 30 s, annealing of primers at 40oC for 2
min, extension at 72oC for 30 s followed by one final
extension cycle at 72oC for 5 min (Liang and Pardee,
1994).
PCR products (3.2 µl + 2 µl formamide loading dye) were run in a 6% polyacrylamide denaturing sequencing gel containing 7 M urea in 1X TBE buffer at 2000 V for 2.5 h. The gel was transferred to Whatmann No. 3 filter paper, vacuum dried at 80oC for 1 h and exposed to X-ray
film (Kodak) for 2 days. The filter paper was stapled to YPCcij = LSMij - ( ∑ YPCijk)
n
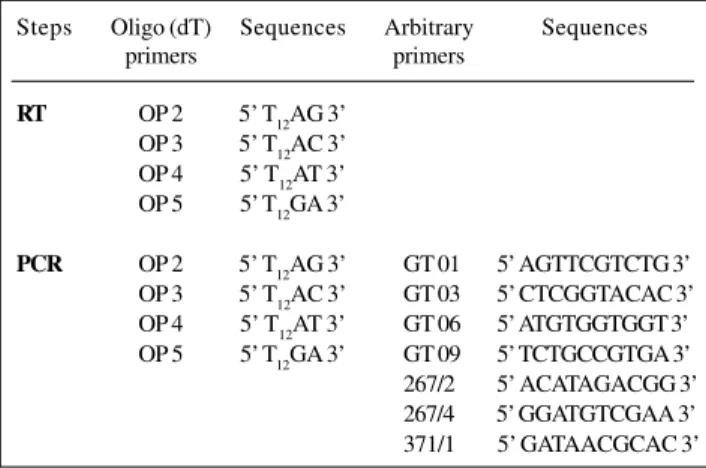
Table II - Oligo (dT) primer (OP) sequence used in the reverse transcriptase (RT) step and oligo (dT) and arbitrary primer
sequences used in the PCR step.
Steps Oligo (dT) Sequences Arbitrary Sequences
primers primers
RT OP 2 5’ T12AG 3’
OP 3 5’ T12AC 3’
OP 4 5’ T12AT 3’
OP 5 5’ T12GA 3’
PCR OP 2 5’ T12AG 3’ GT 01 5’ AGTTCGTCTG 3’
OP 3 5’ T12AC 3’ GT 03 5’ CTCGGTACAC 3’
OP 4 5’ T12AT 3’ GT 06 5’ ATGTGGTGGT 3’
OP 5 5’ T12GA 3’ GT 09 5’ TCTGCCGTGA 3’
the X-ray film and hole punched to allow cDNA recovery from the polyacrylamide gel after candidate genes had been identified in the autoradiograph.
The molecular weight marker used for polyacryla-mide gels was the promoter region of the rabbit uteroglo-bin gene inserted in the EcoRI site of pBluescript KS(+) (DeMayo et al., 1991) digested with BanI (Boehringer Mannheim) and end labelled with α32P-dCTP using the
Klenow fragment of DNA polymerase I (Amersham, Buckinghamshire, UK). The digestion generated DNA frag-ments of 1736 bp, 1231 bp, 1097 bp, 834 bp, 460 bp, 426 bp, 218 bp, 142 bp and 76 bp.
The differentially expressed cDNA bands, hereaf-ter hereaf-termed cDNA, were cut from the polyacrylamide gel with a scalpel blade. The cDNA was eluted from the gel in 100 µl TE buffer, pH 7.6, at 37oC for 12 h, followed by
incubation at 100oC for 15 min. To the TE buffer were
added 3 M sodium acetate to a final concentration of 0.3 M, 10 mg/ml glycogen to a final concentration of 0.5 µg, and 400 µl 100% ethanol to precipitate the DNA. The samples were incubated at -70oC for 30 min and then
cen-trifuged at 14,000 rpm for 10 min, after which the DNA pellets were washed with 85% ethanol and dissolved in 20 µl of sterile water.
PCR amplification of the recovered cDNA band was done in a 40-µl reaction mixture using the same PCR con-ditions and final reaction concentrations as previously described, except for the absence of the radioisotope and the concentration of the dNTPs being 20 µM. These bands were subcloned in the pCR II vector (TA Cloning kit, Invitrogen, San Diego, CA). Transformation was done us-ing E. coli DH5α competent cells using blue and white selection. A modified alkaline lysis/PEG precipitation pro-tocol (PRISM Ready Reaction DyeDeoxy Terminator Cycle Sequencing Kit Protocol, Perkin-Elmer Corporation) was used. DNA samples (200 ng/µl each) were sequenced in the automated sequencing facility of Auckland Univer-sity using M13 and reverse M13 primers.
The forward and reverse directions of the cloned se-quences were checked for homology using the DNAMAN for Windows programme Version 2.5 (Lynnon BioSoft, Quebec). The cloned cDNA sequences were then com-pared with DNA sequences from international databases in order to search for homology with known DNA se-quences by using the BLASTN programme (Altschul et al., 1990).
Those DNA sequences identified by the BLASTN GenBank and TIGR searches as having short homologies with the cloned sequences were searched in the ENTREZ Nucleotide query browser provided by the National Cen-ter for Biotechnology Information [http://www3.ncbi. nlm.nih.gov/htbin-post/Entrez/] in order to identify their protein coding sequences (CDS).
The DNA sequences with CDS present within the re-gion of homology between the cloned sequences and the DNA sequences were then searched in the PC/GENE
pro-gram Release 6.8 under the PROSITE option (Bairoch, 1993) to find the likely function of the protein.
RESULTS
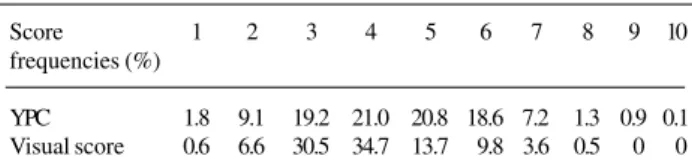
The Merino flock studied presented a wide range of YPC scores, from 1 to 10, and averaged 4.47 ± 1.38. Twenty-eight percent of the animals showed YPC scores between 6 and 10 (Table III). Sheep with YPC scores of 6 and above were considered to be highly susceptible to wool yellowing. The genetic and environmental variances of YPC scores observed for the Merino flock were 0.50 and 1.91 (not tabulated), respectively.
The two groups of sheep selected because of their extreme breeding values for YPC scores did not differ sig-nificantly (P ≥ 0.05) for GFW, CFW, Yield, or MFD. The only apparent significant difference (P < 0.001) was for YPC and visual wool colour assessment. The analysis of variance of YPC scores showed that the score averages significantly differed between years of birth (P < 0.001) and sexes (P < 0.01), with females presenting higher YPC scores than males.
The heritability of YPC, as estimated by the sire model, was found to be 0.25 ± 0.13, and was used to cal-culate YPC breeding values from which the resistant and the susceptible groups of sheep were selected to partici-pate in the current experiment.
The 4 mRNA species generated by reverse tran-scriptase using 4 different OP primers (Table II) were used in 53 PCR rounds with different OP-AP primer and AP-AP primer combinations. An average of 52 cDNA frag-ments with sizes varying between 1700 bp and 30 bp were observed per gel. Fifty percent of the bands amplified were fragments shorter than 600 bp. Only 8.6% of the cases showed amplified bands with sizes greater than 1500 bp.
The majority of the differential display results (92.5%) showed a similar banding pattern between the lanes, i.e., between individuals, with only 7.5% of the dif-ferential displays showing a wide variability of band pat-terns between lanes. This pattern occurred both when OP primers and when AP primers were used as 3’-end primers at the PCR step, being 10.5% of the OP-AP combinations and 5.88% of the AP-AP combinations.
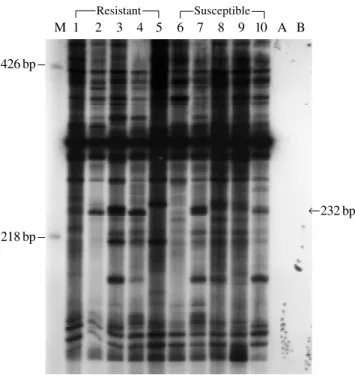
A differentially displayed band was amplified with the primer combinations: OP3-GT09, a 232-bp long cDNA band expressed in four of the five resistant individuals (hereafter termed cDNA#R; Figure 1).
Table III - Yellow predictive colour (YPC) and visual score frequencies for Merinos.
Score 1 2 3 4 5 6 7 8 9 10
frequencies (%)
mology with some database sequences. Three database se-quences from the GenBank database were found to have short homology with the cDNA#R sequence.Two database sequences belonged to the same family: metalloprotease-like, disintegrin-like proteins IVb and IVc. The PROSITE analysis of these database sequences homologous with cDNA#R did not detect any protein sites or signatures within the homologous region. No matches were found for cDNA#R in the TIGR database.
DISCUSSION
The DD technique was used in this experiment since it allows the identification of non-polymorphic genes through side-by-side comparisons between groups of ani-mals having the same phenotypic characteristics, as well as for the identification of polymorphic genes.
Despite most of the reported differential display ex-periments having targeted two populations of cultured cells (Liang and Pardee, 1992; Liang et al., 992, 1993; Sager et al., 1993; Zimmermann and Schultz, 1994; Donohue et al., 1995; Wang and Feuerstein, 1995), tissue compari-sons involving multicellular structures have been published with positive results (Utans et al., 1994).
The strategy used to maximise the chances of ob-serving group-related differences was to compare groups of animals with extremely low- and high-YPC score breed-ing values (resistant vs. susceptible). This approach has been described by Tanksley (1993) as the “distributional extremes method”, which assumes that individuals in the extreme tails of the Gaussian distribution (i.e., the lowest and the highest breeding values for a particular trait) are more likely to express differences in genotypes.
The use of sheep with extremes of YPC score breed-ing values also made it possible to reduce the number of animals to be screened in the current study. In this par-ticular case the use of sheep with extreme YPC scores also avoided the inclusion of animals with intermediate YPC values that could have resulted in difficulties in the interpretation of the results. The low number of sheep used in the current experiment was a consequence of the high cost of screening large populations for genetic markers.
The cDNA#R cloned sequence found in this study showed to have short homology, but no identity, with 3 database sequences from the GenBank. The lack of iden-tity between the database sequences and the cDNAs cloned here means that these cDNAs were unknown sequences. Nonetheless, the search in the GenBank database was im-portant because it gave some indication of the possible biological function of the cloned cDNAs.
Interestingly, a group of proteins with similar physi-ological functions was observed amongst the sequences with short homologies found in GenBank searches. The three database DNA sequences found for cDNA#R: mast cell function associated antigen (MAFA) (Guthmann et al., 1995), metalloprotease-like disintegrin-like IVb (Perry et Figure 1 - Differential display of mRNA using primers OP3 and GT9. Lane
M: Molecular weight marker; lanes 1-5, resistant sheep; lanes 6-10, suscep-tible sheep; lane A - control (no RNA) and lane B - control (no reverse transcriptase). The 232-bp band is present only in the resistant group. The arrow shows the differentially displayed band corresponding to cDNA#R.
Sequences
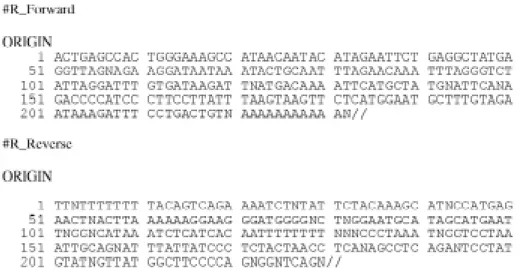
The forward and reverse sequences of cDNA#R are presented in Figure 2.The forward sequence was sequenced using M13 primer and the reverse sequence with the M13 reverse primer.
Open reading frames (ORF) were also checked in the cloned sequences (Table IV). cDNA#R presented the poly (T) tail at the 5’ end of the reverse strand. Poly (A) tails are positioned at the 3’ end of the RNA sequence. This indicates that the “minus” strand (the reverse comple-mentary strand) of the reverse sequence is the sense strand, and the strand in which to look for ORFs. Five pos-sible ORF may have occurred in cDNA#R.
Sequence homology search
The forward sequence for cDNA#R was analysed in the BLASTN GenBank and TIGR programmes because of its lower occurrence of ambiguous nucleotides compared with the reverse sequence. No attempts were made to re-place the “N” nucleotides in the cloned sequences by any nucleotide to match its complementary sequence before being sent to the BLASTN and TIGR searches.
BLASTN and TIGR searches revealed that cDNA#R did not have identity with known DNA sequences in the da-tabases, although the cloned sequences did show some ho-426 bp
218 bp
232 bp M 1 2 3 4 5 6 7 8 9 10 A B
Resistant Susceptible
al., 1995) and metalloprotease-like disintegrin-like IVc (Perry et al., 1995), have been reported to act in trans-membrane signalling processes.
A possible link between proteins related to trans-membrane functions and wool yellowing would be through the high potassium content in the sudoriparous glands secretion (suint) which has a strong positive phe-notypic and genetic correlations with wool yellowing (Aitken et al., 1994; Benavides, 1997). Suint covers the wool follicle and if it has a high pH it may lead to an increase of wool yellowing (Acharya and Singh, 1976). A possible mechanism where K can be at higher levels in the sudoriparous gland cells is through the sodium-pump system, which actively transports Na+ and K+ ions across
the cellular membrane through the action of the Na+-K+
-ATPase enzyme (Sato and Dobson, 1970). Despite Na+
-K+-ATP being the main K+ transport mechanism, it is not
the only known system since H+-K+-ATPase also controls
the exchange of K+ from the plasma to the cells (Sachs
et al., 1992). However, if there was a difference in Na+
-K+-ATPase between resistant and susceptible sheep it
would most likely have been due to a difference in the
activity of this essential enzyme. In this case, if Na+-K+
-ATP was the protein responsible for the higher K+
con-tent in the sweat glands in susceptible sheep a cDNA band would be seen simultaneously in both susceptibility groups, since it is a vital enzyme, but with different band intensity which could indicate a difference in gene ex-pression between the two groups. At the time of this study it was not possible to draw any specific relationship be-tween transmembranal functions or activity and wool yel-lowing susceptibility and the database sequences found to have homology with cDNA#R in this experiment.
One way of better understanding the function of the cloned sequences would be to clone their corresponding full length cDNA. Amplification of partial sequences is a characteristic of the differential display technique because it uses oligo d(T) primers and amplification will not oc-cur unless the arbitrary primer is situated within 2 to 3 kb of the oligo d(T) primer (Liang and Pardee, 1992). The fragments amplified in this experiment were relatively short, 1700 bp being the biggest fragment size, but 50% of the bands were ≤ 600 bp. The cloning of full length sequences would be necessary to confirm their identity with any known sequence.
Further confirmation of the differentially displayed cDNA#R is essential to allow confidence in the use of this marker in order to identify sheep according to their degree of susceptibility. However, cDNA#R would not be expected to identify 100% of resistant or susceptible sheep since this candidate gene was present in only four out of the five resistant sheep studied. This means that in prac-tice not all resistant sheep will have been identified by the use of this probe. Wool yellowing is a continuous trait, therefore it might be affected by many genes; so, the fail-ure of a single candidate gene for susceptibility to wool yellowing to explain all the genetic variance for this trait was an expected result.
Figure 2 - Forward and reverse sequences of cDNA#R.
Table IV - Regions where possible open reading frames (ORF) in cDNA#R occur (forward: 1 to 232 bp).The table also shows the strand (plus or minus), number of amino acids present in each ORF and their respective
position in the strand of the cDNA#R sequences. Strand Frame Number of Position Start Stop
amino acids codon codon
Minus 2 19 116-175 √ √
“ 3 15 186-232 √
“ 1 11 1-36 √
“ 2 8 191-217 √ √
CONCLUSIONS
One differentially expressed band was found in the group resistant to wool yellowing with no identity with DNA sequences available at GenBank and TIGR databases. The differentially displayed sequence showed short homologies that might point at proteins with transmembrane signalling functions in the wool yellowing mechanism.
ACKNOWLEDGMENTS
We acknowledge the financial support of CNPq (Conselho Nacional de Desenvolvimento Científico e Tecnológico) and the help from Dr. José Carlos Ferrugem Moraes (Embrapa-CPPSUL) in the discussion of the results. We also would like to thank Messrs. Ross Wilson, Chris Logan from the Animal and Veterinary Sci-ences Group and Fraser Aitken, the laboratory staff of the Wool Measurement Service at Lincoln University, for the analysis and collection of the data, in particular Mrs. Jenny Nicol and Jill Sutton, and the laboratory staff of the Animal & Veterinary Sciences Group, in particular Ms. Tania Gourley.
RESUMO
Ovinos resistentes e suscetíveis para predição da cor ama-rela na lã foram amostrados de um rebanho da raça Merino Australiano com o objetivo de comparar diferenças em cDNAs através da técnica de exposição diferencial de mRNA (differen-tial display of mRNA). Uma banda de cDNA foi expressa somente no grupo dos animais resistentes. Não houve identidade desta banda com seqüências do banco de dados do GenBank ou TIGR, no entanto a banda chamada de cDNA#R mostrou homologias curtas com três seqüências que codificam proteínas envolvidas em funções de membrana. O uso deste gene candidato como marcador genético de animais resistentes ao amarelamento necessita ser avaliado em rebanhos mais numerosos para con-firmar os resultados.
REFERENCES
Acharya, R.M. and Singh, M. (1976). Canary coloration of wools: Breeds differences and their possible causes. Aust. J. Agric. Res.27: 687-690. Aitken, F.J., Cottle, D.J., Reid, T.C. and Wilkinson, B.R. (1994). Mineral and amino acid composition of wool from New Zealand Merino sheep differing in susceptibility to yellowing. Aust. J. Agric. Res.45: 391-401.
Altschul, S.F., Gish, W., Miller, W., Myers, E.W. and Lipman, D.J. (1990). Basic local alignment search tool. J. Mol. Biol. 215: 403-410. Bairoch, A. (1993). The PROSITE dictionary of sites and patterns in
pro-teins, its current status. Nucleic Acids Res.21: 3097-3103.
Benavides, M.V. (1997). Investigation of indirect selection criteria and DNA markers for clean wool colour in sheep. PhD thesis, Lincoln Univer-sity, Canterbury, New Zealand.
DeMayo, F.J., Finegold, M.J., Hansen, T.N., Stanley, L.A., Smith, B. and
Bullock, D.W. (1991). Expression of SV40 T antigen under control of rabbit uteroglobin promoter in transgenic mice. Am. J. Physiol.261: L70-L76.
Donohue, P.J., Alberts, G.F., Guo, Y. and Winkles, J.A. (1995). Identifica-tion by targeted differential display of an immediate early gene encod-ing a putative serine/threonine kinase. J. Biol. Chem.270: 10351-10357.
Guthmann, M.D., Tal, M. and Pecht, I. (1995). A secretion inhibitory signal transduction molecule on mast cells is another C-type lectin. Proc. Natl. Acad. Sci. USA 92: 9397-9401.
Johnson, D.L. and Thompson, R. (1995). Restricted maximum likelihood estimation of variance components for univariate animal models us-ing sparse matrix techniques and average information. J. Dairy Sci. 78: 449-456.
Lander, E.S. and Botstein, D. (1989). Mapping Mendelian factors underly-ing quantitative traits usunderly-ing RFLP linkage maps. Genetics121: 185-199. Liang, P. and Pardee, A.B. (1992). Differential display of eukaryotic mes-senger RNA by means of the polymerase chain reaction. Science257: 967-971.
Liang, P. and Pardee, A.B. (1994). Differential display of mRNA by PCR. In: Current Protocols in Molecular Biology (Ausubel, F.M., Brent, R., Kingston, R.E., Moore, D.D., Seidman, J.G., Smith, J.A. and Struhl, K., eds.). Greene Publishing Associated, Toronto.
Liang, P., Averboukh, L., Keyomarsi, K., Sager, R. and Pardee, A.B. (1992). Differential display and cloning of messenger RNAs from human breast cancer versus mammary epithelial cells. Cancer Res.52: 6966-6968. Liang, P., Averboukh, L. and Pardee, A.B. (1993). Distribution and cloning
of eukaryotic mRNAs by means of differential display: refinements and optimization. Nucleic Acids Res.21: 3269-3275.
Newton, C.R. and Graham, A. (1994). PCR. BIOS Scientific Publishers Lim-ited, Oxford.
Perry, A.C.F., Jones, R. and Hall, L. (1995). Analysis of transcripts encod-ing novel members of the mammalian metalloprotease-like, disintegrin-like, cysteine-rich (MDC) protein family and their expression in repro-ductive and non-reprorepro-ductive monkey tissues. Biochem. J.312: 239-244.
Sachs, G., Besaneon, M., Shin, J.M., Mercier, F., Munson, K. and Hersey, S. (1992). Structural aspects of the gastric H, K ATPase. J. Bioenerg. Biomembr.24: 301-308.
Sager, R., Anisowicz, A., Neveu, M., Liang, P. and Sotiropoulou, G. (1993). Identification by differential display of alpha 6 integrin as a candidate tumor suppressor gene. FASEB J.7: 964-970.
SAS/STAT (1990). User’s Guide Version 6 (Fourth). SAS Institute Inc., Cary, NC.
Sato, K. and Dobson, R.L. (1970). Enzymatic basis for the active transport of sodium in the duct and secretory portion of the eccrine sweat gland.
J. Invest. Dermat.55: 53-56.
Tanksley, S.D. (1993). Mapping polygenes. Annu. Rev. Genet.27: 205-233. Utans, U., Liang, P., Wyner, L.R., Karnovsky, M.J. and Russell, M.E. (1994). Chronic cardiac rejection: Identification of five upregulated genes in transplanted hearts by differential mRNA display. Proc. Natl. Acad. Sci. USA91: 6463-6467.
Wang, X. and Feuerstein, G.Z. (1995). Direct sequencing of DNA isolated from mRNA differential display. BioTechniques18: 448-453. Wilkinson, B.R. (1981). Studies on fleece yellowing. Part 1: Prediction of
susceptibility to yellow discolouration in greasy fleeces. Wool Technol. Sheep Breed. 29: 169-174.
Zimmermann, J.W. and Schultz, R.M. (1994). Analysis of gene expres-sion in the preimplantation mouse embryo: Use of mRNA differential display. Proc. Natl. Acad. Sci USA91: 5456-5460.