On the constrained economic design
of control charts: a literature review
Giovanni Celano*
[email protected], University of Catania, Italy
Abstract
The economic design is an appealing approach to settle the design parameters of a control chart. Unfortunately, the economic models to design control charts have been scarcely implemented by quality practitioners due to the simplifying assumptions when representing the multifaceted complexity and constraints present within manufacturing and transactional environments. Although there has been an increasing scepticism about the economic models usefulness in practice, some recent studies proposed in literature face the problem of the control charts economic design from a new point of view: the objective is to achieve a well balanced trade-off between the operational and the statistical aspects. Under this perspective, the economic design problem can be intended in a broader sense as the constrained design of a SPC inspection procedure. This paper presents a discussion of some recent trends in the economic design stream of research and outlines the importance of considering the constraints related to SPC resources availability and modelling the occurrence of random shifts.
Keywords
Control chart. Economic design. Resource availability. Random shift.
1. Introduction
Control charts are widely adopted for monitoring the quality of processes both in the industrial and service sectors. To implement a control chart, its design parameters should be selected. For the well known Fixed Parameters (FP ) Shewhart chart, the sample size n, sampling interval h and width of control limits L need to be chosen; the time weighted EWMA and CUSUM charts require some further parameters to be selected in order to account for the past process history, (MONTGOMERY, 2008). More advanced control chart schemes call for the selection of adaptive sample sizes (n1, n2) and/or sampling intervals (h1, h2) and/or width of control limits (k1, k2) couples, for further details see Costa (1994, 1997, 1999).
The economic design of a control chart allows the chart design parameters to be selected by achieving a cost minimization objective. Several papers have been proposed in SPC literature about this cost optimization problem. When the charts should be implemented on long run processes,
researchers usually refer to and adapt their chart design problem to the models proposed by Duncan (1956) and Lorenzen and Vance (1986); another stream of research considers Taguchi’s loss function, (TAGUCHI; ELSAYED; HSIANG, 1989; SPIRING; YEUNG, 1998) as the reference cost model. When a Critical to Quality (CTQ) characteristic should be monitored in short production runs, the economic model proposed by Ladany (1973) can be adopted. The economic design of the EWMA and CUSUM chart is reported in Montgomery et al. (1995) and Chiu (1974), respectively: it can be achieved by implementing one among the models cited above. Exhaustive information about the economic design of adaptive control charts monitoring the process mean can be found in Prabhu, Montgomery and Runger (1997) and De Magalhães et al. (2002).
Although designing chart parameters to get a minimum quality control cost is potentially appealing, it is worth noting that Quality Assurance practitioners seldom implement the economic
models to design control charts within their organization processes. This is often due to the fact that these models focus too much on the statistical issue of the problem rather than taking into account the actual process configuration, which is mainly an operational issue. Thus, the constrained economic design of a control chart has been considered in literature as that allowing for the minimum expected quality control cost and respecting a statistical constraint which fixes the expected number of samples to be taken between two successive false alarms, i.e. a lower bound for the in-control Average Run Length ARL0.
It would be recognized that the chart design within a stage of the process should take into account the manufacturing process planning and workstation configuration at that stage, i.e. two issues which can strongly constrain the problem: for example, when designing a chart the batch dimension, the rate of production and the cycle times are important measures to be accounted for. Furthermore, in small enterprises technological or labour resource constraints can often require a worker within a workstation to perform consecutively both the working and inspection tasks on a batch of manufactured parts. Or, similarly, an automated inspection machine has a limited time window to perform a local on-line control on a quality characteristic immediately after that some manufacturing activities have been completed on a set of parts.
All these operational aspects should be carefully considered when the chart design procedures should be started. Thus, the design of a control chart locally monitoring a quality characteristic must be intended in a broader sense as the design of a local inspection procedure constrained by a set of resource/environmental process factors characterizing the workstation configuration.
Another fundamental aspect influencing the control chart design problem concerns the size of the shift expected to occur during the production run: usually, control charts are designed to quickly capture the occurrence of a specific out-of-control condition. In the economic design of a control chart this leads to fix a deterministic value for the shift δ of the in-control process mean µ0 to the out-of-control condition µ1. However, selecting the correct value for the shift size could be a difficult decision to be tackled by the quality practitioner, due to the lack of former process knowledge. Furthermore, in a real manufacturing environment a varying magnitude of the next shift can happen even if causes that affect quality of the characteristic of interest are known due to former process
knowledge; thus, when several shift magnitudes are expected to occur, fixing a specific value of the shift and then designing economically the chart with respect to this value could lead quality practitioners to adopt not optimal chart design parameters and to a misspecification in the quality control cost estimation.
This paper discusses all these aspects and tackles the design of a control chart as that of an SPC inspection procedure subject to constraints related to SPC resources availability and process configuration and in presence of a random shift size. A few researches have been recently published in literature which deal with these issues: in this paper, they are reviewed and different process configurations and random shift modelling approaches are discussed. Some recommendations about future research ideas are provided too.
The remainder of the paper is organized as follows: in Section 2 the adopted economic models and the related optimization problem are presented; in Section 3 the operational aspects concerning the process configuration and the SPC resource availability are discussed; the effect of random shift size on design parameters selection is presented in Section 4; a discussion of the possible research directions is reported in Section 5; conclusions complete the paper.
2. The economic models
Let us consider a stage of a manufacturing process where a normally distributed Critical to Quality (CTQ) characteristic X~N(µ0,σ0) should be monitored on-line by means of an SPC inspection procedure to be economically designed. Without loss of generality, let us denote as W the random size of the shift in the process mean or dispersion; the distribution of the random shift size is f(W) and the corresponding parameters are µW and σW. An observed value of the random shift is denoted as
w. Thus, if the SPC inspection procedure is aimed at controlling the CTQ parameter mean, then W = δ, (µ1 = µ0 + δσ0), and f(δ), µδ and σδ should be estimated; otherwise, for an inspection monitoring the CTQ characteristic spread, W = τ, (σ1 = τσ0), and
f(τ), µτ and στ should be estimated.
selected chart design parameters. Let us denote as Ω a feasible set of these design parameters. For example, for the EWMA chart Ω = {L, λ, n, h}, where λ is the smoothing parameter. Similarly, for the Shewhart chart it holds λ = 1, then Ω = {L, n, h}.
The mathematical optimization problem related to the selection of the economic design Ω* of the
SPC inspection procedure can be formalized as a non-linear constrained optimization problem:
( )
( )
( )
( )
Ω Ω = Ω Ω + Ω = Ω *
INSP LR Q INSP
min C min C C C (1)
subject to a set of constraints including the in-control statistical properties of the chart, the manufacturing process configuration and the available resource capacity to perform SPC activities. The expected quality control cost CQ(Ω) is determined for the selected control chart; depending on the chosen economic model, CQ(Ω) can include different costs. For the sake of brevity, in what follows reference will be done only to models developed for infinite production runs. The adopted notation is reported in Chart 1.
When the economic model from Lorenzen and Vance (1986) is adopted, the process production horizon is assumed to be divided into cycles made up of the following phases: production, monitoring and adjustment following the occurrence of a special cause. The process failure mechanism is modelled through an exponential random shock model with failure rate θ [failures/hour]. For a
given value w of the shift size, the conditional expected cost Cchart(Ω|w) associated to the control chart implementation can be calculated as the ratio of the quality cost C(Ω|w) incurred during a cycle over the conditional expected length T(Ω|w) of the cycle:
(
) (
(
)
)
chart
C w
C w
T w
Ω
Ω =
Ω (2)
The conditional expected cost per cycle C(Ω|w) includes the costs due to producing nonconformities with the process in the “in-control” and “out-of-control” conditions, here denoted as Ca and
Cb(Ω|w), respectively; the conditional expected cost Cc(Ω|w) associated to false alarms; the cost
Cd corresponding to the detection and removal of a special cause; the conditional expected cost
Ce(Ω|w) due to sampling during the cycle:
(
)
(
)
(
)
(
)
( )
( )
0
1 1 1 2 2
0 1 2
1 1 2 2 1
a b c d e
w d
INSP
w INSP
C w C C w C w C C w
C n s Y
C w h ARL d T d T C
r ARL
a a n n
ARL d T d T
h r
Ω = + Ω + Ω + + Ω =
⋅
= + ⋅ − ζ + + ⋅ + ⋅ + + +
θ
+ ⋅
+ θ+ + + ⋅ + ⋅
(3)
where rINSP[parts/hour] is the inspection rate. C0 and
C1(w) are the costs per hour of operation due to producing non-conforming units while the process operates in the in-control and out-of-control states. These costs can be computed by taking into account the hourly rate of production rPR [parts/
Chart 1. Notation.
n sample size a2 variable sampling cost
L width of control limits cLR cost of labour resource per time unit h sampling interval cNC cost of producing a non conforming part LR fraction of SPC labour resource rINSP rate of inspection
δ random shift in the process mean from µ0 to µ1 = µ0 + δσ0
rPR rate of production
µδ mean of the random shift in the process mean C0 cost per unit time of production when the process is in-control
τ random shift in the process dispersion from σ0 to
σ1 = τσ0
C1(w) cost per unit time of production when the process is out-of-control
µτ mean of the random shift in the process dispersion d1
indicator variable (1 if production continues during searches, 0 otherwise)
θ number of occurrences per hour of an assignable cause (failure rate) d2 indicator variable (1 if production continues during repair, 0 otherwise)
Cp process capability index Cd cost for locating and repairing an assignable cause p0 in-control fraction non conforming Y cost per false alarm
p1(w) out-of-control fraction non conforming T0 expected search time associated with a false alarm ARL0 in-control average run length T1 expected search time to discover an assignable cause ARLw out-of-control average run length T2 expected time to repair the process
hour], the in-control (out-of-control) fraction non conforming p0 (p1(w)) and the unit cost of producing a non-conforming part cNC [$/part]:
( )
( )
0 PR 0 NC 1 PR 1 NC
C =r ⋅p c⋅ ; C w =r ⋅p w c⋅ (4) The in-control and out-of-control fractions non-conforming p0 and p1(w) can be easily determined once the process capability ratio index
Cp of the controlled quality characteristic and the deviation ∆ of the in-control population mean µ0 from the target T value are known. For a control chart monitoring the process mean, it holds:
( )
(
)
(
)
0
1
1 3 3
3 1 3
= + Φ − − ∆ − Φ − ∆
δ = Φ − − ∆ − δ + − Φ − ∆ − δ
p p
p p
p C C ;
p .C .C (5)
For a control chart monitoring the process dispersion, it holds:
( )
11 3 3
3 3
1
= + Φ − − ∆ − Φ − ∆
− − ∆ − ∆
τ = Φ + − Φ
τ τ
o p p
p p
p C C ;
.C .C
p
(6)
where Φ(x) is the cdf of the standard normal distribution. When a perfect process setup is assumed, it is assumed ∆ = 0. s represents the expected number of samples taken while the process operates in control:
( )
( )
0
1
assignable cause occurs between the th and 1 st samples
i
h h
s i Pr i i
e s e ∞ = −θ −θ = ⋅ + = − ∑ (7)
and ζ represents, given the occurrence of an assignable cause between the j and j + 1 sample, the expected time of occurrence of the cause within this interval:
(
)
( ) ( )(
(
)
)
1 1 1 1 1h i x h
hi
h i x h
hi
x hi e dx h e
e e dx
+ −θ −θ
+ −θ −θ
θ − − + θ ⋅
ζ = =
θ⋅ − θ
∫
∫ (8)
the conditional out-of-control average run length ARLw of the chart depends on the value w assumed by the random shift.
The conditional expected cycle length T(Ω|w) can be calculated as the sum of the in-control period plus the out-of-control production period durations:
( )
(
1)
01 2 0 1 1 w INSP
d s T n
T w h ARL T T
ARL r
− ⋅ ⋅
Ω = + + ⋅ − ζ + + +
θ (9)
then, the marginal expected quality control cost
CQ(Ω) is the averaged conditional expected cost
Cchart(Ω|w) over the distribution fw(w) of the process shift:
( )
sup( )
( )
inf
w
Q w chart w
C Ω =∫ C Ωw f w dw (10)
where the interval [winf; wsup] depends on the distribution of the random shift.
Another approach would consider the Taguchi loss function LF to estimate the quality cost
CQ(Ω). When the CTQ characteristic is controlled by the SPC inspection procedure, the symmetrical nominal-the-best expected loss function LFntb can be defined as follows:
(
)
2(
)
2 20 0
ntb
LF =kE X T− =k µ −T + σk
(11) where E(⋅) is the expected value symbol and the coefficient k is calculated as the ratio between a replacement cost Ck [$/part] and the half-width of the specification interval, (Yang and El-Haik, 2003). Assuming the in-control population µ0 as perfectly centered on the target T, i.e. µ0 = T, the out-of-control condition corresponding to a shift δ gives a conditional expected value of the loss function equal to:
( )
(
)
2(
)
2 2 2(
2)
1 0 0 01
ntb
LF δ =kE X T− =k µ − µ + σ = σk k + δ (12) Similarly, the out-of-control condition corresponding to a shift τ gives a conditional expected value of the loss function equal to:
( )
(
)
2(
)
2 2 2 20 0 1 0
ntb
LF τ =kE X T− =k µ − µ + σ =k kτσ (13) thus, by doing reference to the generic random shift W, the marginal quality control cost CQ(Ω) is proportional to the averaged conditional loss function over the distribution fw(w) of the process shift:
( )
sup( )
( ) ( )
inf
w
Q pr w ntb w
C Ω =r θ∫ h ARL⋅ Ωw − ζLF w f w dw (14)
where the interval [winf; wsup] depends on the distribution of the random shift. It is important to remember that the marginal cost CQ(Ω) does not refer to any expected quality cost incurred for a specific process history, but to an average cost used off-line to compare different chart strategies.
The expected hourly cost CLR(Ω) can be computed as:
( )
LR LR LR
INSP
n
C LR c c
h r
Ω = ⋅ = ⋅
⋅ (15)
within a sampling interval h; cLR is the cost of labour resource per time unit [$/hour] and rINSP
[parts/hour] is the rate of inspection. A value of
LR equal to 1 means that one inspector should be fully engaged to perform the control chart implementation. Values of LR larger than 1 require the presence of a crew of inspectors for the control of the quality characteristic: usually, for economic convenience, this last condition is far from occurring in small enterprises, where the SPC inspection is usually self-managed by the worker; thus, in many manufacturing environments it holds LR < 1.
3. The process and inspection
station configuration
When designing a control chart, an important issue is to include the manufacturing process configuration in the optimization problem so as to get optimal design parameters and a correct estimate of the expected inspection cost. A recent stream of research investigates models dealing with multi-stage process configuration and stream of variation by means of regression models and linear state space models. This stream of research is out of the focus of this paper and will not be discussed here: the interested reader can found an extensive review about it in Tsung, Li and Jin (2008).
Here, accounting for the process configuration means embedding in the selected economic model data information about the available manufacturing resources and process productivity/configuration at the stage where SPC should be performed; mainly, production and inspection rates, availability of resources to do the SPC activities and the way how parts needing inspection are moved within the process stage should be included in the model.
Formerly, only the SPC manpower allocation constraint has been considered in literature. The first contribution dealing with the economic design of control charts constrained by the labour resource is given by Rohleder and Silver (2002). The authors explicitly consider the labour time required for sampling, investigation, extra processing effort per unit due to operating the process out-of-control and the time to put the process back into control. Furthermore, they add constraints on the available testing equipment. A Lagrangian relaxation method has been adopted as the optimization algorithm of the constrained non-linear optimization problem. A sensitivity analysis based on a two-level factorial experiment varying several process operating parameters and costs demonstrates the influence of the labour resource constraint on the expected quality control costs. They found that, in many
cases, a small increase in labour can significantly improve the overall cost performance and outgoing quality due to tighter quality control. In many cases, and in particular when the shift in the process mean is small it is best not to collect a sample, but rather just check the process and determine if it is operating properly. Finally, it is worth noting that the model is statistically unconstrained.
The explicit optimization of manpower allocation when a control chart should be designed has been investigated in Wu, Shamsuzzaman and Wang (2006) for the design of the Fixed Parameter FP Shewhart control chart monitoring the sample mean. This chart is denoted as M-Chart. A Taguchi cost model has been adopted, accordingly to Equations 14 and 15. In this research, for the first time the labour cost CLR is explicitly taken into account and the authors demonstrate that varying the level of available workforce LR to do the SPC inspections influences both CLR and CQ. In particular, increasing LR leads to a higher labour cost but, conversely, allows for larger sample sizes n and shorter sampling intervals h, which improve the chart sensitivity and reduce the quality control cost CQ. Thus, a trade-off condition can be determined and a minimum inspection cost is achieved. To model the problem, production and inspection rates are considered but no reference is done to sampling costs and the way how parts are moved in the process stage and are released to the inspection area. Furthermore, the labour resource is not constrained. On the other hand, a constraint on the in-control average time to signal ATS0 is fixed. The problem is formalized by assuming as independent variables the sample size n and the number LR of operators allocated to do the SPC inspection. A two-stage optimization procedure allows the constrained non-linear optimization problem to be solved. A numerical analysis based on a factorial experiment shows the outperformance of the M-chart over a conventional Shewhart X having n = 5 and 3-sigma limits. It is shown that the conventional chart uses far less labour resource than required to minimize the total inspection cost
The economic design constrained by labour resource of Variable Sample Size (VSS), Variable Sampling Interval (VSI) and Variable Sample Size and Sampling Interval (VSSI) Shewhart control charts monitoring the sample mean has been proposed by Celano (2009). An adaptive control chart allows n and/or h to be varied at two levels, respectively denoted as (n1 < n2) and (h1 > h2), depending on the position of the last plotted point on the chart. The control chart design problem is approached as that of designing a local SPC inspection procedure within a workstation where the same worker should perform both the manufacturing/assembly operations and the SPC inspection control. Sharing the labour resource can limit the domain of feasible SPC inspection designs or, if available, calls for additional resources whenever required by the inspection procedure. The model proposed by Lorenzen and Vance (1986) has been extended to the adaptive configuration of the investigated charts. Similarly to the sample size n
and sampling interval h, two levels LR1 < LR2 have been considered for the required labour resource. These two levels are a function of the sample size and the sampling interval: when a point falls within one of the chart warning zones, then successive inspection is tightened and an higher amount LR2
of labour resource is required; otherwise, if the point is plotted in the central zone of the control interval, then the inspection is loosened and the labour resource LR1 needed to do the next SPC inspection can be reduced. On the long run, an expected labour resource E(LR) is computed and used to evaluate the expected labour resource cost. The investigated model considers an upper constraint on the labour resource and allows for the presence of additional labour resource to complete the inspection, if needed. The optimization problem is formulated as a constrained non-linear optimization problem and is solved through a Generalized Reduced Gradient algorithm. To design the general VSSI adaptive control chart LR2, n1, n2, h2
and the width l of the warning limits are considered as independent variables. A statistical constraint on the average time to signal bounds the expected time between two successive false alarms. An extensive numerical analysis based on a fractional factorial design investigates the effect of several process factors on the expected inspection cost and chart selection. The results show that the ratio CLR/
CINSP is always less than 8%: that is, the expected inspection cost is mainly influenced by the expected quality control cost. Thus, whenever possible, increasing the SPC manpower capacity is suggested to obtain significant cost reductions at a limited expense in terms of labour resource. Furthermore,
the implementation of the adaptive policies is particularly effective when processes are highly capable, that is when the capability index is Cp > 2. An extension of this model to the variable parameter Vp control chart is proposed in Celano et al. (2009). In this paper, the inspection station configuration is also taken into account. The same approach has been followed by Celano (2010) and Celano et al. (2011) to design the EWMA charts monitoring the sample mean and a logarithmic transformation of the sample standard deviation, respectively. The underlying idea of these papers is considering the effect of process configuration at the inspection stage. The approach is not general, but explicitly refers to processes manufacturing discrete parts like CNC machining of mechanical components or automatic/manual assembly. The proposed modelling approach considers that the products to be worked are moved throughout the process into pallets, i.e. containers or holding fixtures, having finite capacity equal to B parts. To meet the scheduled demand, pallets are synchronously moved by means of conveyors or similar systems from one workstation to its downstream every time
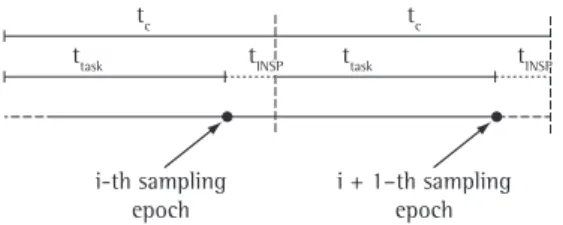
tc, where tc = B/rPR min. Thus, the cycle time tc of the process is proportional to the reciprocal of the process rate of production rPR: these parameters are known by the quality practitioner and depend both on the scheduled hourly demand of parts and the process efficiency. A manufacturing resource is required to complete/monitor a set of assigned tasks to work a batch of parts positioned within the pallet and, then, the local inspection of the quality characteristic can start. A time tTASK is defined to be equal to the time allotted to complete a set of working/assembling tasks on each pallet of parts. Thus, the available time tINSP at the workstation to perform the inspection SPC activities on a subset of parts within each pallet is equal to the difference between tc and tTASK, see Figure 1.
It can be assumed tTASK= (1-f)⋅tc and tINSP = f⋅tc, where f < 1 can be interpreted as the maximum fraction of tc which can be allocated to do the local inspection at the workstation on a pallet of parts without incurring in a bottleneck. For example, if
tc = 0.5 hours, tTASK = 0.4 hours and tINSP = 0.1 hours, then f = tINSP / tc = 0.2, i.e. the 20% of cycle time
tc can be allocated to do the local SPC inspection activities. The rate of inspection of a single part
in any case larger than the time 1/rINSP needed to inspect a single part. i.e.:
INSP PR
c INSP
t r
f
t B r
= ≥
⋅ (16)
The workstation management strategy allows the worker to start the SPC inspection activities just at the end of the working/assembly operations on a pallet of parts. Then, for this process configuration the sampling interval h should be equal to or be a multiple m of the cycle time tc, see Figure 1. A pallet is assumed as an available buffer allowing for a rational subgroup of measures to be collected from the process. Thus, at the i-th sampling time the sample size n should be lower than the pallet size B and the time length of each inspection
n/rINSP cannot be longer than the available time
tINSP to avoid the occurrence of a blocking at the workstation. These assumptions lead to constrain the maximum feasible sample size nmax to:
(
)
max B INSP c
n =min f ⋅B; r ⋅ ⋅f t (17) where fB≤ 1, (fB should be fixed less than 1 when it is convenient to inspect just a subset of parts within a pallet, otherwise fB = 1), and [x] denotes the integer less than or equal to x. Such a process modelling clearly constrains the range of the decision variables and restricts the values they can assume: for example, the sampling interval h
cannot be considered a continuous variable but a discrete one assuming values multiples of the cycle time tc. Similarly, the sample size n is upper bounded by a maximum value depending on the SPC resource availability and the buffer dimension. The economic design problem is solved as a constrained non-linear optimization problem by means of properly designed algorithms. The set of independent variables varies with the specific chart scheme. The numerical findings from the papers implementing these models show interesting results. First of all, the outperformance of the advanced charts is not so evident as in unconstrained optimization: the FP Shewhart charts is the most
economic strategy with respect to both the adaptive charts and the time weighted EWMA. The process configuration strongly influences the selection of the design variables. The maximum allowed sample size nmax is often selected in the investigated benchmark of problems; in particular, the sample size n is frequently constrained by tINSP when the rate of production rPR assumes high values: for a fixed batch size B and inspection rate rINSP, faster rates of productions dramatically reduce the cycle time tc; consequently, the time available to do the inspection significantly shortens, thus limiting the feasible range for n. The maximum allowed sampling interval hmax is the constraint which more frequently binds the optimal design. Usually, the selection of
hmax is just a matter of management strategy: for example, a quality assurance procedure requires that no inspection can occur up to five batches, thus, hmax = 5tc. These decisions can often derive from contractual agreements or other convenience reasoning. Of course, whenever possible this constraint can be relaxed and further cost savings can be achieved. If parts belonging to a pallet are released all together to the local inspection station every tc hours, then the cycle time tc becomes a lower bound to the sampling interval, see Figure 1. Some particular process operating conditions bring the optimal economic designs to be bounded by the shorter sampling interval hmin: poorly capable processes with high rates of production rpr and/ or cost cnc of producing a non conforming part require frequent sampling to limit the number of non-conformities; consequently, the design solutions are always found on the frontier delimited by the hmin bounding value.
4. Randomness of the process shift
Independently from the objective of the design, usually control charts parameters are selected with respect to an assumed value of the process shift. However, a set of design parameters would not be robust with respect to a shift value misspecification or the occurrence of another shift size than its design value. Therefore, introducing the shift uncertainty at the design stage of an SPC inspection procedure based on control charts implementation is an issue worth to be investigated. Often, process shifts originating from various variation sources occur with different sizes: for example, a random process shift can occur within stages of those manufacturing processes where the change in the position of the mean or the increase in dispersion of the quality characteristic can strongly depend on the human factor.
An earlier contribution to the economic design of control charts in presence of multiple assignable causes in given in Duncan (1971). The proposed economic model extends the original one discussed in Duncan (1956) and considers multiple assignable causes, each having a specific shift size and a corresponding exponential distribution. Thus, the randomness is not related to the shift size but to the mean time between the occurrence of two successive causes. The main finding of this research is that often the optimum design obtained for an approximating single cause model approaches as well the design for the multiple cause model.
A stochastic assignable cause model assuming that the shift has a probability distribution having mean δµ, has been originally proposed in Wu, Shamsuzzaman and Pan (2004). No reference is done to either the labour resource availability or the process configuration. The marginal quality control cost CQ(Ω) reported in Equation 14 is the function to be minimized. Accordingly to what is proposed in Wu, Shamsuzzaman and Pan (2004), to implement a control chart whose design is accounting for the shift randomness, the SPC activities within a manufacturing process are divided in three successive phases. The phase I of the control chart implementation requires the in-control population mean µ0 and standard deviation σ0 to be estimated and the tentative chart control limits to be tested and validated; then, during the phase II the control chart runs for some time and m out-of-control process conditions di, (i = 1,…m), are gathered: suppose an out-of-control condition is signalled at the k2th sample and the follow-up investigation discovers that the responsible assignable cause occurs between the (k1-1)th and the k1th samples (k1 < k2). It means that the k1th to k2th samples are taken under the out-of-control condition. The grand average X of the sample means XK, (K = k1,
k1+1,..., k2) of these samples can be used to estimate of the mean shift di, which represents a sample value of δµ for this particular out-of-control case:
0
0
i
X d = − µ
σ (18)
Then, a non parametric approach can be
adopted to compute costs by directly referring to the collected values di of the shift size and without fitting them to a theoretical distribution: in this case, the integral operator in Equation 14 changes to a finite summation of conditional costs each depending on a specific ARL(Ω|di) value; otherwise, a parametric approach fitting the collected values di
to a theoretical distribution is adopted: in this case,
the integral operator in Equation 14 allows the marginal cost over the fitted shift distribution to be computed. The theoretical Rayleigh distribution having parameter δµ is suggested to model the shift
of the mean:
( )
2 222 4
fδ exp
δ δ
πδ πδ
δ = −
µ µ (19)
Then, the chart design parameters can be determined by minimizing the marginal expected quality control cost CQ and the phase III chart implementation with the new design parameters is started. During phase III, once a new out-of-control condition occurs the updating of δµ
calls for new optimal design parameters. In Wu, Shamsuzzaman and Pan (2004) is it also shown that for the Rayleigh distribution at least m > 40 sample values of the mean shift should be collected to get a cost estimation through the non parametric approach whose relative error with respect to the exact value is less than 5%. A numerical analysis compares a Shewhart chart optimized with respect to the marginal cost with other charts referring to a single value of the shift and quantifies the saving achieved through the proposed approach. A further step of the study also considers the effects of several process factors and the adoption of the model from Duncan (1956). The same study has proposed by Jiao and Helo (2008) for the optimal design of a CUSUM control chart. The optimization of fixed parameters Shewhart charts in presence of the manpower allocation problem is investigated in Wu, Shamsuzzaman and Wang (2006).
recommended especially when the manufacturing activities related to the production of a CTQ parameter have a small variability and their capability index tends to be large; for working operations characterized by small values of the capability index a Variable Sample Size adaptive inspection policy works better than a Variable Sampling Interval or a combined procedure; a design optimization taking into account shift randomness should be always performed when the process has low Cp values:
thus, an effort is required to the management to get knowledge about the history and the distribution of the out-of-control events related to the controlled CTQ parameter. Otherwise, if the process capability is high there is no need to statistically model the shift. In this case it is sufficient to carry out the design optimization by assuming the entity of the shift δ as deterministic and equal to its observed average value. It follows that careful attention should be paid to the evaluation of the capability index and the failure rate: the knowledge of these parameters is a key driver to select the best SPC inspection procedure.
A similar study has been performed in (CELANO, 2010) for the design of the EWMA chart monitoring the sample mean. Further, the optimization problem is here constrained by the workstation configuration. The numerical investigation studies the effect of approximating the shift randomness on both the design parameters selection and the accuracy in expected cost estimation. The investigated optimization problems consider leaving out the shift randomness and designing the chart with respect to a deterministic value of the shift; modelling the uncertainty associated to the shift by doing reference to two approximated fitting distributions, (uniform, triangular) or adopting a non parametric approach which considers a discrete distribution of the collected shift sizes based on the histogram of historical data. The paper demonstrates that the strategy based on removing the randomness of the shift can lead to design misspecification. The best random shift fitting strategy is the discrete distribution: in fact, the design parameters selected by adopting this modelling approach are close to those obtained by optimizing the actual random shift Rayleigh distribution. From a practical perspective, this result can be considered as promising because implementing a discrete distribution requires the quality practitioner just to collect sufficient data to build a frequency distribution without guessing any distribution shape. However, a major drawback is the poor accuracy in the estimation of the actual expected inspection cost through the approximating
distribution: percentage errors of about 10% should be accounted for by practitioners.
Another paper investigating the economic design of EWMA and CUSUM charts monitoring the sample mean and random shift size has been proposed by Chen and Chen (2007). The cost model allows for a quality impact cost to be computed by means of the Taguchi loss function presented in Equation 11 and integrated over the shift size distribution. The random shift size is assumed to be normally distributed. Neither labour resource cost or constraint nor the workstation configuration are considered in the model. The study demonstrates the outperformance of the EWMA vs. the CUSUM chart for moderate shifts. On the other hand, when the shift size is more certain and large the CUSUM chart is the best SPC monitoring tool. This paper also discusses an approximate procedure to compute the quality impact cost when the parameters of the normal random shift are not known in advance. Some tables are provided for practitioners containing each set of chart design parameters computed for normally distributed shift sizes and such that their mean is centred on the target. The standard deviation of the shift size is varied over a wide range of values to account for the lack of information about the shift dispersion. Then, the same design parameters are adopted to compute a quality impact cost averaged over a wide range of shift size population means other than the target. The averaged impact cost is determined by means of a weighted sum of costs each corresponding to a specific value of the shift size population mean. Equal cost weights are assumed in the quality impact cost estimation.
The FP Shewhart and the EWMA control chart monitoring the sample standard deviation are investigated in Celano et al. (2011). The obtained results are similar to those obtained for the same charts monitoring the sample mean and do not claim here a specific discussion.
Chart 2 shows in chronological order the papers cited in this review and some relevant information.
5. Discussion
This review shows that several points are still open and worth to be investigated in future research. About the workstation and resource configuration, the following list of interesting topics can be proposed:
• currently, only fixed and adaptive parameters
of huge amount of data about the quality characteristics of a product an investigation of multivariate charts is also worth to be carried out;
• the SPC inspection workstation configuration has
been modelled for a single product manufacturing process where the items to be inspected at a stage are grouped and moved within a pallet in a single stream; it would be interesting to investigate how the SPC inspection can be modelled in manufacturing processes simultaneously producing different products along the same stream of production;
• up to now, the SPC labour resource has been
modelled by assuming a fraction of available capacity to be saturated by the SPC activities. However, in a single/multiple stream and single/ multi product manufacturing process it could happen that the available capacity should be shared among the different streams and/or products and, consequently, SPC inspections. Currently, there are not papers taking into account this problem subject to a manpower availability constraint at the moment of selecting the chart design parameters;
• recently, a few papers have extended the economic
design problem to multi-stage products, e.g. (WU; SHAMSUZZAMAN; WANG, 2007), but no specific reference is done to the workstation configuration: an explicit model of the process including the workstation configuration would enhance the model efficiency in representing
the actual process operating condition. Discrete event simulation software is a powerful tool to represent manufacturing process complexity in the Operations Research field: its implementation to model SPC activities in a manufacturing process is a technique worth to be investigated;
The problem of designing a control chart when the quality characteristic parameters are estimated has been extensively investigated in literature, see Jensen et al. (2006) for a recent review about this problem; conversely, a few papers have systematically analyzed the problem of modelling the random shift size. Thus, the available studies and findings are still limited and need to be further investigated. In particular:
• the Rayleigh and normal distribution have been
proposed as efficient statistical models to fit the random behaviour of the shift size; however, there is no practical justification to this assumption: an extensive study investigating the different ways how shift size can occur in different manufacturing environments is required: the analysis should include model building to relate the influencing factors with the entity of the shift;
• considering the presence of bimodal shift sizes is
worth to be analysed: there are charts which work well for moderate shifts, conversely other charts have good detecting properties for large shift sizes. The presence of a bimodal shift size calls for a chart scheme working well for a large range of the Chart 2. Relevant references in chronological order.
References Economic model Chart Monitored statistic
Statistical constraint
Process configuration
Labour
resource Shift
Duncan (1971) Duncan (1956) Shewhart Sample Mean No Absent Absent Multiple sizes Rohleder and Silver
(2002) Duncan (1956) FP Shewhart Sample Mean No Absent Constrained Deterministic Wu, Shamsuzzaman
and Pan (2004)
Taguchi, Elsayed and Hsiang (1989)/
Duncan (1956)
FP Shewhart Sample Mean Yes Absent Absent Random
Wu, Shamsuzzaman and Wang (2006)
Taguchi, Elsayed
and Hsiang (1989) FP Shewhart Sample Mean Yes Absent Unconstrained Random Chen and Chen
(2007)
Taguchi, Elsayed and Hsiang (1989)
EWMA
CUSUM Sample Mean Yes Absent Absent Random Jiao and Helo
(2008)
Taguchi, Elsayed
and Hsiang (1989) CUSUM Sample Mean Yes Absent Unconstrained Random Celano (2009) Lorenzen and
Vance (1986)
Adaptive
Shewhart Sample Mean Yes Absent Constrained Random Celano et al. (2009) Lorenzen and
Vance (1986)
Adaptive
Shewhart Sample Mean Yes Yes Constrained Random Shamsuzzaman, Wu
and Elias (2009)
Taguchi, Elsayed
and Hsiang (1989) FP Shewhart
Sample Mean and Standard
Deviation
Yes Absent Unconstrained Random
Celano (2010) Lorenzen and
Vance (1986) EWMA Sample Mean Yes Yes Constrained Random Celano et al. (2011) Lorenzen and
Vance (1986) EWMA
Sample St.
shift; new charting schemes accounting for this problem are welcome;
• it has been demonstrated that the non parametric
approach based on a collection of historical out-of-control sample means could fit quite well the underlying stochastic behaviour of the shift size. However, an important limitation to this approach is represented by the availability of a sufficient number m of out-of-control process means, due to the process failure rate. A systematic study about the number of samples to be taken to limit the misspecification error in the estimation of the random shift distribution parameters is needed;
• the available models dealing with random shifts
consider a common failure rate based on an exponential random shock mechanism; it is known that large shift sizes can occur less frequently than moderate or small shifts. Models including multiple assignable causes with random shifts are worth to be investigated;
• a study of multivariate charts in presence of
random shifts having different stochastic models for each of the controlled quality characteristic is interesting because the statistical properties would result significantly different depending on the quality characteristic that has been shifted to the out-of-control condition.
Of course, these two lists of topics are partial and do not cover the wide spectrum of potential issues worth to be investigated in the SPC literature related to the constrained economic design of control charts in presence of random shifts.
6. Conclusions
Economic design of control charts has been extensively investigated in the SPC literature. Although the design parameters selection driven by cost opportunity would be an appealing managerial issue, rarely it has been implemented by quality practitioners due to several weak points: among them, the difficulty in estimating cost and process parameters, the lack of specific mathematical modelling of the inspection workstation and the misspecification of the random process shift are the most important. This paper has presented a review of the most recent research contributions dealing with modelling the SPC inspection workstation and the randomness of the shift size. These papers can potentially open a new stream of research trying to improve the efficiency of the economic models in representing the manufacturing process stages where the chart should be implemented. Several issues are still worth to be investigated and a number of possible research directions can be tackled by people working in the SPC field.
References
CELANO, G. et al. Constrained economic design of a SPC procedure in a manual multi-task workstation. In: international conference on industrial engineering and systems management, 2009, Montreal, Canada. Proceedings…
CELANO, G. et al. Constrained economic design of S control charts for random process shifts. International Journal of Quality and Reliability Management, v. 28, n. 3, 2011. Accepted paper.
CELANO, G. On the constrained economic-statistical design of control charts by the inspection workstation configuration. International Journal of Quality and Engineering Technology, v. 1, n. 3, p. 231-252, 2010. CELANO, G. Robust design of adaptive control charts for
manual manufacturing/inspection workstations. Journal of Applied Statistics, v. 36, p. 181-203, 2009.
CHEN, A.; CHEN, Y. K. Design of EWMA and CUSUM control charts subject to random shift sizes and quality impacts. IIE Transactions, v. 39, n. 12, p. 1127-1141, 2007. CHIU, W. K. The economic design of CUSUM charts for
controlling normal means. Journal of the Royal Statistical Society. Series C (Applied Statistics), v. 23, n. 3, p. 420-433, 1974.
COSTA, A. F. B. X charts with variable parameters. Journal of Quality Technology, v. 31, p. 408-416, 1999. COSTA, A. F. B. X charts with variable sample size and
sampling intervals. Journal of Quality Technology, v. 29, p. 197-204, 1997.
COSTA, A. F. B. X charts with variable sample size. Journal of Quality Technology, v. 26, p. 155-163, 1994. DE MAGALHAES, M. S.; COSTA, A. F. B.; EPPRECHT, E. K.
Constrained optimization model for the design of an adaptive X chart. International Journal of Production Research, v. 40, n. 13, p. 3199-3218, 2002.
DUNCAN, A. J. The economic design of X chart when there is a multiplicity of assignable causes. Journal of the American Statistical Association, v. 66, n. 333, p. 107-121, 1971.
DUNCAN, A. J. The economic design of X charts used to maintain current control of a process. Journal of American Statistical Association, v. 51, p. 228-242, 1956. JENSEN, W. A. et al. Effects of parameter estimation on
control chart properties: a literature review. Journal of Quality Technology, v. 38, n. 4, p. 349-364, 2006. JIAO, J. R.; HELO, P. T. Optimization design of a CUSUM
control chart based on Taguchi’s loss function. International Journal of Advanced Manufacturing Technology, v. 35, p. 1234-1243, 2008.
LADANY, S. P. Optimal use of control charts for controlling current production. Management Science, v. 19, p. 219-233, 1973.
LORENZEN, T. J.; VANCE, L. C. The economic design of control charts: a unified approach. Technometrics, v. 28, p. 3-10, 1986.
MONTGOMERY, D. C. et al. Statistically constrained economic design of the EWMA control chart. Journal of Quality Technology, v. 27, p. 250-256, 1995.
PRABHU, S. S.; MONTGOMERY, D. C.; RUNGER, G. C. Economic-statistical design of an adaptive X chart. International Journal of Production Economics, v. 49, p. 1-15, 1997.
ROHLEDER, T. R.; SILVER, E. A. Statistical Process Control subject to a labour resource constraint. International Journal of Production Research, v. 40, n. 14, p. 3337-3356, 2002.
SHAMSUZZAMAN, M.; WU, Z.; ELIAS, S. M. R. Design of X&S control chart with optimal manpower deployment. Computers & Industrial Engineering, v. 56, p. 1589-1596, 2009.
SPIRING, F. A.; YEUNG, A. S. A general class of loss functions with industrial applications. Journal of Quality Technology, v. 30, p. 152-162, 1998.
TAGUCHI, G.; ELSAYED, E. A.; HSIANG, T. Quality engineering in production systems. McGraw-Hill: New York, 1989. TSUNG, F.; LI, Y.; JIN, M. Statistical Process Control for
multistage manufacturing and service operations: a review and some extensions. International Journal of Services Operations and Informatics, v. 3, n. 2, p. 191-204, 2008.
WU, Z.; SHAMSUZZAMAN, M.; PAN, E. S. Optimization design of control charts based on Taguchi’s loss function and random process shifts. International Journal of Production Research, v. 42, n. 2, p. 379-390, 2004. WU, Z.; SHAMSUZZAMAN, M.; WANG, Q. Designs of control
charts with optimal manpower deployment. International Journal of Production Research, v. 44, n. 9, p. 2119-2132, 2006.
WU, Z.; SHAMSUZZAMAN, M.; WANG, Q. The cost minimization and manpower deployment to SPC in a multistage manufacturing system. International Journal of Production Economics, v. 106, p. 275-287, 2007. YANG, K.; EL-HAIK, B. Design for six sigma. a roadmap for
product development. McGraw-Hill, 2003.
Acknowledgements
The author of this manuscript wishes to thank one of the anonymous referees for his/her precious suggestions which allowed to improve the quality of the manuscript from the original to the revised version.
Sobre planejamento de gráficos de controle com restrição:
uma revisão da literatura
Resumo
O planejamento econômico é uma abordagem interessante para estabelecer os parâmetros de um gráfico de controle. Infelizmente, os modelos econômicos para planejar gráficos de controle têm sido pouco aplicados por profissionais de qualidade, devido às suposições simplificadoras utilizadas para representar complexos e multifacetados (com restrições presentes) processos de produção e ambientes transacionais. Embora tenha havido um crescente ceticismo sobre a utilidade de modelos econômicos, na prática, alguns estudos recentes na literatura tratam o problema de planejameto econômico dos gráficos de controle sob um novo ponto de vista: o objetivo é conseguir um bom trade-off e ligação entre aspectos operacionais e estatísticos. Sob essa perspectiva, o problema de planejamento econômico pode ser visto, em um sentido mais amplo, como um planejamento com restrição em um procedimento de inspeção no controle estatístico de processo. Este trabalho apresenta uma discussão de algumas das novas tendências no que se refere às pesquisas em planejamento econômico e descreve a importância de considerar as restrições relacionadas com a disponibilidade de recursos em um controle estatístico de processo e modelagem da ocorrência de mudanças aleatórias.
Palavras-chave