Comparative study of dental cephalometric
patterns of Japanese-Brazilian, Caucasian and
Mongoloid patients
Renata Sathler1, Arnaldo Pinzan2, Thais Maria Freire Fernandes3,
Renato Rodrigues de Almeida2, José Fernando Castanha Henriques2
Introduction: The objective of this study was to identify the patterns of dental variables of adolescent Japanese-Brazilian descents with normal occlusion, and also to compare them with a similar Caucasian and Mongoloid sample. Methods: Lateral cephalometric radiographs were used to compare the groups: Caucasian (n = 40), Japanese-Brazilian (n = 32) and Mongoloid (n = 33). The statistical tests used were one-way ANOVA and ANCOVA. The cephalometric measurements used followed the analyses of Steiner, Tweed and McNamara Jr. Results: Statistical differences (P < 0.05) indicated a smaller interincisal angle and overbite for the Japanese-Brazilian sample, when compared to the Caucasian sample, al-though with similar values to the Mongoloid group. Conclusion: The dental patterns found for the Japanese-Brazilian descents were, in general, more similar to those of the Mongoloid sample.
Keywords: Ethnic group. Reference standards. Orthodontics.
How to cite this article: Sathler R, Pinzan A, Fernandes TMF, Almeida RR, Henriques JFC. Comparative study of dental cephalometric patterns of Japanese-Brazilian, Caucasian and Mongoloid patients. Dental Press J Orthod. 2014 July-Aug;19(4):50-7. DOI: http://dx.doi.org/10.1590/2176-9451.19.4.050-057.oar
Submitted: April 24, 2009 - Revised and accepted: June 22, 2009
Contact address: Renata Sathler Faculdade de Odontologia de Bauru
Alameda Octávio Pinheiro Brisolla, 9-75 – Bauru/SP - Brazil — CEP: 17012-901 E-mail: [email protected]
» The authors report no commercial, proprietary or financial interest in the products or companies described in this article.
» Patients displayed in this article previously approved the use of their facial and in-traoral photographs.
1 PhD in Orthodontics, School of Dentistry —USP/ Bauru.
2 Professor, Department of Orthodontics, University of Northern Paraná
(UNOPAR).
3 Postdoc in Dentistry, School of Dentistry —USP/ Bauru.
DOI: http://dx.doi.org/10.1590/2176-9451.19.4.050-057.oar
Objetivo: as características cefalométricas dentárias variam consideravelmente entre as diferentes raças. No Brasil, em virtude da grande miscigenação populacional, é necessário conhecer, também, as variações apresentadas pelas misturas dessas raças. Por essa razão, o objetivo desse estudo foi identificar o padrão das variáveis dentárias de jovens mestiços nipo-brasileiros com oclusão normal e compará-los com amostras semelhantes de leucodermas e de xantodermas. Mé-todos: foram utilizadas 40 telerradiografias de jovens leucodermas, 32 de nipo-brasileiros e 33 de xantodermas. As rês amostras apresentavam indivíduos com oclusão normal e face bem balanceada. Foram realizadas análises estatísticas de variância a um critério (ANOVA) e a de covariância (ANCOVA). Basicamente, as variáveis cefalométricas usadas segui-ram as preconizadas por Steiner, Tweed e McNamara Jr. Resultados: encontrou-se diferença estatística (p < 0,05) entre as raças em cinco das variáveis estudadas. Essas diferenças indicaram menor ângulo interincisivos e menor sobremordida para a amostra nipo-brasileira, com relação à amostra leucoderma, mas com valores semelhantes aos da amostra xantoder-ma. Conclusão: os valores dentários encontrados para os jovens nipo-brasileiros foram, em geral, mais similares àqueles da amostra de xantoderma.
INTRODUCTION
In 1899, when the study of malocclusion was limited to dental casts, Angle proposed his classiication.2 Since then, several authors have dedicated to improve the di-agnosis methodology used at that time.1
The creation of cephalostat enabled us to study the alterations that occur in the face and cranium, which, in turn, allowed us to make better diagnoses and con-duct more accurate treatment. As a consequence, it became necessary to determine standard variables to guide interpretation of results. Additionally, it also became interesting to study the mean cephalometric values of groups with normal occlusion and satisfacto-ry skeletal pattern. Therefore, many analysis methods were created and Downs,6 Tweed,27 Steiner24 as well as many others explored the development of standards that would give support to the clinical ield.
It is known that skeletal and facial structures directly inluence the position of upper and lower teeth as well as the appearance of the facial proile. Therefore, the mean cephalometric variables must be explicit to the orthodontic community in order to improve treatment ofered to patients, including descendants of diferent races. This is due to the fact that the relation of normal-ity between skeletal and dental positions may be greatly
diverse due to ethnic variations22,25. Thus, this was the basis on which this study was conducted.
Keeping those relections in mind,6,26 the objec-tive of this research was to determine the mean dental cephalometric variables of young Japanese-Brazilian descendants with normal occlusion, and compare the results with the values of two other groups: Caucasian and Mongoloid. Although many papers on cephalom-etry are available in the scientiic literature, to date, no research has been conducted on this subject.
MATERIAL AND METHODS
Material
The sample comprised 105 lateral cephalomet-ric radiographs of 32 young Japanese-Brazilians, 40 young Caucasian subjects and 33 young Mongol-oid, all with normal occlusion and well balanced face. Radiographs were retrieved from the archives of the Department of Orthodontics, School of Dentistry, University of São Paulo/Bauru.
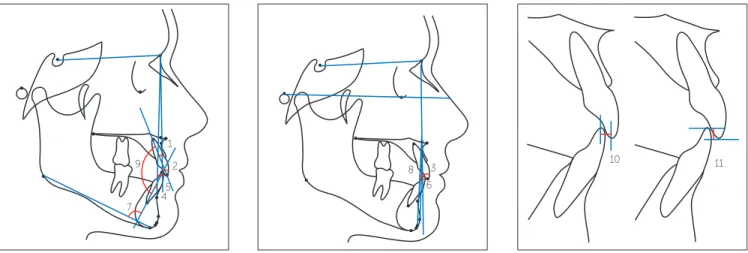
The sample presented with all permanent teeth in occlusion (the presence of second and third molars was optional), absence of orthodontic treatment, nor-mal occlusion or Class I nor-malocclusion. Crowding not greater than 2 mm was acceptable (Fig 1).
Caucasian and the Mongoloid samples should have both parents Caucasian and Mongoloid, respectively. This means that there was an absence of racial miscegenation. On the contrary, the Japanese-Brazilian sample was rep-resented by descents of both Caucasian and Mongoloid.
There was also the concern of selecting a nearly iden-tical number of boys and girls for the samples of Cauca-sian (20 of each sex), Japanese-Brazilian (17 females and 15 males) and Mongoloid (17 females and 16 males), thus providing homogeneous groups in relation to sex.
Methods
The three groups were radiographed in maximum intercuspation, since the difference between this po-sition and the mandibular centric relation is minimal at this age and slightly affects the cephalometric re-sults, especially in cases of normal occlusion.30
After the anatomical drawing, landmarks were identified and subsequently scanned using Numon-ics, AccuGrid A30TL (Numonics Corporation, Montgomeryville, PA, USA). The magnification factor was corrected (6% for the Caucasian sample, 9.8% for the Japanese-Brazilian sample and 7% and 8% for the Mongoloid sample) by the software itself.
The variables studied were: 1.NA, 1-NA, 1-Aperp, 1.NB, 1-NB, 1-AP, IMPA, I Line, 1.1, Overjet and Overbite (Fig 2).
Method error
Tracings and measurements were performed by the same examiner who also transferred data to the software Dentofacial Planner 7.02 (Dentofacial Plan-ner Software Inc., Toronto, Ontario, Canada). After
twenty days, 20 radiographs were randomly selected and retraced (both manually and digitally) to deter-mine reliability of results.
Systematic and random errors were evaluated in-dependently for each variable. T-test was used to cal-culate systematic error,11 whereas Dahlberg’s formula was used to calculate random error (Table 1).
Descriptive and comparative analyses
Before proceeding with descriptive and comparative analyses, the variables were submitted to Kolmogorov-Smirnov test which conirmed the normal distribution of the samples and allowed the use of parametric tests.
Due to lack of compatibility between patients’ age in the Mongoloid group and to avoid interference in the results, ANCOVA (covariance analysis) test was per-formed with patients’ age considered as the adjustable variable, thereby permitting approximation of values. The results obtained showed that age did not inluence any of the studied variables, thus allowing reliable sta-tistic comparison. ANOVA test was used to compare patients’ age (Table 2). Results were considered statisti-cally signiicant for P < 0.05. All aforementioned tests were performed using Statistica for Windows 7.0 sot-ware (Statistica for Windows 7.0 Copyright StatSot. Inc. Tulsa, Okla, USA. http://www.statsot.com).
RESULTS
Random and systematic error
Table 1 presents the statistical analysis performed to assess intra-examiner error. Systematic errors were found in four variables and random errors were con-sidered acceptable.
Figure 2 - Cephalometric variables.
11 10
3 6 8 1
2
45 9
Table 1 - Random error (Dahlberg formula) and systematic error (t test)
* Significant for P < 0.05.
Variable 1
st Tracing 2nd Tracing
Dahlberg p
Mean ± SD Mean ± SD
1.NA 24.62 ± 4.52 25.16 ± 4.20 1.410 0.518
1-NA 5.32 ± 2.22 5.25 ± 2.14 0.510 0.583
1-Aperp 6.35 ± 1.86 6.18 ± 1.73 0.422 0.240
1.NB 26.36 ± 7.48 26.99 ± 8.09 0.956 0.032*
1-NB 5.24 ± 2.49 5.29 ± 2.46 0.347 0.593
1-AP 3.47 ± 2.32 3.55 ± 2.34 0.208 0.258
IMPA 92.02 ± 7.94 92.52 ± 8.63 0.961 0.219
I Line -3.99 ± 2.52 -4.24 ± 2.44 0.250 0.031*
1.1 126.95 ± 10.35 125.81 ± 10.22 1.263 0.047*
Overjet 2.82 ± 0.88 2.62 ± 0.72 0.272 0.011*
Overbite 2.22 ± 1.26 2.05 ± 1.14 0.293 0.177
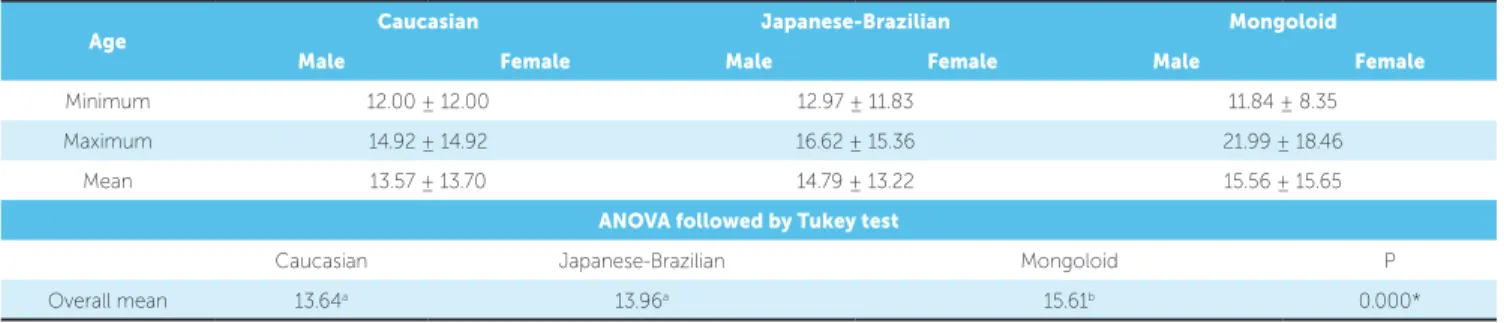
Table 2 - Minimum, maximum and mean age of Caucasian, Japanese-Brazilian and Mongoloid samples. ANOVA followed by Tukey test.
* Significant for P < 0.05.
Different letters account for significant differences.
Age Caucasian Japanese-Brazilian Mongoloid
Male Female Male Female Male Female
Minimum 12.00 ± 12.00 12.97 ± 11.83 11.84 ± 8.35
Maximum 14.92 ± 14.92 16.62 ± 15.36 21.99 ± 18.46
Mean 13.57 ± 13.70 14.79 ± 13.22 15.56 ± 15.65
ANOVA followed by Tukey test
Caucasian Japanese-Brazilian Mongoloid P
Overall mean 13.64a 13.96a 15.61b 0.000*
Age means
In order to analyze the minimum, maximum and mean age of Caucasian, Japanese-Brazilian and Mongoloid groups, the samples were separated by sex (Table 2).
Comparative analysis between groups
ANCOVA was applied to verify potential differ-ences between groups (Table 3).
DISCUSSION
Due to being practical and of simple comprehen-sion, cephalometry is still frequently used for orth-odontic teaching. Undergraduate students with little experience need clear and well-defined parameters to understand the purposes and limitations of orthodon-tic treatment. With pracorthodon-tice, the student gradually
gets rid of rigid numbers and goes on to value other subjective aspects such as patient’s face, profile and expectations. However, it is impossible to bring forth maturity before establishing the goals and patterns of normality.12,24
As for more experienced orthodontists, cephalo-metric values are the possibility to locate and quantify the problem, which allows them to choose the most appropriate treatment for the patient.
The authors who laid the groundwork of cephalo-metric analysis developed their norms based on Cau-casian samples.6,16,24,26 Later on, it was suggested that differences in normality values existed between dif-ferent racial groups.5,7,10,18,19
Method error
For random errors, the limits for the linear variables were set at 1 mm, whereas for the angular variables they were set at 1.5°. Important random errors were not found (Table 1).
Among the 11 studied variables, four presented sta-tistically signiicant diferences between the irst and the second measurements (Table 1).
Since the variables were used for comparison pur-poses,24 the application of these values was considered reliable. Additionally, the absence of random errors in-creases reliability of results.
The sample
In order to standardize the results, the sample was selected on the basis of patients’ lineage and occlu-sion. This is because gathering a sample in which other variables are equivalent allows us to obtain re-sults derived solely from racial differences between groups. Clearly, the strict inclusion criteria applied to the sample limited its size. However, a choice was made to sacrifice the number of subjects included in the research in order to enhance homogeneity of the sample. Before comparing the groups, a comparison
between patients’ sex was performed.7 Since no sta-tistically significant differences were found between them, both male and female patients were included in all three groups (Table 3).
The age group of choice was based on Ceylan, Bay-das and Bolukbasi’s4 indings in which the majority of patients submitted to orthodontic treatment is aged be-tween 10 and 14 years old. Therefore, this age group has priority in obtaining standard norms. Additionally, determining a particular age group favors comparisons with past and future studies.
The choice of variables
The criteria applied in selecting the variables were based on reliability, but also on frequency of their use in orthodontics.12 This facilitates a rapid visualization of results and future comparisons with other studies.
Only statistically diferent variables were discussed ater comparison with the Caucasian and Mongoloid groups (Table 3). These variables were gathered accord-ing to their representativity so as to facilitate compre-hension. Results were discussed focusing on the Japa-nese-Brazilian sample and their diferences to the Cau-casian and Mongoloid samples.
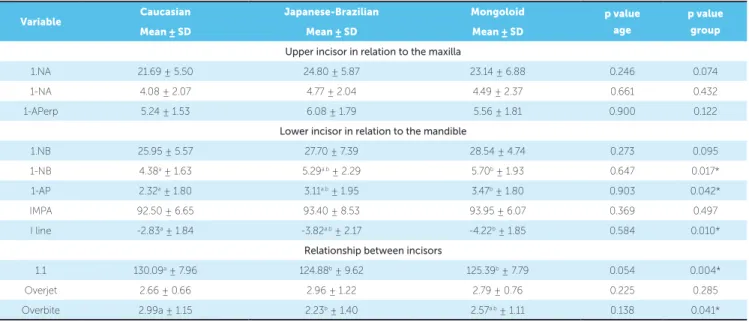
Table 3 - Comparison between groups. ANCOVA and Tukey test.
* Significant for P < 0.05.
Different letters account for significant differences.
Variable Caucasian Japanese-Brazilian Mongoloid p value
age
p value
group
Mean ± SD Mean ± SD Mean ± SD
Upper incisor in relation to the maxilla
1.NA 21.69 ± 5.50 24.80 ± 5.87 23.14 ± 6.88 0.246 0.074
1-NA 4.08 ± 2.07 4.77 ± 2.04 4.49 ± 2.37 0.661 0.432
1-APerp 5.24 ± 1.53 6.08 ± 1.79 5.56 ± 1.81 0.900 0.122
Lower incisor in relation to the mandible
1.NB 25.95 ± 5.57 27.70 ± 7.39 28.54 ± 4.74 0.273 0.095
1-NB 4.38a ± 1.63 5.29a.b ± 2.29 5.70b ± 1.93 0.647 0.017*
1-AP 2.32a ± 1.80 3.11a.b ± 1.95 3.47b ± 1.80 0.903 0.042*
IMPA 92.50 ± 6.65 93.40 ± 8.53 93.95 ± 6.07 0.369 0.497
I line -2.83a ± 1.84 -3.82a.b ± 2.17 -4.22b ± 1.85 0.584 0.010*
Relationship between incisors
1.1 130.09a ± 7.96 124.88b ± 9.62 125.39b ± 7.79 0.054 0.004*
Overjet 2.66 ± 0.66 2.96 ± 1.22 2.79 ± 0.76 0.225 0.285
Lower incisors linear alterations (1-NB, 1-AP and I Line)
The Japanese-Brazilian sample showed accentu-ated protrusion of lower incisors. Their values were in between those of the Caucasian and Mongoloid samples. It is worth noting that all three linear vari-ables concerning the horizontal position of incisors showed the same behavior, thereby indicating statis-tic similarity between the Japanese-Brazilian and the other samples. Moreover, all variables showed greater protrusion of lower incisors when the Mongoloid were compared to the Caucasian sample.
Miura, Inoue and Suzuki18 also observed great protrusion of Japanese lower incisors in comparison to Caucasian. The results found by Uesato et al,28 En-gel and Spolter,7 Miyajima et al,19 Raddi23 and Taka-hashi25 also demonstrate greater protrusion of lower incisors in Asiatic samples.
Incisors positioning strongly influences the lower third of the face,16,29 specially the lower lip.8,9
It is important to observe that the values found for Japanese-Brazilian sample were in an intermedi-ary rank in relation to the Mongoloid and Caucasian samples. This fact may be caused by the miscegena-tion of this group, since these results were similar for all three variables.
Upper and lower incisors angular relationships (1.1 and Overbite)
These variables were expected to present statisti-cally significant differences, since some dental vari-ables of the Japanese-Brazilian sample were numeri-cally different from the Caucasian and Mongoloid samples (Table 3).
Variable 1.1 (interincisors angle) in the Japanese-Brazilian sample exhibited lower values than in the Caucasian sample and was similar to the Mongoloid sample, thus representing greater vestibular inclina-tion of incisors among Japanese-Brazilian and Mon-goloid, which corroborates the findings of Miura, Inoue and Suzuki18.
Values found for overbite also suggest vestibular inclination: the Caucasian sample presented greater overbite than Japanese-Brazilian and Mongoloid samples, which is in agreement with Engel and Spol-ter’s7 studies. This may be explained by the fact that greater buccal inclination of incisors reduces vertical
trespass, which was also observed by Iwasawa, Moro and Nakamura.14
Both interincisors angle and overbite are deeply connected to the angular position of upper and low-er incisors.15,20 Thus, it is possible to affirm that this characteristic was the determining factor for variable 1.1 to present smaller values than the Caucasian sam-ple, thereby reinforcing the understanding of a more vestibular inclination of lower incisors.15 Addition-ally, it is possible to suggest that this vestibular incli-nation influenced overbite results.15,20
General considerations
The results yielded by orthodontic treatment in contemporary society not only have to establish a functional and balanced occlusion, but also have to provide pleasant facial esthetics.17
Therefore, the expectation of producing facial im-provements as a result of tooth movement remains evident, since there is an intimate connection be-tween labial posture and subjacent structures such as the teeth and the alveolar process.
Accepting that environmental influences play an important role in orthodontic treatment and its es-thetic results is critical to understand the value and necessity of individualized orthodontic treatment as well as the study of specific norms concerning ethnic groups from different backgrounds.
Considering the anthropological differences of fa-cial and dental patterns, Miura, Inoue and Suzuki18 compared a Mongoloid sample with the values of Steiner’s analysis. The authors concluded that treat-ment objectives set for Japanese must be different from those set for Caucasians.18
Miura, Inoue and Suzuki18 assert that results pro-duced by orthodontic treatment performed in Japa-nese patients will not be more functional, stable or desirable if we use smaller values for the variables ANB, 1.NA, 1-NA, 1.NB and 1-NB, as advocated by Steiner for American patients.
Since the mean values change according to the sample and depend on the locality of the study, we would agree that individualized values are more ap-plicable. After all, different ethnic groups need differ-ent cephalometric patterns.
In general, we may say that the most important fac-tor clinically exhibited by young Japanese-Brazilian in this study is the greater buccal inclination and protru-sion of incisors. This aspect must be considered when choosing a treatment protocol. Bearing in mind that this ethnic group frequently presents protrusion and crowding,it is necessary to take into account the limi-tation of these patients in relation to the amount of in-cisor retraction.
Furthermore, oral muscles are strong enough to cause treatment relapse. Even the position of lips in-fluences incisors stability and alignment.
Therefore, the decisions about the need for ex-tractions and type of mechanics should be made on the basis of these circumstances.21 In case of doubt, it is essential to consider that, to this group, it is more adequate to place lower incisors in a more anterior position, which reduces the indication of extractions in borderline cases. In those cases, only interproximal wear would be able to provide dental alignment.
Therefore, in addition to considering patient’s needs, the orthodontist should also know the values of normal-ity for Japanese-Brazilian patients in order to choose the best treatment plan. In clinical terms, we can apply the same principles when selecting pre-adjusted brackets for Class I and II malocclusions cases. In other words, it is possible to apply the results of interincisors angle and overbite found in this research in order to choose the most adequate orthodontic accessories. Brackets used to correct Class I and Class II malocclusion exert greater
buccal inclination on lower incisors, whereas those used to correct Class III malocclusion exert greater buccal in-clination on upper incisors.3
Therefore, a combination of these diferent prescrip-tions would allow greater upper and lower buccal tip-ping and, as a result, could ofer more satisfactory es-thetic outcomes, in addition to increasing case stability.
In short, based on the results of this study, the objectives of orthodontic treatment conducted with Japanese-Brazilian patients (Mongoloid and Cau-casian descendent), must be different from those of Caucasian Brazilian patients.
According to the literature, the use of specific and individualized patterns helps to achieve treat-ment stability18 and adequacy of bone, dental and tegumentary structures.18,19
Applying these variables to Japanese-Brazilian born in Brazil allows us to provide more stable and esthetic results. Last but not least, the study by Miyajimaet al19 reveals the rebirth of an ethnic pride, particularly in large urban centers. Furthermore, there is a growing demand for exclusive orthodontic treatment based on patterns directed towards speciic ethnic groups.13
CONCLUSIONS
Based on the methodology applied and on the re-sults of this research, it is possible to conclude that the sample of Japanese-Brazilian presents:
1. Smaller values for interincisors angle and overbite in relation to the Caucasian sample, but close to Mongoloid values.
1. Andrews LF. The six keys to normal occlusion. Am J Orthod. 1972;62(3):296-309. 2. Angle EH. Classification of malocclusion. Dent Cosmos. 1899;41;248-64;
350-357.
3. Capelozza Filho L, Silva Filho O, Ozawa T, Cavassan A. Individualização de braquetes na técnica de straight-wire: revisão de conceitos e sugestão de indicações para uso. Rev Dental Press Ortod Ortop Facial. 1999;4(4):87-106. 4. Ceylan I, Baydas B, Bolukbasi B. Longitudinal cephalometric changes in incisor
position, overjet, and overbite between 10 and 14 years of age. Angle Orthod. 2002;72(3):246-50.
5. Cotton WN, Takano WS, Wong WM. The downs analysis applied to three other ethnic groups. Angle Orthod. 1951;21(4):213-20.
6. Downs WB. Variations in facial relationship: their significance in treatment and prognosis. Am J Orthod. 1948;34(10):812-40.
7. Engel G, Spolter BM. Cephalometric and visual norms for a Japanese population. Am J Orthod. 1981;80(1):48-60.
8. Fêo OS, Interlandi S, Martins DR, Almeida RR. Avaliação cefalométrica da inclinação dos lábios e relações com a estrutura dento-esquelética. Estomat Cult. 1971;5(2):166-77.
9. Fernandes TMF. Estudo comparativo do padrão cefalométrico de jovens mestiços nipo-brasileiros: grandezas tegumentares e esqueléticas [dissertação]. Bauru (SP): Universidade de São Paulo; 2009.
10. Hayasaki SM, Henriques JFC, Janson G, Freitas MR. Influence of extraction and nonextraction orthodontic treatment in Japanese-Brazilians with class I and class II division 1 malocclusions. Am J Orthod Dentofacial Orthop. 2005;127(1):30-6. 11. Houston WJ. The analysis of errors in orthodontic measurements. Am J Orthod.
1983;83(5):382-90.
12. Interlandi S. O cefalograma padrão do curso de pós-graduação de Ortodontia da Faculdade de Odontologia da USP. Rev Fac Odontol S Paulo. 1968;6(1):63-74. 13. Ioi H, Nakata S, Nakasima A, Counts AL. Anteroposterior lip positions of the
most-favored Japanese facial profiles. Am J Orthod Dentofacial Orthop. 2005;128(2):206-11.
14. Iwasawa T, Moro T, Nakamura K. Tweed triangle and soft-tissue consideration of Japanese with normal occlusion and good facial profile. Am J Orthod. 1977;72(2):119-27.
15. Ludwig M. A cephalometric analysis of the relationship between facial pattern, interincisal angulation and anterior overbite changes. Angle Orthod. 1967;37(3):194-204.
16. Margolis HI. The axial inclination of the mandibular teeth. Am J Orthod Oral Surg. 1943;29(10):571-94.
REFERENCES
17. Merrifield LL. The profile line as an aid in critically evaluating facial esthetics. Am J Orthod. 1966;52(11):804-22.
18. Miura F, Inoue N, Suzuki K. Cephalometric standards for japanese according to the steiner analysis. Am J Orthod. 1965;51:288-95.
19. Miyajima K, McNamara Jr JA, Kimura T, Murata S, Iizuka T. Craniofacial structure of Japanese and European-American adults with normal occlusions and well-balanced faces. Am J Orthod Dentofacial Orthop. 1996;110(4):431-8. 20. Parker CD, Nanda RS, Currier GF. Skeletal and dental changes associated with
the treatment of deep bite malocclusion. Am J Orthod Dentofacial Orthop. 1995;107(4):382-93.
21. Pepicelli A, Woods M, Briggs C. The mandibular muscles and their importance in orthodontics: a contemporary review. Am J Orthod Dentofacial Orthop. 2005;128(6):774-80.
22. Pinzan A. Estudo cefalométrico longitudinal das medidas SNA, Nperp-A, SNB, SND, Nperp-P, ANB, SN.GoGn, SN.Gn, PoOr.GoMe e BaN.PtGn, em jovens caucasians brasileiros de ambos os sexos, com oclusão normal dos 5 aos 11 anos [tese]. Bauru (SP): Universidade de São Paulo; 1994.
23. Raddi I. Determinação da linha “I” em xantodemas nipo-brasileiros, dos 12 aos 18 anos e 6 meses, com “oclusão normal”. [dissertação]. Bauru (SP): Universidade de São Paulo; 1988.
24. Steiner CC. Cephalometrics for you and me. Am J Orthod. 1953;39(10):729-55. 25. Takahashi R. Padrão cefalométrico FOB-USP para jovens nipo-brasileiros com
oclusão normal [dissertação]. Bauru (SP): Universidade de São Paulo; 1998. 26. Taylor WH, Hitchcock HP. The Alabama analysis. Am J Orthod.
1966;52(4):245-65.
27. Tweed CH. Frankfort Mandibular Incisor Angle (FMIA) in diagnosis treatment planning and prognosis. Angle Orthod. 1954;24(3):121-69.
28. Uesato G, Kinoshita Z, Kawamoto T, Koyama I, Nakanishi Y. Steiner cephalometric norms for Japanese and Japanese-Americans. Am J Orthod. 1978;73(3):321-7.
29. Williams R. The diagnostic line. Am J Orthod. 1969;55(5):458-76. 30. Williamson EH, Caves SA, Edenfield RJ, Morse PK. Cephalometric analysis: