Ventricular Canal of the Mouse
Pavle Vrljicak1,2, Rebecca Cullum1, Eric Xu1, Alex C. Y. Chang3, Elizabeth D. Wederell1, Mikhail Bilenky3, Steven J. M. Jones2,3, Marco A. Marra2,3, Aly Karsan3,4, Pamela A. Hoodless1,2*
1Terry Fox Laboratory, British Columbia Cancer Agency, Vancouver, Canada,2Department of Medical Genetics, University of British Columbia, Vancouver, Canada, 3Michael Smith Genome Sciences Centre, British Columbia Cancer Agency, Vancouver, Canada,4Department of Pathology and Laboratory Medicine, University of British Columbia, Vancouver, Canada
Abstract
Malformations of the cardiovascular system are the most common type of birth defect in humans, frequently affecting the formation of valves and septa. During heart valve and septa formation, cells from the atrio-ventricular canal (AVC) and outflow tract (OFT) regions of the heart undergo an epithelial-to-mesenchymal transformation (EMT) and invade the underlying extracellular matrix to give rise to endocardial cushions. Subsequent maturation of newly formed mesenchyme cells leads to thin stress-resistant leaflets. TWIST1 is a basic helix-loop-helix transcription factor expressed in newly formed mesenchyme cells of the AVC and OFT that has been shown to play roles in cell survival, cell proliferation and differentiation. However, the downstream targets of TWIST1 during heart valve formation remain unclear. To identify genes important for heart valve development downstream of TWIST1, we performed global gene expression profiling of AVC, OFT, atria and ventricles of the embryonic day 10.5 mouse heart by tag-sequencing (Tag-seq). Using this resource we identified a novel set of 939 genes, including 123 regulators of transcription, enriched in the valve forming regions of the heart. We compared these genes to a Tag-seq library from theTwist1null developing valves revealing significant gene expression changes. These changes were consistent with a role of TWIST1 in controlling differentiation of mesenchymal cells following their transformation from endothelium in the mouse. To study the role of TWIST1 at the DNA level we performed chromatin immunoprecipitation and identified novel direct targets of TWIST1 in the developing heart valves. Our findings support a role for TWIST1 in the differentiation of AVC mesenchyme post-EMT in the mouse, and suggest that TWIST1 can exert its function by direct DNA binding to activate valve specific gene expression.
Citation:Vrljicak P, Cullum R, Xu E, Chang ACY, Wederell ED, et al. (2012) Twist1 Transcriptional Targets in the Developing Atrio-Ventricular Canal of the Mouse. PLoS ONE 7(7): e40815. doi:10.1371/journal.pone.0040815
Editor:Fabio Martelli, IRCCS-Policlinico San Donato, Italy
ReceivedAugust 23, 2011;AcceptedJune 15, 2012;PublishedJuly 16, 2012
Copyright:ß2012 Vrljicak et al. This is an open-access article distributed under the terms of the Creative Commons Attribution License, which permits unrestricted use, distribution, and reproduction in any medium, provided the original author and source are credited.
Funding:This research was supported by funding to PH and AK from the Heart and Stroke Foundation of British Columbia and Yukon (www.heartandstroke.bc. ca), and to AK, PH and MM from Genome Canada (www.genomecanada.ca) and Genome British Columbia (www.genomebc.ca). AK, PH and MM are Senior Scholars of the Michael Smith Foundation for Health Research (www.msfhr.org). The funders had no role in study design, data collection and analysis, decision to publish, or preparation of the manuscript.
Competing Interests:The authors have declared that no competing interests exist.
* E-mail: [email protected]
Introduction
The transformation of the heart tube into a four-chambered organ divided by valves and septa is a critical event during mammalian heart development and is required for proper function. Initially, the embryonic heart is a linear tube composed of endocardial and myocardial cell layers separated by an acellular extracellular matrix (ECM) termed the cardiac jelly. During formation of the heart valves and septa, the cardiac jelly, which gives rise to the endocardial cushions [1], begins to accumulate in the region between the atria and ventricles, known as the atrio-ventricular canal (AVC), and the junction between the ventricles and the major arteries, known as the outflow tract (OFT). At around embryonic day (E) 9 in the mouse and day 26 in humans, inductive signals from the myocardium mediated by members of the Notch, Wnt and TGFbpathways activate endocardial cells in these regions to undergo an epithelial-to-mesenchymal transfor-mation (EMT) [2–6]. EMT is a multi-step process in which polarized and adhesive endocardial cells transform into non-polarized and highly motile mesenchyme cells [7]. During EMT,
groups of endocardial cells destined to undergo transformation are first specified and become hypertrophic. These cells then lose polarity markers and intercellular cadherins and adherens junctions. Finally degradation of the basement membrane by matrix metalloproteinases (such as MMP2) and cell delamination driven by reorganization of the cytoskeleton leads to the migration and invasion of EMT-generated cells into the endocardial cushion. After invasion of the ECM, the newly transformed mesenchyme cells proliferate to expand the forming cushions into the lumen [8] and undergo differentiation into fibroblastic valve interstitial cells [9]. Removal of excess mesenchyme cells by apoptosis starts at E12.5 in mice, and patterning of ECM molecules relative to direction of blood flow then turns the endocardial cushions into thin stress-resistant AV valve leaflets and semilunar valve cusps by the first week after birth [10–12].
SNAI2 [14] and b-CATENIN [3]. In addition to their role in heart valve development, these factors are also critical in many embryonic tissues that undergo an EMT (e.g. [15]), and have been implicated in cancer metastatic progression, which involves a type of EMT (e.g. [16–19]).
Twist1, a member of the basic helix-loop-helix (bHLH) family of transcription factors, is highly expressed in the mesenchymal cells of the endocardial cushions of the AVC and OFT, with expression peaking at E10.5 before decreasing at E12.5 [20,21]. Similar to the above factors,Twist1over-expression is associated with enhanced metastasis as it promotes cell survival and cell invasion in transformed cells (e.g. [22]). Research in chick AVC development has suggested a role for TWIST1 in the promotion of proliferation and migration of endocardial cushion cells, coupled with inhibition of their differentiation [23]. Subsequent over-expression studies in mouse confirmed a role for TWIST1 in proliferation and regulation of ECM protein expression [24], indicating that TWIST1 might have a role in endocardial cushion cell maturation post-EMT. Interestingly, research in Twist1 null mice has not revealed an obvious AVC endocardial cushion defect prior to death at about E11 [25] although defects in neural crest cell contribution to the OFT have been reported [26].
Since there may be underlying molecular changes in theTwist1 null AVC that may indicate defects not manifested in the embryo prior to death, in this study, we used tag sequencing (Tag-seq) to identify gene expression changes associated with loss ofTwist1in the AVC. Tag-seq, a type of Digital Gene Expression (DGE) analysis termed elsewhere as SAGE-Seq, is a technique that combines Serial Analysis of Gene Expression (SAGE) with massively parallel sequencing [27] to produce short 21-base sequence tags representing the expressed RNA transcripts. By mapping the sequence tags to transcriptome and genome databases, the originating transcript can be identified. Moreover, since the data is digital, the frequency of a tag can be quantified and compared between genes and tissues. Tag-seq is independent of previous transcript knowledge and can be used for novel gene and transcript variant discovery. We first generated Tag-seq libraries from atria, ventricles, AVC and OFT of the mouse heart at E10.5 and used these libraries to identify a high-confidence AVC- and OFT-enriched gene set containing novel endocardial cushion genes and transcription factors. We then used this set to evaluate changes observed in the AVC ofTwist1mutant embryos by Tag-seq. Our data on the gene expression differences between Twist1 mutant and wild-type AVC at E10.5, coupled with chromatin immunoprecipitation, suggests that TWIST1 plays a critical role in mesenchymal differentiation post-EMT in the mouse, by directly regulating expression of AVC-enriched genes.
Materials and Methods
Ethics Statement
All mice procedures were performed at the animal facility of the British Columbia Cancer Agency according to protocols approved by the University of British Columbia Animal Care Committee and following Canadian Council on Animal Care guidelines.
Tissue Collection
E10.5 embryos (Theiler stage 17) were collected from timed-matings of C57BL/6J females and the hearts were manually dissected using 30KG needles to separate the various regions of the heart. Blood was removed by puncturing the heart chambers and washing the tissue with PBS. All tissue was collected in TRIzol reagent (Invitrogen). Images of dissected heart regions can be found in Figure S1. Tissue from 20 embryos was collected for the
atria and ventricle libraries while tissue from 25 embryos was collected for the AVC and OFT. 8 AVCs were collected from Twist1 null AVC. Tissue for each region was pooled to avoid possible bias due to individual variation and to obtain at least 400 ng of total RNA for Tag-seq library construction. After isolation, RNA quality was assessed using an Agilent Bioanalyzer. Twist1null mice have been described previously [25] and were maintained on an ICR (Taconic Farms) background.
Gene Expression Analysis
Tag-seq libraries were constructed as described [27], using at least 400 ng of DNase I-treated total RNA. Briefly, after double-stranded cDNA synthesis with oligo(dT) beads (Invitrogen), the cDNA was digested with an anchoring restriction enzyme (NlaIII) and ligated to an Illumina specific adapter (Adapter A) containing a recognition site for the Type IIS tagging enzyme MmeI. Following MmeI (New England Biolabs) digestion, which cuts 20-bp from the recognition site, a second Illumina adapter (Adapter B) that contains a 2-bp degenerate 39overhang was ligated. Tags flanked by both adapters were enriched by PCR, and the PCR products were run on a 12% PAGE gel, excised and purified. Cluster generation and sequencing was performed on the Illumina cluster station and analyzer (Illumina) following the manufactur-er’s instructions. Raw sequences were extracted from the resulting image files using Bustard 1.8.28 and processed with ELAND (Illumina). Reads were assessed for quality using the Chastity filter (Illumina) with a threshold of 0.6. The tags were generated based on the first 21 bases of each read, which corresponds to the transcript-derived tag sequence. The first 4 bases are always the NlaIII site. The Tag-seq data is available at Gene Expression Omnibus [28] through the accession number GSE37746.
Tag-seq data was analyzed and mapped to genes using DiscoverySpace v4.0 [29]. Background tags, tags that could not be mapped to the genome, and those that contained 1-bp mismatch from tags generated from highly expressed genes were excluded. For all analysis, we selected tag-types with greater than 5 tags per library (tags with 5 or fewer counts in a library were considered not expressed) and used only unambiguous sense mappings based on the RefSeq database (http://www.ncbi.nlm. nih.gov/RefSeq/). All tags representing a single gene were summed into an overall expression count to account for transcript variants. All tag counts were normalized to library size and values represented as tags per million. Differential expression analysis was done using the Bioconductor package edgeR [30–32] using the exact test in the package to calculate the fold changes and p-values based on a dispersion value of 0.12. Gene Ontology analysis was performed with DAVID [33,34]. Enrichment was calculated against the whole RefSeq database as a background group and p-values were generated to represent one-tail Fisher Exact Test statistics.
Reverse transcription followed by quantitative PCR (RT-qPCR) andin situhybridization was described previously [35]. Primers for qPCR and generation ofin situhybridization probes are found in Table S1. Periostin and Tbx20 probes were described previously [36,37].
Chromatin Immunoprecipitation
minutes in ChIP cell lysis buffer (10 mM Tris–HCl, pH 8.0, 10 mM NaCl, 3 mM MgCl2, 0.5% NP-40) followed by resuspen-sion in ChIP nuclear lysis buffer (1% SDS, 5 mM EDTA, 50 mM Tris–HCl, pH 8.1). After 30 minutes on ice, cells were sonicated on ice-water (S3000 Ultrasonic Cell Disruptor Processor, Fisher) for 20 cycles of 30 seconds on, 30 seconds off. After removal of cellular debris by centrifugation, chromatin was precleared with Protein A/G UltraLink Resin (20ml, ThermoFisher 53135) in fresh ChIP dilution buffer (0.01% SDS, 1.1% Triton X-100, 167 mM NaCl, 16.7 mM Tris–HCl, pH 8.1). Beads were spun down and removed and 3mg of antibody was added to
supernatants containing the sonicated DNA. All buffers contained protease inhibitor cocktail tablets (Roche). Following overnight incubation at 4uC, samples were incubated with fresh Protein A/G beads for 4 h rotating at 4uC. The chromatin-bound beads were precipitated and washed in low salt buffer (0.1% SDS, 1% Triton X-100, 2 mM EDTA, 20 mM Tris–HCl, pH 8.1, 150 mM NaCl), high salt buffer (low salt buffer with 500 mM NaCl), lithium chloride buffer (0.25 M LiCl, 1% NP-40, 1% deoxycholate, 1 mM EDTA, 10 mM Tris–HCl, pH 8.1) and twice with TE buffer. Antibody-chromatin complexes were eluted twice from the beads with 125ml elution buffer (1% SDS, 0.1 M NaHCO3) each time. The collected samples were incubated with 1.0ml Proteinase K (20 mg/ml) (Invitrogen) and 2.5ml RNaseA (10 mg/ml Invitro-gen) overnight at 65uC to reverse cross-link. Chromatin was purified by phenol–chloroform extraction and ethanol precipita-tion and resuspended in 50ml dH2O.
For ChIP-seq, DNA from three pooled ChIP samples (from 49, 107 and 85 whole hearts corresponding to 16.2mg, 54.5mg and
33.5mg of chromatin respectively) was purified by SDS–PAGE to obtain 100–300 bp fragments for sequencing on Illumina 1G. Input DNA from the same E10.5 heart tissue was purified and sequenced for a control library. Sequences were mapped to NCBI Build 36 (mm9) reference mouse genome using Burrows-Wheeler-Aligner (BWA) v0.5.x [39]. Peaks were identified using FindPeaks 3.1 [40]. To identify TWIST1 binding sites, peaks were thresholded at a minimum peak height of 10 based on a false discovery rate of 0.01. To further limit false positives, for each peak that passed the FDR threshold, the coverage of the peak was compared to that of the control sample in the region+/2400 bp. Two criteria were set: the local z-score (calculated for each peak based on the peak height and the control coverage) had to be greater than 1.8, and the fold change between the TWIST1 peak and the control peak had to be greater than 1.75.
For ChIP-qPCR, the fold enrichment of each target site was calculated as 2 to the power of the cycle threshold (cT) difference between the IgG immunoprecipitated sample and the TWIST1 immunoprecipitated sample. Primers used for ChIP-qPCR are listed in Table S1.
Results
AVC and OFT Share Significant Gene Expression
Since expression of Twist1 is spatially restricted to the endocardial cushions in both the AVC and OFT of the developing heart, we first assessed the diversity of genes that are normally enriched in the AVC and OFT. We constructed Tag-seq gene expression libraries from the atria, ventricles, AVC and OFT of E10.5 mouse hearts (Table 1). Each library was sequenced to a minimum depth of 7 million tags for a total of over 34 million tags. To exclude very low abundance transcripts and tags that might have been generated by library construction or sequencing errors, we only included tags that were represented more than 5 times in a library. The high quality tags corresponded to 10,670 RefSeq
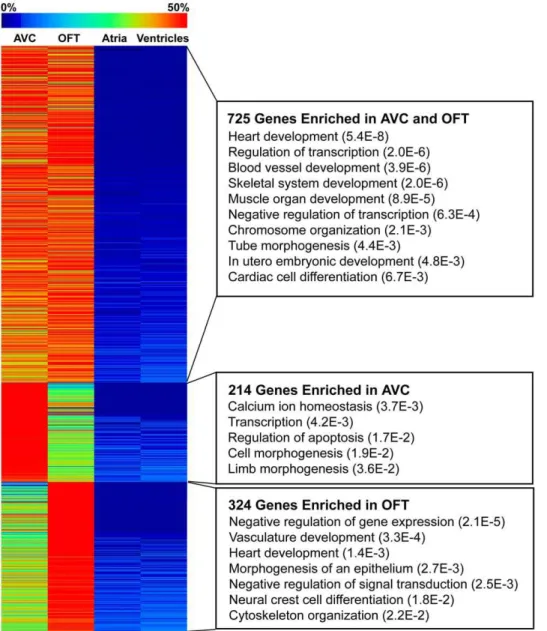
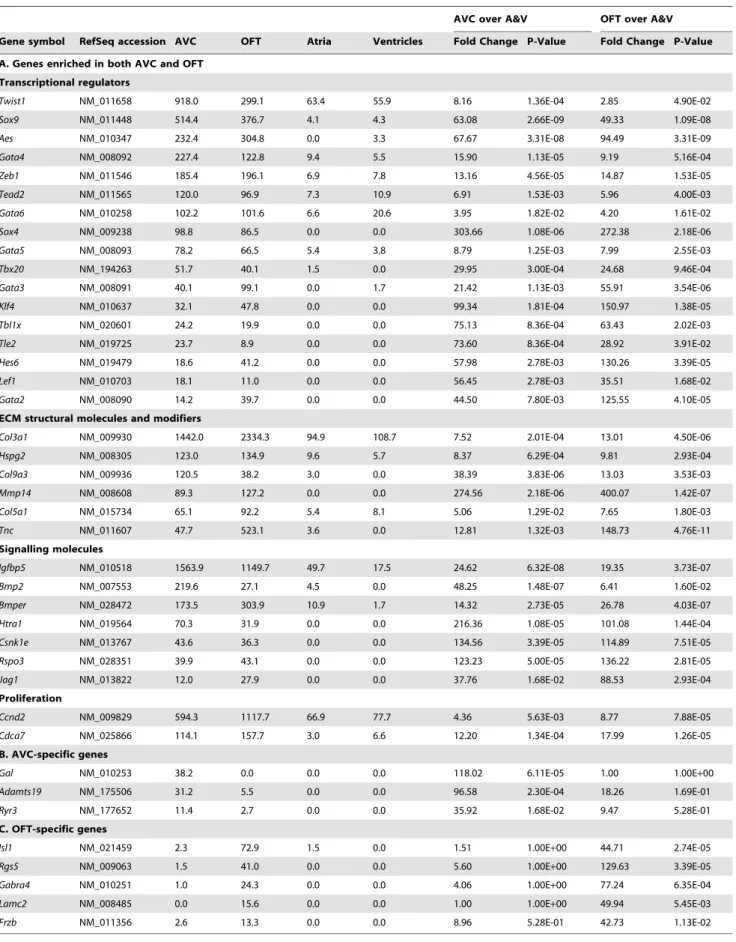
genes expressed (Table S2). We examined 16 genes previously characterized as enriched in the AVC and involved during its development to establish whether our Tag-seq libraries captured known patterns of gene expression (Table S3). Expression of these genes in the AVC Tag-seq library spanned two orders of magnitude ranging from 13 tags per million for the transcription factorSnai2to 1,473 tags per million for the structural molecule Vimentin. Most of the genes we examined were significantly differentially expressed (p-value,0.05) in the AVC when com-pared to the atria and ventricles. Furthermore, AVC enrichment (calculated by edgeR as the normalized fold-change of AVC expression over the atria and ventricle libraries) ranged from just under two-fold forPostn to 303-fold for the transcription factor Sox4, and indicated that the Tag-seq libraries represent a reliable source of gene expression information over a wide dynamic range. Since the AVC and OFT both undergo a similar process of endocardial cushion formation and EMT, we speculated that genes critical for early valve formation would be more highly expressed in these regions as compared to the atria and ventricles. Comparison of the 939 genes enriched in the AVC (p-value,0.05) against the 1049 genes enriched in the OFT (p-value,0.05) revealed that 725 of the genes are common between the two (Figure 1 and Table S4A). Genes with shared AVC and OFT enrichment included known endocardial cushion development genes such asBmp2,Jag1,Gata4, and Sox9. The majority of the genes in our AVC- and OFT-enriched list have not been described in the context of endocardial cushion development. Furthermore, a number of genes specific to the OFT or AVC were also identified, such asGalaninandAdamts19in the AVC andRgs5and Gabra4in the OFT (Table 2, Figure S2, and Tables S4B and S4C). Gene Ontology analysis of the genes enriched in both the AVC and OFT revealed significant enrichment for transcriptional regulation and embryonic developmental processes (Figure 1 and Table S5), which supported our previous finding that at E10.5 there is increased signaling and transcription factor activity [20]. Among the 123 transcriptional regulatory genes enriched in both the AVC and OFT, members of the GATA family (Gata2,3,4,5 and6) were particularly well represented. GATA3, GATA4 and GATA6 have each been shown to play important roles during endocardial cushion development leading to AVC and OFT defects when mutated in mice [41–43]. In contrast, GATA2 and GATA5 have not previously been described in the context of endocardial cushion development. Other transcriptional regula-tors not previously identified in the context of valve and septa formation included Klf4, Zeb1 (an inhibitor and an inducer of EMT, respectively), and Tbl1x (a mediator of Wnt signaling). Importantly, the bHLH transcription factorTwist1was the most highly-expressed, DNA-binding, transcription factor in the AVC at E10.5. As noted above, no AVC phenotype has been reported in theTwist1null mouse.
Twist1Null AVC Shows Dramatic Gene Expression Changes
Table 1.Overview of Tag-seq libraries.
Library ID Description* All Tags HQ Tags** HQ Tag-types
MM0265 E10.5 Atria 8,303,915 4,666,514 35,110
MM0263 E10.5 Atrio-ventricular canal 10,445,112 6,075,421 58,407
MM0266 E10.5 Ventricles 8,284,532 4,223,810 32,822
MM0264 E10.5 Outflow tract 7,072,418 5,267,618 56,744
Total 34,105,977 20,233,363 101,847
MM0513 E10.5Twist12/2Atrio-ventricular canal 17,262,266 12,977,237 79,271
*Atria, atrio-ventricular canal, ventricles and outflow tract were isolated from E10.5 (Theiler stage 17) mouse hearts for Tag-seq library construction. **High quality (HQ) tag-types were present at greater than 5 tags per library.
doi:10.1371/journal.pone.0040815.t001
Figure 1. AVC and OFT shared gene expression.Most genes enriched in the AVC were also enriched in the OFT. The heatmap shows expression levels across E10.5 heart Tag-seq libraries normalized per gene for the overlapping genes with significant enrichment (p-value,0.05) in the AVC and OFT or genes enriched in only AVC or only OFT. Expression of all tag-types mapping in the sense direction to the same RefSeq gene were pooled and all tag counts were normalized as tags per million reads sequenced. Expression fold changes (enrichment) and associated p-values were calculated by doing an exact test using edgeR. Select enriched Gene Ontology (GO) categories are shown with Fisher Exact Test p-values in parentheses. See Table S5 for complete GO analysis results.
Table 2.Selected Genes Enriched in the AVC and/or OFT.
AVC over A&V OFT over A&V
Gene symbol RefSeq accession AVC OFT Atria Ventricles Fold Change P-Value Fold Change P-Value
A. Genes enriched in both AVC and OFT
Transcriptional regulators
Twist1 NM_011658 918.0 299.1 63.4 55.9 8.16 1.36E-04 2.85 4.90E-02
Sox9 NM_011448 514.4 376.7 4.1 4.3 63.08 2.66E-09 49.33 1.09E-08
Aes NM_010347 232.4 304.8 0.0 3.3 67.67 3.31E-08 94.49 3.31E-09
Gata4 NM_008092 227.4 122.8 9.4 5.5 15.90 1.13E-05 9.19 5.16E-04
Zeb1 NM_011546 185.4 196.1 6.9 7.8 13.16 4.56E-05 14.87 1.53E-05
Tead2 NM_011565 120.0 96.9 7.3 10.9 6.91 1.53E-03 5.96 4.00E-03
Gata6 NM_010258 102.2 101.6 6.6 20.6 3.95 1.82E-02 4.20 1.61E-02
Sox4 NM_009238 98.8 86.5 0.0 0.0 303.66 1.08E-06 272.38 2.18E-06
Gata5 NM_008093 78.2 66.5 5.4 3.8 8.79 1.25E-03 7.99 2.55E-03
Tbx20 NM_194263 51.7 40.1 1.5 0.0 29.95 3.00E-04 24.68 9.46E-04
Gata3 NM_008091 40.1 99.1 0.0 1.7 21.42 1.13E-03 55.91 3.54E-06
Klf4 NM_010637 32.1 47.8 0.0 0.0 99.34 1.81E-04 150.97 1.38E-05
Tbl1x NM_020601 24.2 19.9 0.0 0.0 75.13 8.36E-04 63.43 2.02E-03
Tle2 NM_019725 23.7 8.9 0.0 0.0 73.60 8.36E-04 28.92 3.91E-02
Hes6 NM_019479 18.6 41.2 0.0 0.0 57.98 2.78E-03 130.26 3.39E-05
Lef1 NM_010703 18.1 11.0 0.0 0.0 56.45 2.78E-03 35.51 1.68E-02
Gata2 NM_008090 14.2 39.7 0.0 0.0 44.50 7.80E-03 125.55 4.10E-05
ECM structural molecules and modifiers
Col3a1 NM_009930 1442.0 2334.3 94.9 108.7 7.52 2.01E-04 13.01 4.50E-06
Hspg2 NM_008305 123.0 134.9 9.6 5.7 8.37 6.29E-04 9.81 2.93E-04
Col9a3 NM_009936 120.5 38.2 3.0 0.0 38.39 3.83E-06 13.03 3.53E-03
Mmp14 NM_008608 89.3 127.2 0.0 0.0 274.56 2.18E-06 400.07 1.42E-07
Col5a1 NM_015734 65.1 92.2 5.4 8.1 5.06 1.29E-02 7.65 1.80E-03
Tnc NM_011607 47.7 523.1 3.6 0.0 12.81 1.32E-03 148.73 4.76E-11
Signalling molecules
Igfbp5 NM_010518 1563.9 1149.7 49.7 17.5 24.62 6.32E-08 19.35 3.73E-07
Bmp2 NM_007553 219.6 27.1 4.5 0.0 48.25 1.48E-07 6.41 1.60E-02
Bmper NM_028472 173.5 303.9 10.9 1.7 14.32 2.73E-05 26.78 4.03E-07
Htra1 NM_019564 70.3 31.9 0.0 0.0 216.36 1.08E-05 101.08 1.44E-04
Csnk1e NM_013767 43.6 36.3 0.0 0.0 134.56 3.39E-05 114.89 7.51E-05
Rspo3 NM_028351 39.9 43.1 0.0 0.0 123.23 5.00E-05 136.22 2.81E-05
Jag1 NM_013822 12.0 27.9 0.0 0.0 37.76 1.68E-02 88.53 2.93E-04
Proliferation
Ccnd2 NM_009829 594.3 1117.7 66.9 77.7 4.36 5.63E-03 8.77 7.88E-05
Cdca7 NM_025866 114.1 157.7 3.0 6.6 12.20 1.34E-04 17.99 1.26E-05
B. AVC-specific genes
Gal NM_010253 38.2 0.0 0.0 0.0 118.02 6.11E-05 1.00 1.00E+00
Adamts19 NM_175506 31.2 5.5 0.0 0.0 96.58 2.30E-04 18.26 1.69E-01
Ryr3 NM_177652 11.4 2.7 0.0 0.0 35.92 1.68E-02 9.47 5.28E-01
C. OFT-specific genes
Isl1 NM_021459 2.3 72.9 1.5 0.0 1.51 1.00E+00 44.71 2.74E-05
Rgs5 NM_009063 1.5 41.0 0.0 0.0 5.60 1.00E+00 129.63 3.39E-05
Gabra4 NM_010251 1.0 24.3 0.0 0.0 4.06 1.00E+00 77.24 6.35E-04
Lamc2 NM_008485 0.0 15.6 0.0 0.0 1.00 1.00E+00 49.94 5.45E-03
Frzb NM_011356 2.6 13.3 0.0 0.0 8.96 5.28E-01 42.73 1.13E-02
Expression levels represent all sense tags for a gene and are shown as tags per million.
genes were enriched in the atria and ventricles libraries (depleted in the wild-type AVC).
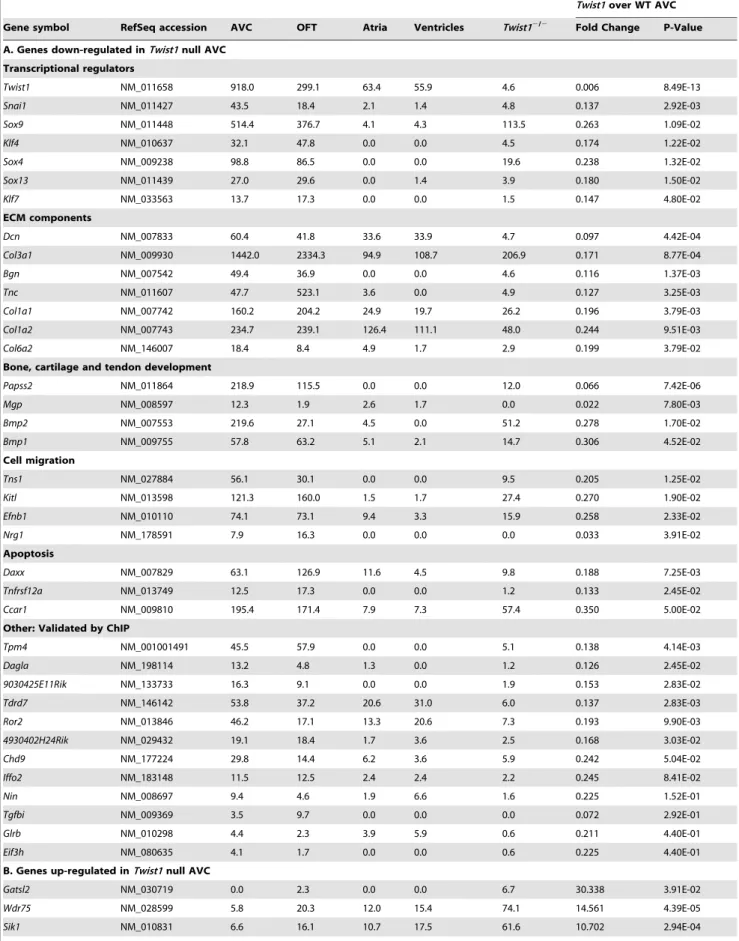
We used Gene Ontology (GO) to further analyze the genes down-regulated in the Twist1null heart (Table 3, Figure 2 and Table S7). Consistent with a proposed role of TWIST1 in ECM remodeling [24], genes down-regulated in the Twist1null AVC were significantly enriched for ECM proteins (p-value = 4.8E-4), such asCol3a1, Col6a2andDecorin. Some of these genes, such as Col1a1, Mgp, Papss2 and Biglycan, are also involved in skeletal system development (also an enriched GO category, p-va-lue = 4.5E24), which is consistent with the known role of TWIST1 in controlling differentiation of bone and cartilage [44,45].Most of these genes were also enriched in the wild-type AVC libraries. Periostin, another ECM protein and a proposed direct target of TWIST1 in osteoblasts [46], was also reduced significantly in the Twist1 null AVC (4.2 fold-change, p-value = 1.1E22). Other targets of TWIST1 suggested in chick endocardial cushion cells [23],Cdh11, Mmp2andTbx20,showed decreased expression levels in the Twist1 null library but the reductions were not significant (Table 3). This suggests that TWIST1 may not be a major regulator of these genes in the mouse AVC and more likely acts as a modulator in combination with other AVC-specific transcription factors.
A critical step in EMT is the acquisition of an invasive phenotype by the newly formed mesenchyme cells. Consistent with a role of TWIST1 in controlling the invasion and cell migration
phenotype following initial transformation, genes down-regulated in theTwist1null AVC included kit ligand(Kitl), the focal adhesion protein Tns1, and the ErbB2/3 ligand Nrg1. During metastatic progression, TWIST1 is thought to prevent the death of newly transformed cells by inhibiting apoptosis [47,48]. In addition to their role in cell migration,KitlandNrg1are negative regulators of apoptosis. Other regulators of apoptosis down-regulated in the Twist1 null AVC library include Daxx, Ccar1, and the tumor necrosis factor receptor superfamily, member 12A (Tnfrsf12a).
Interestingly, several noteworthy transcription factors are down-regulated in the Twist1 null AVC, suggesting that TWIST1 is acting as part of a transcriptional network. Three members of the SRY family of transcription factors,Sox9, Sox4andSox13,are both down-regulated in the Twist1 null library and enriched in the AVC. Zinc finger transcription factors, includingSnai1 and two members of Kruppel-like factor family (Klf4and Klf7), were also down-regulated.Twist1andSnai1are commonly over-expressed in tissues undergoing EMT, have been shown to have genetic interactions in regulating gene expression of ECM proteins (e.g. [49,50]), and their combined mutation enhances abnormal cranial suture fusion [51].
Of the 621 genes that were up-regulated in the Twist1 null AVC, GO analysis indicated that many are involved in metabolism and energy production. These included genes critical in the electron transport chain and many of the essential enzymes in glycolysis (Table S7B).
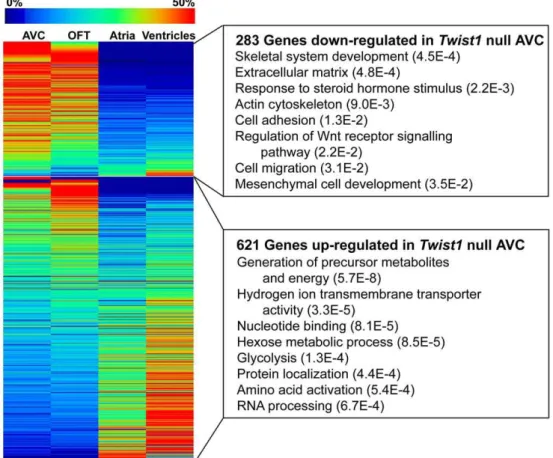
Figure 2. Altered gene expression inTwist1null AVC.Genes significantly down-regulated (p-value,0.05) in theTwist1null AVC are enriched in the wild-type AVC and OFT, while genes up-regulated inTwist1null AVC tend to be enriched in the atria and ventricles. Expression of all tag-types mapping in the sense direction to the same RefSeq gene were pooled and all tag counts were normalized as tags per million reads sequenced. Expression fold changes (enrichment) and associated p-values were calculated by doing an exact test using edgeR. Select enriched Gene Ontology (GO) categories are shown with Fisher Exact Test p-values in parentheses. See Table S7 for complete GO results.
Table 3.Selected gene expression changes inTwist1null AVC.
Twist1over WT AVC
Gene symbol RefSeq accession AVC OFT Atria Ventricles Twist12/2 Fold Change P-Value
A. Genes down-regulated inTwist1null AVC
Transcriptional regulators
Twist1 NM_011658 918.0 299.1 63.4 55.9 4.6 0.006 8.49E-13
Snai1 NM_011427 43.5 18.4 2.1 1.4 4.8 0.137 2.92E-03
Sox9 NM_011448 514.4 376.7 4.1 4.3 113.5 0.263 1.09E-02
Klf4 NM_010637 32.1 47.8 0.0 0.0 4.5 0.174 1.22E-02
Sox4 NM_009238 98.8 86.5 0.0 0.0 19.6 0.238 1.32E-02
Sox13 NM_011439 27.0 29.6 0.0 1.4 3.9 0.180 1.50E-02
Klf7 NM_033563 13.7 17.3 0.0 0.0 1.5 0.147 4.80E-02
ECM components
Dcn NM_007833 60.4 41.8 33.6 33.9 4.7 0.097 4.42E-04
Col3a1 NM_009930 1442.0 2334.3 94.9 108.7 206.9 0.171 8.77E-04
Bgn NM_007542 49.4 36.9 0.0 0.0 4.6 0.116 1.37E-03
Tnc NM_011607 47.7 523.1 3.6 0.0 4.9 0.127 3.25E-03
Col1a1 NM_007742 160.2 204.2 24.9 19.7 26.2 0.196 3.79E-03
Col1a2 NM_007743 234.7 239.1 126.4 111.1 48.0 0.244 9.51E-03
Col6a2 NM_146007 18.4 8.4 4.9 1.7 2.9 0.199 3.79E-02
Bone, cartilage and tendon development
Papss2 NM_011864 218.9 115.5 0.0 0.0 12.0 0.066 7.42E-06
Mgp NM_008597 12.3 1.9 2.6 1.7 0.0 0.022 7.80E-03
Bmp2 NM_007553 219.6 27.1 4.5 0.0 51.2 0.278 1.70E-02
Bmp1 NM_009755 57.8 63.2 5.1 2.1 14.7 0.306 4.52E-02
Cell migration
Tns1 NM_027884 56.1 30.1 0.0 0.0 9.5 0.205 1.25E-02
Kitl NM_013598 121.3 160.0 1.5 1.7 27.4 0.270 1.90E-02
Efnb1 NM_010110 74.1 73.1 9.4 3.3 15.9 0.258 2.33E-02
Nrg1 NM_178591 7.9 16.3 0.0 0.0 0.0 0.033 3.91E-02
Apoptosis
Daxx NM_007829 63.1 126.9 11.6 4.5 9.8 0.188 7.25E-03
Tnfrsf12a NM_013749 12.5 17.3 0.0 0.0 1.2 0.133 2.45E-02
Ccar1 NM_009810 195.4 171.4 7.9 7.3 57.4 0.350 5.00E-02
Other: Validated by ChIP
Tpm4 NM_001001491 45.5 57.9 0.0 0.0 5.1 0.138 4.14E-03
Dagla NM_198114 13.2 4.8 1.3 0.0 1.2 0.126 2.45E-02
9030425E11Rik NM_133733 16.3 9.1 0.0 0.0 1.9 0.153 2.83E-02
Tdrd7 NM_146142 53.8 37.2 20.6 31.0 6.0 0.137 2.83E-03
Ror2 NM_013846 46.2 17.1 13.3 20.6 7.3 0.193 9.90E-03
4930402H24Rik NM_029432 19.1 18.4 1.7 3.6 2.5 0.168 3.03E-02
Chd9 NM_177224 29.8 14.4 6.2 3.6 5.9 0.242 5.04E-02
Iffo2 NM_183148 11.5 12.5 2.4 2.4 2.2 0.245 8.41E-02
Nin NM_008697 9.4 4.6 1.9 6.6 1.6 0.225 1.52E-01
Tgfbi NM_009369 3.5 9.7 0.0 0.0 0.0 0.072 2.92E-01
Glrb NM_010298 4.4 2.3 3.9 5.9 0.6 0.211 4.40E-01
Eif3h NM_080635 4.1 1.7 0.0 0.0 0.6 0.225 4.40E-01
B. Genes up-regulated inTwist1null AVC
Gatsl2 NM_030719 0.0 2.3 0.0 0.0 6.7 30.338 3.91E-02
Wdr75 NM_028599 5.8 20.3 12.0 15.4 74.1 14.561 4.39E-05
To verify the quality of our expression results, and to study the regional distribution of genes up- and down-regulated in the Twist1null AVC, we examined the expression of selected genes by in situ hybridization analysis (Figure 3). Although the expression domains of the genes were preserved, we found that the ECM molecules Periostin and Biglycan showed a marked drop in expression in the AVC mesenchymal compartment in theTwist1 null embryos. By Tag-seq analysis the normalized fold-changes were established as 4.2 and 8.6-fold lower in the null AVC respectively. Similarly, the RIKEN gene 9030425E11 (a putative orthologue of the tight junction proteinCLMP) was 6.5-fold down-regulated in theTwist1null AVC. The WD repeat containing gene Wdr75was up-regulated in the null AVC as predicted by our Tag-seq data (fold-change of 14.6). In contrast,Tbx20,which showed very little expression change in the Twist1 null AVC Tag-seq library (no fold change in transcript variant 1 and 1.3 down-regulation in transcript variant 2), had no detectable change in gene expression byin situhybridization.
Overall, our gene expression analysis indicates that TWIST1 activity is necessary to establish proper AVC gene expression following EMT.
TWIST1 Directly Regulates AVC Gene Expression
Typically, dimerization of TWIST1 with a ubiquitously expressed bHLH factor (E-protein, such as E12) ensures the DNA-binding domain binds an E-box sequence (39CANNTG5’) [52]. DNA binding usually leads to the activation of gene expression; however, TWIST1 can also act as a negative regulator of gene expression by direct interaction with the basic domain of other bHLHs or by sequestering E-proteins [53,54]. To test whether the gene expression changes observed in theTwist1null AVC were a result of direct binding of TWIST1 to DNA, we performed chromatin immunoprecipitation followed by massively parallel sequencing (ChIP-seq) using anti-TWIST1 antibodies on E10.5 heart tissue. The resulting sequence reads were aligned to the mouse genome to create peaks that identify regions of TWIST1 binding activity, which were compared with peaks generated from an input DNA control from the same tissue (Figure 4). The 9038 (height 10 or greater) TWIST1 ChIP-seq peaks that were absent from the control library were assigned to 9745 different genes using GREAT (great.stanford.edu/). Due to the complexity of the library, in this study, we limited our analysis to peaks with a height of 30 or greater that were associated with genes expressed in the AVC. This focused our analysis on 520 peaks associated with 647 genes. 57 of these genes with high confidence TWIST1 binding sites were differentially expressed in
theTwist1null AVC by Tag-seq (26 were down-regulated, 31 were up-regulated; p-value,0.05; Table S8).
These novel putative targets of TWIST1 represented a variety of functions critical for cell differentiation. For example, the TWIST1 targetChd9is a chromatin modifier and a regulator of transcription, whileEif3his an elongation factor involved in gene translation.Daglais a diacylglycerol lipase involved in neuronal cell proliferation and function. Finally,Iffo2is an intermediate filament and Tgfbi is an ECM component and modifier that causes a postnatal growth defect and increased frequency of tumors when mutated in mice. Up-regulated genes bound by TWIST1 included the two pore channel Tpcn1; the Rho activating protein, Abra, which has been implicated in cardiac hypertrophy [55]; the kinase Sik1;and the uncharacterized genesGatsl2andWdr75.
To confirm our ChIP-seq results, we performed ChIP-qPCR validation on 17 novel TWIST1 binding sites using primers within the ChIP-seq peak regions. We used the known TWIST1 target DNM3osas a positive control (Figure 4B) [56] and the promoter region of Foxa2 as a negative control. We found ChIP-qPCR enrichment for all novel TWIST1 bound regions analyzed as compared to the negative control. Significantly, our novel TWIST1 targets identified in the embryonic heart were also bound by TWIST1 in the developing limb suggesting that they are bound by TWIST1 in several cellular contexts. Taken together these results suggest that TWIST1 plays a critical role in endocardial cushion development, by directly regulating spatially and temporally restricted gene expression.
Discussion
We have used a combination of Tag-seq and ChIP-seq to examine thein vivofunctions of TWIST1 in the E10.5 developing mouse heart valves. By comparing genome-wide analysis of gene expression changes in theTwist1null AVC with spatial expression data in the E10.5 heart, we identified dramatic changes that occur in the AVC in the absence of TWIST1. Furthermore, using ChIP in vivoin the E10.5 heart, we identified 17 novel direct target genes of TWIST1 with expression changes in the Twist1 mutant embryos.
Identification of AVC- and OFT-enriched Genes
In this study, we describe the generation and analysis of five Tag-seq libraries from the atria, ventricles, OFT, and wild-type andTwist1null AVCs of the developing E10.5 mouse heart. These Tag-seq libraries were sequenced to a depth of over 7 million tags per library. Using these Tag-seq libraries we identified 725 genes
Table 3.Cont.
Twist1over WT AVC
Gene symbol RefSeq accession AVC OFT Atria Ventricles Twist12/2 Fold Change P-Value
Abra NM_175456 1.0 11.4 0.0 2.4 8.5 8.164 6.59E-02
Tpcn1 NM_145853 15.6 19.1 1.9 2.1 79.1 5.945 2.42E-03
C. Putative TWIST1 targets from literature (as identified in chick endocardial cushions[23]
Postn NM_015784 144.1 138.6 52.5 32.9 29.0 0.241 1.07E-02
Mmp2 NM_008610 194.2 237.2 26.8 29.6 105.8 0.648 4.03E-01
Cdh11 NM_009866 55.1 33.4 31.1 35.7 33.7 0.729 5.84E-01
Tbx20 variant 1 NM_194263 51.7 40.1 1.5 0.0 43.3 0.996 1.00E+00
Tbx20 variant 2 NM_020496 14.5 14.8 1.3 2.1 9.0 0.743061 7.90E-01
enriched in both the AVC and OFT, which included 123 transcriptional regulators. The majority of AVC-enriched genes overlapped with the OFT-enriched genes, highlighting the shared mechanisms underlying the development of the valves in these two regions. However, there were some notable exceptions of genes enriched in the OFT but not the AVC, and vice versa, indicative
of gene expression differences underlying unique AVC and OFT developmental processes. Although both the AVC and OFT form valves to control blood flow, the OFT is also critical in the formation of the main arteries leaving the left ventricle. Accordingly, Gene Ontology categorization identified vasculature development as enriched in the genes specific to the OFT and not
Figure 3. Regulation of AVC gene expression by TWIST1.A. Gene expression changes inTwist1null AVC by Tag-seq. Expression of all tag-types mapping in the sense direction to the same RefSeq gene were pooled and all tag counts were normalized as tags per million reads sequenced. Expression of9030425E11Rik,Biglycan, andPeriostinare down-regulated inTwist1null AVC.Wdr75expression is up-regulated inTwist1null AVC, while
the AVC. Similarly, enrichment of the category of neural crest cell differentiation highlights the role that neural crest cells play in the development of this tissue. Interestingly, the AVC was significantly enriched for genes involved in calcium ion homeostasis, whereas the OFT was not. The gene expression differences between the AVC and OFT could also reflect differences in timing of cushion formation, the cells populating these regions, or the cardiogenic lineage giving rise to them. For example, the most differentially expressed gene in the OFT was Isl1, a marker of the secondary heart field that contributes cells to the OFT and right ventricle [57], while the most highly AVC-specific gene was Galanin, a neuropeptide known to be expressed in the AVC before becoming restricted to AV-node and AV-rings [58].
The Wnt, TGFband Notch pathways have been shown to be critically involved in controlling endocardial cushion EMT and their activity must be tightly regulated [1,10]. Modulators of these pathways were represented in our AVC- and OFT-enriched gene list (Table 2). Csnk1e, a casein kinase responsible for DISHEV-ELLED phosphorylation, andRspo3, an inhibitor of Wnt receptor internalization, control b-CATENIN dependent transcriptional activation. Among the genes controlling TGFb signalling we identifiedBmper, a secreted factor that directly interacts with BMP ligands, andHtra1, a secreted serine protease that inhibits TGFb
family members by its proteolytic activity. Finally, enriched regulators of the Notch pathway included the bHLH transcription factorHes6, and the Groucho related transcriptional co-repressors Aes and Tle2. The most highly expressed signaling pathway modulator in the AVC and OFT was Igfbp5, which has been shown to promote cartilage anabolism and osteoblast proliferation [59]. This is significant in light of research showing shared gene expression in developing heart valves, cartilage, bone and tendons [60].
Following EMT, newly formed mesenchymal cells undergo proliferation resulting in the expansion of the endocardial cushions. In our list of AVC- and OFT-enriched genes we identified several mediators of cell proliferation such asCcnd2and Cdca7. Mesenchyme cells then undergo further differentiation characterized by expression of complex ECM molecules and matrix metalloproteinases. Previously characterized endocardial cushion ECM and structural proteins such asTenascin C, Perlecan (Hspg2), and several collagens (e.g. Col3a1, Col9a3, and Col5a1) were highly enriched in the AVC and OFT at E10.5. Significantly, our list of AVC- and OFT-enriched genes also contained novel endocardial cushion ECM proteins and modifiers such as the matrix metallopeptidase 14 (Mmp14).
TWIST1 Regulates Gene Expression Patterns in the AVC Twist1was the most highly expressed, DNA-binding, transcrip-tion factor in the E10.5 AVC where its expression is restricted to the mesenchyme cell population [20,21]. Research in chick AVC development suggests a role for TWIST1 in the promotion of proliferation and migration of endocardial cushion cells, together with inhibition of their differentiation [23], while over-expression studies in mice implicated TWIST1 in ECM gene expression in the AVC [24]. However, no obvious morphological differences
were observed in theTwist1null mouse AVC [26]. This apparent lack of AVC phenotype in theTwist1null might reflect a defect in maturation not seen before embryonic lethality at E11. Thus, we analyzed gene expression changes in theTwist1null phenotype by creating a Tag-seq library from the AVC of E10.5Twist1mutant mice.
Comparison of Twist1 null and wild-type AVC gene expression revealed remarkable changes consistent with a role for TWIST1 in determining proper AVC and OFT gene expression. Genes down-regulated in theTwist1null AVC were enriched in the wild-type AVC and OFT, while up-regulated genes were more likely to be enriched in atria and ventricles. This suggested that TWIST1 was directly or indirectly regulating many valve-specific genes, and in the absence of TWIST1, there was a shift in the cellular composition from an AVC phenotype to a more atria and/or ventricle-like pheno-type. Genes down-regulated in the Twist1 null AVC were enriched for cell migration and ECM molecules, while up-regulated genes were enriched in metabolic pathways and energy production. Cell migration is a critical step during EMT as the endocardial cells invade the cardiac jelly and TWIST1 has been associated with both the expression of promigratory genes and the proliferation of newly transformed cells [61]. TWIST1 has also been linked to the maintenance of energy and cell metabolism previously as it suppresses brown fat metabolism in adipose tissue [62]. In this context, over-expression ofTwist1 caused a reduction in mitochondria, while heterozygous Twist1 mice were obesity resistant on a high-fat diet due to an increase in expression of oxidation genes. We observed that genes encoding several subunits for each of NADH dehydrogenase, ubiquinal-cytochrome c reductase, cytochrome c oxidase, and mitochondrial ATP synthase complexes were significantly up-regulated in the Twist1 null AVC. These oxidative genes are critical in the electron transport chain and set up the cells to make ATP. Interestingly, many of the essential enzymes in the 10 reaction pathway of glycolysis, an alternate metabolic pathway used to form ATP, were also up-regulated.
Surprisingly, from the genes previously identified as TWIST1 targets in the chick AVC [23,63] only Periostin, and to a lesser extendCdh11andMmp2, showed expression changes in theTwist1 null AVC. Other members of the bHLH transcription factor family, such as TWIST2 [64], could compensate for lack of TWIST1 activity in the mouse. However,Twist2expression was substantially lower than Twist1 expression and was not signifi-cantly altered in the null AVC.
Critical factors involved in valve development were also affected in the Twist1 null mice. Sox9, Sox4 and Bmp2 were down-regulated significantly. In wild-type mice, Sox9 is ex-pressed, activated and required in the cushions following migration of the endocardial cells into the cardiac jelly in the cushions during EMT [65]. Sox4 is expressed in the endocar-dium equally in both valve forming tissues, while Bmp2 is normally expressed in the myocardium overlying the AVC at this stage of development [66,67]. SOX9 is required for expansion of the precursor cell population early in valve
Figure 4. TWIST1 regulates AVC expression by directly binding to DNA.A. Genomic location of ChIP-seq peaks showing TWIST1 binding sites. ChIP-seq results for TWIST1 (red) and input DNA control (blue) are shown over a selected genomic window. The location of the E-box sequence within the ChIP-seq peak is highlighted. B. TWIST1 binding was confirmed by ChIP-qPCR using primers in Table S1. Enrichment was calculated as 2 to the power of the cycle threshold (cT) difference between the IgG immunoprecipitated sample and the TWIST1 immunoprecipitated sample.DNM3os
was used as a positive control and a region of theFoxa2promoter sequence as a negative control for TWIST1 binding. All enrichment values were normalized to the negative control to account for variability between ChIPs. The mean and standard deviation of the enrichment from three ChIP replicates are shown with the height of the peak established by ChIP-seq.
development and later for proper expression of ECM proteins [13] and SOX4 is required for proper formation of the semilunar valves in the OFT [68]. Prior to cushion formation, BMP2 has two roles: it promotes cardiac jelly formation and it induces the overlying endocardium to undergo EMT [69]. As shown in chick, following EMT, BMP2 induces cell migration, but not proliferation, of mesenchymal cells and induces expression of Periostin, Twist1 and Id1 [70].
Using ChIP-seq we analyzed the ability of TWIST1 to bind to the regulatory sequences of our list of differentially expressed genes and identified a number of novel direct targets of TWIST1. Interestingly, we found that most genes differentially expressed between wild-type and Twist1 null AVC did not have direct TWIST1 DNA-binding sites by seq. However, our ChIP-seq was not saturating and many TWIST1 DNA-binding sites remain to be identified. We focused on high-confidence peaks, thus, further analyses may reveal additional direct targets. Of the 647 genes with TWIST1 bound as indicated by our limited ChIP-seq analysis, we found 57 were significantly mis-regulated in the Twist1null AVC and of these 30 were differentially expressed in the AVC. Genes whose regulatory sequences were bound by TWIST1 could be either up-regulated in the Twist1 null AVC, such asTpcn1andWdr75, or down-regulated, such asTpm4and Chd9. This indicated that TWIST1 can act both as an activator or inhibitor of transcription in the context of AVC development. Importantly, we validated 17 genes as novel direct targets of TWIST1.
Although there were few transcription factors identified here with evidence of TWIST1 binding and mis-regulation in the Twist1null AVC, changes in gene expression suggested that the lack of TWIST1 markedly changed the cells during development. It is evident by Tag-seq data that TWIST1 regulates expression of several critically important transcription factors in the AVC and is a central player in regulating AVC transcriptional networks.
Supporting Information
Figure S1 Dissection of E10.5 mouse heart. E10.5 embryos were removed from pregnant females and their hearts were dissected using 18KG needles. Atria, ventricles, atrio-ventricular canals, and out-flow tracts were separated and collected in TRIzol reagent. The out-flow tract protrudes from the front of the heart and is outlined by the yellow dotted line. The red dotted line indicates the region collected as atrio-ventricular canal.
(DOC)
Figure S2 RT-qPCR validation of AVC- and
OFT-specific gene expression. Tag-seq expression values for
Galanin, Adamts19, Isl1, Rgs5, and Gabra4were validated by RT-qPCR across the atria, ventricles, atrio-ventricular canal (AVC), and out-flow tract (OFT). Graphs show relative quantification compared to ß-actin. Results are represented as average values from three independent samples6standard deviations.
(DOC)
Table S1 PCR Primers.All primers used for PCR are listed. These include those used for in situ hybridization probe construction as shown in Figure 3, the ChIP-qPCR as shown in Figure 4 and the RT-qPCR as shown in Figure S2.
(XLS)
Table S2 Gene expression of all genes in E10.5 heart
Tag-seq libraries.All genes expressed in E10.5 wild-type (atria,
ventricles, atrio-ventricular canal (AVC), and out-flow tract (OFT)) andTwist1null AVC Tag-seq libraries. All expression values are
represented as tags per million and only genes with more than 5 raw tags were considered expressed.
(XLS)
Table S3 Expression of genes previously characterized
in AVC development.16 genes previously identified as involved
in AVC development were analyzed for AVC expression. The majority of these genes showed AVC enrichment. Expression values are listed for each library including theTwist1null AVC and are represented as tags per million. Only genes with more than 5 raw tags were considered expressed. Fold changes and p-values are provided as calculated by edgeR as the normalized fold-change of AVC expression over the atria and ventricle libraries. (XLS)
Table S4 Genes significantly enriched in the AVC and OFT.Genes enriched in both the AVC and OFT (725 genes in Table S4A), just the AVC (214 genes in Table S4B) or just the OFT (324 genes in Table S4C) are listed. A heat-map of the data is shown in Figure 1. Expression values are listed for each library including theTwist1 null AVC and are represented as tags per million. Only genes with more than 5 raw tags were considered expressed. Fold changes and p-values are provided as calculated by edgeR as the normalized fold-change of AVC expression or OFT expression over the atria and ventricle libraries. Genes were considered enriched if the p-value was less than 0.05 but no fold change cut-off was used.
(XLS)
Table S5 Enriched Gene Ontology biological process
categories in genes enriched in the AVC and OFT.Gene
Ontology (GO) analysis identified categories enriched in the 725 genes enriched in both the AVC and OFT (Table S5A), the 214 genes enriched in the AVC but not the OFT (Table S5B), and the 324 genes enriched in the OFT but not the AVC (Table S5C). GO analysis was done in DAVID: enrichment was calculated against the whole RefSeq database as background and p-values represent one-tail Fisher Exact Test statistics. Category titles, the number of genes represented in each category (count), the p-values and the Benjamini corrected p-values are provided for each category in addition to the list of genes in that category and the expression data. Only relevant and non-redundant categories were included in the table. Gene expression values are listed for each library including theTwist1 null AVC and are represented as tags per million. Only genes with more than 5 raw tags were considered expressed. Fold changes and p-values are provided as calculated by edgeR as the normalized fold-change of AVC expression or OFT expression over the atria and ventricle libraries.
(XLS)
Table S6 Altered gene expression in the Twist1 null
AVC.Table S6A identifies the 283 genes down-regulated in the Twist1null AVC library while Table S6B identifies the 621 genes up-regulated in theTwist1null AVC library. A heat-map of the data is shown in Figure 2. Expression values are listed as tags per million for each library and only genes with more than 5 raw tags were considered expressed. Fold changes and p-values are provided as calculated by edgeR as the normalized fold-change of Twist1null AVC over wild-type (WT) AVC expression. Also included are AVC and OFT fold changes and p-values. Genes were considered up- or down-regulated if the p-value was less than 0.05 but no fold change cut-off was used.
(XLS)
Table S7 Enriched Gene Ontology biological process
categories in genes with altered expression in theTwist1
621 genes up-regulated (Table S7B) in the Twist1null AVC, we identified enriched GO categories by using DAVID. Enrichment was calculated against the whole RefSeq database as background and p-values represent one-tail Fisher Exact Test statistics. Category titles, the number of genes represented in each category (count), the p-values and the Benjamini corrected p-values are provided for each category in addition to the list of genes in that category and the expression data. Only relevant and non-redundant categories were included in the table. Expression values are listed as tags per million for each library and only genes with more than 5 raw tags were considered expressed. Fold changes and p-values are provided as calculated by edgeR as the normalized fold-change of the Twist1null AVC over wild-type (WT) AVC. Also included are AVC and OFT fold changes and p-values.
(XLS)
Table S8 Genes significantly differentially expressed in theTwist1null AVC with high confidence TWIST1
ChIP-seq peaks.Genes with a TWIST1 ChIP-seq peak of height 30 or
more were compared to genes differentially expressed in the Twist1null AVC. 26 genes were down-regulated (Table S8A) and 31 were up-regulated (Table S8B) and had at least one TWIST1 peak. Peaks were associated with genes using GREAT and the
genomic location of the peaks and the peak heights are listed. Expression values are listed as tags per million for each library and only genes with more than 5 raw tags were considered expressed. Fold changes and p-values are provided as calculated by edgeR as the normalized fold-change of Twist1 null AVC over wild-type (WT) AVC expression. Also included are AVC and OFT fold changes and p-values. Genes were considered up- or down-regulated if the p-value was less than 0.05 but no fold change cut-off was used.
(XLS)
Acknowledgments
The authors would like to acknowledge Canada’s Michael Smith Genome Sciences Centre’s sequencing, bioinformatics, and library construction teams, and Joanne Johnson and Amanda Kotzer for project management. We would like to acknowledge Gordon Robertson for bioinformatics advice throughout the project.
Author Contributions
Conceived and designed the experiments: PV RC MAM PAH. Performed the experiments: PV EX RC EDW. Analyzed the data: PV RC PAH. Contributed reagents/materials/analysis tools: MB SJ. Wrote the paper: PV RC PAH. Contributed useful discussion: ACYC AK.
References
1. Person AD, Klewer SE, Runyan RB (2005) Cell biology of cardiac cushion development. Int Rev Cytology 243: 287–335.
2. Camenisch TD, Molin DG, Person A, Runyan RB, Gittenberger-de Groot AC, et al. (2002) Temporal and distinct TGFbeta ligand requirements during mouse and avian endocardial cushion morphogenesis. Dev Biol 248: 170–181. 3. Liebner S, Cattelino A, Gallini R, Rudini N, Iurlaro M, et al. (2004)
Beta-catenin is required for endothelial-mesenchymal transformation during heart cushion development in the mouse. J Cell Biol 166: 359–367.
4. Timmerman LA, Grego-Bessa J, Raya A, Bertran E, Perez-Pomares JM, et al. (2004) Notch promotes epithelial-mesenchymal transition during cardiac development and oncogenic transformation. Genes Dev 18: 99–115. 5. Watanabe Y, Kokubo H, Miyagawa-Tomita S, Endo M, Igarashi K, et al.
(2006) Activation of Notch1 signaling in cardiogenic mesoderm induces abnormal heart morphogenesis in mouse. Development 133: 1625–1634. 6. Niessen K, Karsan A (2008) Notch signaling in cardiac development. Circ Res
102: 1169–1181.
7. Markwald RR, Fitzharris TP, Smith WN (1975) Sturctural analysis of endocardial cytodifferentiation. Dev Biol 42: 160–180.
8. Shelton EL, Yutzey KE (2007) Tbx20 regulation of endocardial cushion cell proliferation and extracellular matrix gene expression. Dev Biol 302: 376–388. 9. Liu AC, Joag VR, Gotlieb AI (2007) The emerging role of valve interstitial cell phenotypes in regulating heart valve pathobiology. Am J Pathol 171: 1407– 1418.
10. Armstrong EJ, Bischoff J (2004) Heart valve development: endothelial cell signaling and differentiation. Circ Res 95: 459–470.
11. Zhao Z, Rivkees SA (2000) Programmed cell death in the developing heart: regulation by BMP4 and FGF2. Dev Dyn 217: 388–400.
12. Kruithof BP, Krawitz SA, Gaussin V (2007) Atrioventricular valve development during late embryonic and postnatal stages involves condensation and extracellular matrix remodeling. Dev Biol 302: 208–217.
13. Lincoln J, Kist R, Scherer G, Yutzey KE (2007) Sox9 is required for precursor cell expansion and extracellular matrix organization during mouse heart valve development. Dev Biol 305: 120–132.
14. Niessen K, Fu Y, Chang L, Hoodless PA, McFadden D, et al. (2008) Slug is a direct Notch target required for initiation of cardiac cushion cellularization. J Cell Biol 182: 315–325.
15. Murray SA, Oram KF, Gridley T (2007) Multiple functions of Snail family genes during palate development in mice. Development 134: 1789–1797. 16. Olmeda D, Montes A, Moreno-Bueno G, Flores JM, Portillo F, et al. (2008)
Snai1 and Snai2 collaborate on tumor growth and metastasis properties of mouse skin carcinoma cell lines. Oncogene 27: 4690–4701.
17. Chakravarty G, Moroz K, Makridakis NM, Lloyd SA, Galvez SE, et al. (2011) Prognostic significance of cytoplasmic SOX9 in invasive ductal carcinoma and metastatic breast cancer. Exp Biol Med 236: 145–155.
18. Zhou CJ, Guo JQ, Zhu KX, Zhang QH, Pan CR, et al. (2011) Elevated expression of SOX9 is related with the progression of gastric carcinoma. Diagn Cytopathol 39: 105–109.
19. Li J, Zhou BP (2011) Activation of beta-catenin and Akt pathways by Twist are critical for the maintenance of EMT associated cancer stem cell-like characters. BMC Cancer 11: 49.
20. Vrljicak P, Chang AC, Morozova O, Wederell ED, Niessen K, et al. (2010) Genomic analysis distinguishes phases of early development of the mouse atrio-ventricular canal. Physiol Genomics 40: 150–157.
21. Ma L, Lu MF, Schwartz RJ, Martin JF (2005) Bmp2 is essential for cardiac cushion epithelial-mesenchymal transition and myocardial patterning. Develop-ment 132: 5601–5611.
22. Yang J, Mani SA, Donaher JL, Ramaswamy S, Itzykson RA, et al. (2004) Twist, a master regulator of morphogenesis, plays an essential role in tumor metastasis. Cell 117: 927–939.
23. Shelton EL, Yutzey KE (2008) Twist1 function in endocardial cushion cell proliferation, migration, and differentiation during heart valve development. Dev Biol 317: 282–295.
24. Chakraborty S, Wirrig EE, Hinton RB, Merrill WH, Spicer DB, et al. (2010) Twist1 promotes heart valve cell proliferation and extracellular matrix gene expression during development in vivo and is expressed in human diseased aortic valves. Dev Biol 347: 167–179.
25. Chen ZF, Behringer RR (1995) Twist is Required in Head Mesenchyme for Cranial Neural Tube Morphogenesis. Genes Dev 9: 686–699.
26. Vincentz JW, Barnes RM, Rodgers R, Firulli BA, Conway SJ, et al. (2008) An absence of Twist1 results in aberrant cardiac neural crest morphogenesis. Dev Biol 320: 131–139.
27. Morrissy AS, Morin RD, Delaney A, Zeng T, McDonald H, et al. (2009) Next-generation tag sequencing for cancer gene expression profiling. Genome Res 19: 1825–1835.
28. Edgar R, Domrachev M, Lash AE (2002) Gene Expression Omnibus: NCBI gene expression and hybridization array data repository. Nucl Acids Res 30: 207–210.
29. Robertson N, Oveisi-Fordorei M, Zuyderduyn SD, Varhol RJ, Fjell C, et al. (2007) DiscoverySpace: an interactive data analysis application. Genome Biol 8: R6.
30. Robinson MD, McCarthy DJ, Smyth GK (2010) edgeR: a Bioconductor package for differential expression analysis of digital gene expression data. Bioinformatics 26: 139–140.
31. Robinson MD, Smyth GK (2007) Moderated statistical tests for assessing differences in tag abundance. Bioinformatics 23: 2881–2887.
32. Robinson MD, Smyth GK (2008) Small-sample estimation of negative binomial dispersion, with applications to SAGE data. Biostatistics 9: 321–332. 33. Dennis G, Jr, Sherman BT, Hosack DA, Yang J, Gao W, et al. (2003) DAVID:
Database for Annotation, Visualization, and Integrated Discovery. Genome Biol 4: P3.
34. Huang da W, Sherman BT, Lempicki RA (2009) Systematic and integrative analysis of large gene lists using DAVID bioinformatics resources. Nature Protocols 4: 44–57.
35. McKnight KD, Hou J, Hoodless PA (2007) Dynamic expression of thyrotropin-releasing hormone in the mouse definitive endoderm. Dev Dyn 236: 2909–2917. 36. Kraus F, Haenig B, Kispert A (2001) Cloning and expression analysis of the
mouse T-box gene tbx20. Mech Dev 100: 87–91.
38. Wederell ED, Bilenky M, Cullum R, Thiessen N, Dagpinar M, et al. (2008) Global analysis of in vivo Foxa2-binding sites in mouse adult liver using massively parallel sequencing. Nucl Acids Res 36: 4549–4564.
39. Li H, Durbin R (2009) Fast and accurate short read alignment with Burrows-Wheeler transform. Bioinformatics 25: 1754–1760.
40. Fejes AP, Robertson G, Bilenky M, Varhol R, Bainbridge M, et al. (2008) FindPeaks 3.1: a tool for identifying areas of enrichment from massively parallel short-read sequencing technology. Bioinformatics 24: 1729–1730.
41. Crispino JD, Lodish MB, Thurberg BL, Litovsky SH, Collins T, et al. (2001) Proper coronary vascular development and heart morphogenesis depend on interaction of GATA-4 with FOG cofactors. Genes Dev 15: 839–844. 42. Raid R, Krinka D, Bakhoff L, Abdelwahid E, Jokinen E, et al. (2009) Lack of
Gata3 results in conotruncal heart anomalies in mouse. Mech Dev 126: 80–89. 43. Lepore JJ, Mericko PA, Cheng L, Lu MM, Morrisey EE, et al. (2006) GATA-6 regulates semaphorin 3C and is required in cardiac neural crest for cardiovascular morphogenesis. J Clin Invest 116: 929–939.
44. Reinhold MI, Kapadia RM, Liao Z, Naski MC (2006) The Wnt-inducible transcription factor Twist1 inhibits chondrogenesis. J Biol Chem 281: 1381– 1388.
45. Krawchuk D, Weiner SJ, Chen YT, Lu BC, Costantini F, et al. (2010) Twist1 activity thresholds define multiple functions in limb development. Dev Biol 347: 133–146.
46. Oshima A, Tanabe H, Yan T, Lowe GN, Glackin CA, et al. (2002) A novel mechanism for the regulation of osteoblast differentiation: transcription of periostin, a member of the fasciclin I family, is regulated by the bHLH transcription factor, twist. J Cell Biochem 86: 792–804.
47. Feng MY, Wang K, Song HT, Yu HW, Qin Y, et al. (2009) Metastasis-induction and apoptosis-protection by TWIST in gastric cancer cells. Clin Exp Metastasis 26: 1013–1023.
48. Bridges RS, Kass D, Loh K, Glackin C, Borczuk AC, et al. (2009) Gene expression profiling of pulmonary fibrosis identifies Twist1 as an antiapoptotic molecular "rectifier" of growth factor signaling. Am J Pathol 175: 2351–2361. 49. Takahashi E, Funato N, Higashihori N, Hata Y, Gridley T, et al. (2004) Snail
regulates p21(WAF/CIP1) expression in cooperation with E2A and Twist. Biochem Biophys Res Commun 325: 1136–1144.
50. Yang MH, Chen CL, Chau GY, Chiou SH, Su CW, et al. (2009) Comprehensive analysis of the independent effect of twist and snail in promoting metastasis of hepatocellular carcinoma. Hepatology 50: 1464–1474. 51. Oram KF, Gridley T (2005) Mutations in Snail Family Genes Enhance Craniosynostosis of Twist1 Haplo-insufficient Mice. Genetics 170: 971–974. 52. Laursen KB, Mielke E, Iannaccone P, Fuchtbauer EM (2007) Mechanism of
transcriptional activation by the proto-oncogene Twist1. J Biol Chem 282: 34623–34633.
53. Hamamori Y, Wu HY, Sartorelli V, Kedes L (1997) The basic domain of myogenic basic helix-loop-helix (bHLH) proteins is the novel target for direct inhibition by another bHLH protein, Twist. Mol Cell Biol 17: 6563–6573.
54. Spicer DB, Rhee J, Cheung WL, Lassar AB (1996) Inhibition of myogenic bHLH and MEF2 transcription factors by the bHLH protein Twist. Science 272: 1476–1480.
55. Kuwahara K, Teg Pipes GC, McAnally J, Richardson JA, Hill JA, et al. (2007) Modulation of adverse cardiac remodeling by STARS, a mediator of MEF2 signaling and SRF activity. J Clin Invest 117: 1324–1334.
56. Loebel DA, Tsoi B, Wong N, Tam PP (2005) A conserved noncoding intronic transcript at the mouse Dnm3 locus. Genomics 85: 782–789.
57. Cai CL, Liang X, Shi Y, Chu PH, Pfaff SL, et al. (2003) Isl1 identifies a cardiac progenitor population that proliferates prior to differentiation and contributes a majority of cells to the heart. Dev Cell 5: 877–889.
58. Schweickert A, Deissler K, Britsch S, Albrecht M, Ehmann H, et al. (2008) Left-asymmetric expression of Galanin in the linear heart tube of the mouse embryo is independent of the nodal co-receptor gene cryptic. Dev Dyn 237: 3557–3564. 59. Andress DL, Birnbaum RS (1992) Human osteoblast-derived insulin-like growth factor (IGF) binding protein-5 stimulates osteoblast mitogenesis and potentiates IGF action. J Biol Chem 267: 22467–22472.
60. Chakraborty S, Cheek J, Sakthivel B, Aronow BJ, Yutzey KE (2008) Shared gene expression profiles in developing heart valves and osteoblast progenitor cells. Physiol Genomics 35: 75–85.
61. Combs MD, Yutzey KE (2009) Heart Valve Development. Circ Res 105: 408– 421.
62. Pan D, Fujimoto M, Lopes A, Wang Y-X (2009) Twist-1 is a PPARd-inducible, negative-feedback regulator of PGC-1ain brown fat metabolism. Cell 137: 73– 86.
63. Lee MP, Yutzey KE Twist1 directly regulates genes that promote cell proliferation and migration in developing heart valves. PloS One 6: e29758. 64. Sosic D, Richardson JA, Yu K, Ornitz DM, Olson EN (2003) Twist regulates
cytokine gene expression through a negative feedback loop that represses NF-kappaB activity. Cell 112: 169–180.
65. Akiyama H, Chaboissier M-C, Behringer RR, Rowitch DH, Schedl A, et al. (2004) Essential role of Sox9 in the pathway that controls formation of cardiac valves and septa. Proc Natl Acad Sci USA 101: 6502–6507.
66. Ya J, Schilham MW, de Boer PAJ, Moorman AFM, Clevers H, et al. (1998) Sox4-deficiency syndrome in mice is an animal model for common trunk. Circ Res 83: 986–994.
67. Rivera-Feliciano J, Tabin CJ (2006) Bmp2 instructs cardiac progenitors to form the heart-valve-inducing field. Dev Biol 295: 580–588.
68. Schilham MW, Oosterwegel MA, Moerer P, Ya J, de Boer PAJ, et al. (1996) Defects in cardiac outflow tract formation and pro-B-lymphocyte expansion in mice lacking Sox-4. Nature 380: 711–714.
69. Ma L, Lu M-F, Schwartz RJ, Martin JF (2005) Bmp2 is essential for cardiac cushion epithelial-mesenchymal transition and myocardial patterning. Develop-ment 132: 5601–5611.