Bmi-1 Absence Causes Premature Brain Degeneration
Guangliang Cao1, Minxia Gu1, Min Zhu2, Junying Gao1, Ying Yin2, Charles Marshall3, Ming Xiao1*, Jiong
Ding1, Dengshun Miao2
1Jiangsu Province Key Laboratory of Neurodegeneration, Department of Anatomy, Nanjing Medical University, Nanjing, Jiangsu, People’s Republic of China,2The Research Center for Bone and Stem Cells, Department of Anatomy, Nanjing Medical University, Nanjing, Jiangsu, People’s Republic of China, 3Department of Rehabilitation Sciences, University of Kentucky Center For Excellence in Rural Health, Hazard, Kentucky, United States of America
Abstract
Bmi-1, a polycomb transcriptional repressor, is implicated in cell cycle regulation and cell senescence. Its absence results in generalized astrogliosis and epilepsy during the postnatal development, but the underlying mechanisms are poorly understood. Here, we demonstrate the occurrence of oxidative stress in the brain of four-week-old Bmi-1 null mice. The mice showed various hallmarks of neurodegeneration including synaptic loss, axonal demyelination, reactive gliosis and brain mitochondrial damage. Moreover, astroglial glutamate transporters and glutamine synthetase decreased in the Bmi-1 null hippocampus, which might contribute to the sporadic epileptic-like seizures in these mice. These results indicate that Bmi-1 is required for maintaining endogenous antioxidant defenses in the brain, and its absence subsequently causes premature brain degeneration.
Citation:Cao G, Gu M, Zhu M, Gao J, Yin Y, et al. (2012) Bmi-1 Absence Causes Premature Brain Degeneration. PLoS ONE 7(2): e32015. doi:10.1371/ journal.pone.0032015
Editor:Huaibin Cai, National Institute of Health, United States of America
ReceivedOctober 1, 2011;AcceptedJanuary 17, 2012;PublishedFebruary 20, 2012
Copyright:ß2012 Cao et al. This is an open-access article distributed under the terms of the Creative Commons Attribution License, which permits unrestricted use, distribution, and reproduction in any medium, provided the original author and source are credited.
Funding:This work was supported by grants from the National Nature and Scientific Foundation of China Key Project (No. 30971020 to M. Xiao, No. 30830103 to D. Miao) and the Natural Science Foundation of Jiangsu Educational Department (09KJA310003 to M. Xiao). The funders had no role in study design, data collection and analysis, decision to publish, or preparation of the manuscript.
Competing Interests:The authors have declared that no competing interests exist.
* E-mail: [email protected]
Introduction
Bmi-1 is a member of the Polycomb family of transcriptional repressors. It is implicated in cell cycle regulation and cell senescence by repression of Ink4a/Arf locus, encoding cell cycle regulators p16Ink4a and p19Arf [1,2,3,4,5,6]. Furthermore, a recent study has revealed that Bmi-1 regulates mitochondrial function, reactive oxygen species (ROS) levels and activation of the DNA damage response pathway [7].
In the central nervous system (CNS), Bmi-1 protein is localized within neural stem cells (NSCs), as well as mature neurons and astrocytes, indicating a critical role in brain development and maintenance [8,9,10]. Several in vitro and vivo studies have demonstrated that Bmi-1 regulates NSC proliferation and self-renewal [11,12,13,14,15]. Bmi-1 null (Bmi-12/2) mice exhibit smaller brains with profound defects in cerebellar growth after 2 weeks of age [16]. Moreover, Bmi-12/2mice develop generalized
astrogliosis, progressive ataxia and epilepsy in the first month after birth, but the underlying mechanisms are poorly understood [10,16,17].
The brain is particularly vulnerable to oxidative stress due to its high metabolic rate, high lipid content and limited antioxidant defenses [18,19,20]. Therefore, we propose that absence of Bmi-1 causes brain oxidative stress, which may be a primary mechanism for premature neurodegeneration. In addition, it is known that astrocytes are responsible for modulation of neurotransmitter release and synchronization of neuronal firing [21,22]. Reactive astrocytes accompanied with alterations in glutamate transporters and glutamine synthetase have been observed in the brains of patients with temporal lobe epilepsy and animal models of epilepsy [23,24]. Thus, an additional aim of the present study is to
determine whether there are altered expressions of markers for glutamate uptake and conversion in the brain of Bmi-12/2mice.
Results
Oxidative stress in Bmi-1 null brain
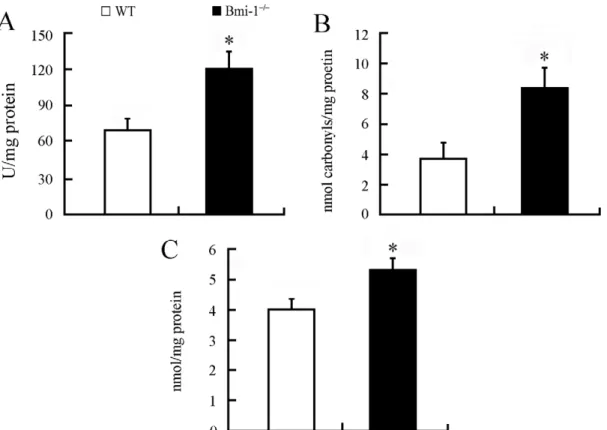
Bmi-1 is implicated in maintaining the redox homeostasis in bone marrow cells and freshly isolated thymocytes [7]. To demonstrate whether deletion of Bmi-1 results in brain oxidative stress, we collected brain homogenate samples of 4-week-old Bmi-12/2 mice and wild-type (WT) controls and measured hydroxyl
radical, protein carbonyl and malondialdehyde levels, markers of oxidative damage in DNA, proteins and lipids, respectively. Our results showed that each oxidative marker increased in the Bmi-1 null brain compared with WT control (Figure 1). Further experiments revealed a significant elevation of hydroxyl radical levels but not protein carbonyl and malondialdehyde in the brain of 2-week-old Bmi-12/2 mice (Figure S1). These results indicate
that oxidative DNA damage is an early event in the pathogenesis of neurodegeneration.
Impairment of neuronal elements in Bmi-1 null hippocampus
in the pyramidal layer compared with WT littermates (Figure 2B). Conversely, immunoreactive levels ofb-tubulin III and synapto-physin were dramatically decreased in the Bmi-1 null hippocam-pus (Figure 2C–D).
Ultrastructural analysis further demonstrated the occurrence of neurodegeneration in the hippocampus of Bmi-12/2 mice.
Swollen or vacuolar mitochondria were present at all neural elements including neuronal somas, dendrites, axonal terminals and astrocyte processes. Most of synapses underwent degeneration (Figure 3B). In addition, microvasculature exhibited considerable dilatation and distortion. Some astrocyte endfeet were highly swollen with large perivascular vacuoles (Figure 3D). These pathological alterations were not observed in WT mice (Figure 3A and C).
Demyelination in Bmi-1 null brain
Oligodendrocytes are also highly sensitive to oxidative stress [25]. The striatum was selected to investigate the influence of Bmi-1 deletion on axonal demyelination. Both toluidine blue histochemistry (Figure 4B) and myelin basic protein (MBP) immunohistochemistry (Figure 4D) revealed that approximately 1/3 of the fiber bundles exhibited vacuolation in the striatum of 4-week-old Bmi-12/2mice (3564.8% vs. 0% in WT mice, n = 5
in each genotype). Electron microscopy further confirmed axonal demyelination accompanied with spongy degeneration in the Bmi-1 null striatum (Figure 4F). These pathological changes were not observed in the striatum of WT littermates (Figure 4A, C and E). Moreover, no vacuolation changes of fiber bundles were detected in the striatum of 2-week-old Bmi-12/2mice, indicating
that the process of demyelination is gradual and progressive (Figure S2).
Reactive gliosis in Bmi-1 null brain
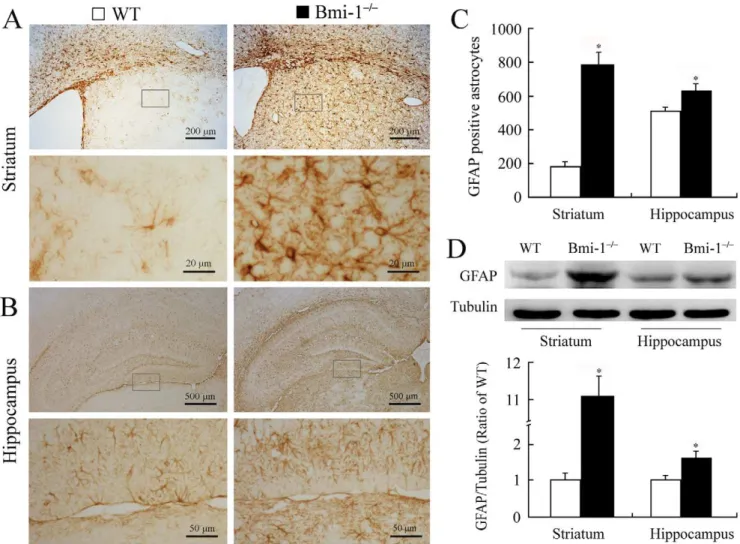
Reactive gliosis is a pathological hallmark in neurodegenerative and demyelinating diseases [22,26,27]. Therefore, we observed activation of astrocytes and microglia in the striatum and hippocampus. Semi-quantitative immunohistochemistry revealed that the number of glial fibrillary acidic protein (GFAP) positive astrocytes significantly increased in the striatum and hippocampus of 4-week-old Bmi-12/2 mice compared with WT controls
(Figure 5A–C). Characterized by hypertrophy of cell bodies and marked upregulation of GFAP expression, a large number of activated astrocytes were observed. Consistently, Western blot analysis revealed increased expression levels of GFAP in the striatum and hippocampus of Bmi-12/2 mice (Figure 5D). Similarly, immunohistochemistry for ionized calcium-binding adapter molecule (Iba-1) showed that activated microglial cells were extensively distributed in the striatum and hippocampus of Bmi-12/2mice, but not WT controls (Figure 6).
Decreased expression of glutamate transporters and glutamine synthetase in Bmi-1 null hippocampus
Bmi-12/2 mice have sporadic epileptic-like seizures and tremors, but the underlying mechanisms need further investigation [16,17]. Emerging evidence reveals a critical role of astrocyte dysfunction, including altered glutamate uptake and conversion in the pathogenesis of epilepsy [23,24]. Thus, we investigated the expression levels of glutamate transporter 1 (GLT-1), glutamate/
Figure 1. Brain oxidative stress in 4-week-old Bmi-12/2mice.Brain tissues from Bmi-12/2mice showed higher levels of hydroxyl radical
(120.82614.72 vs. 69.41610.04 U/mg protein; A), protein carbonyl (8.3761.41 vs. 3.8661.09 nmol/mg protein; B) and malondialdehyde (5.3460.45 vs. 4.0360.41 nmol/mg protein; C) than those from WT controls. Five mice per genotype and 3 independent experiments for each homogenized brain sample. Data are expressed as mean6SEM. *P,0.05 vs. WT mice.
doi:10.1371/journal.pone.0032015.g001
aspartate transporter (GLAST) and glutamine synthetase (GS) in the hippocampus, a key region associated with seizure occurrence in rodents. Four-week-old Bmi-12/2 mice showed decreased
GLT-1, GLAST and GS protein levels, as revealed by both immunohistochemistry (Figure 7A–B) and Western blot analysis (Figure 7C). Supplemental data revealed that these markers were not altered in the hippocampus of 2-week-old Bmi-12/2 mice compared with WT littermates, indicating that glutamate uptake and conversion impairment is due to oxidative stress rather than retardation in astrocyte maturation (Figure S3).
Discussion
Bmi-1 is essential for the maintenance and self-renewal of both hematopoietic and neural stem cells, primarily via the Ink4a locus encoding p16Ink4a/p19Arf [10,11,12,13,14,15,28,29,30,31]. However, deletion of both Ink4a and Arf fails to rescue the growth retardation or improve overall survival of Bmi-12/2 mice,
indicating that additional Bmi-1-regulated pathways may exist [15,32,33]. Furthermore, evidence from recent literature suggests that Bmi-1 is necessary for cellular oxidative metabolism. Liu and colleagues (2009) have demonstrated that Bmi-1 regulates mitochondrial function, ROS levels and the DNA damage response pathway in cultured bone marrow cells and in freshly
isolated thymocytes, independent of the Ink4a/Arf pathway [7]. Treatment with the antioxidant N-acetylcysteine or disruption of the DNA damage response pathway by Chk2 deletion can partially rescue various abnormalities including the neurological defects in Bmi-12/2 mice [7]. Another recent study has also
revealed that Bmi-1 regulates antioxidant defenses in cultured cortical neurons by repressing p53 pro-oxidant activity [8]. The present results have shown that Bmi-1 absence results in brain oxidative damage during the postnatal development. This finding provides insight into the function of Bmi-1 in regulating brain antioxidant defense and controlling of the normal lifespan of brain cells.
Pathological analysis on the hippocampus of 4-week-old Bmi-12/2 mice indicates that deterioration of neurons is more prominent on axonal terminals than cell bodies. This pattern of neuronal degeneration is consistent with the viewpoint that long, extended axons and their synapses seem to be more vulnerable in an oxidative environment due to a high metabolic rate and low antioxidant defenses at synaptic terminals compared with neuronal soma [34]. Oxidative stress also plays a critical role in demyelinating diseases such as multiple sclerosis [25]. We found that absence of Bmi-1 causes extensive demyelination in the striatum at 4 weeks after birth. The widespread degeneration and demyelination leads to severe reactive gliosis, which in turn may
Figure 2. Degeneration of neuronal elements in the hippocampus of 4-week-old Bmi-12/2 mice.(A) Immunostaining for caspase-3,
b-tubulin III and synaptophysin. Arrowheads showing apoptotic pyramidal neurons which contained dense caspase-3 immunostaining. Immunoreactivities ofb-tubulin III and synaptophysin were decreased in the Bmi-1 null hippocampus. (B–D) There were a higher ratio of apoptotic neurons to total neurons (0.03160.004 vs. 0.01960.003; B) and lower mean integrated optical densities (MIOD) of immunostainings forb-tubulin III (0.6660.07 vs. 160.08; C) and synaptophysin (0.7560.08 vs. 160.12; D) in the hippocampus of Bmi-12/2mice compared with WT controls. Five mice
per genotype and 3 sections per mouse. Data are expressed as mean6SEM. *P,0.05 vs. WT mice. doi:10.1371/journal.pone.0032015.g002
produce a large amount of ROS [22]. This vicious cycle exacerbates the Bmi-1 absence-induced oxidative damage.
In contrast to neurons and oligodendrocytes undergoing cellular loss or degeneration, astrocytes exhibit activation and prolifera-tion, termed ‘‘reactive astrogliosis’’, in response to a variety of CNS injuries including oxidative damage [22]. We have demonstrated that reactive astrogliosis occurs in 4-week-old Bmi-12/2 brain and is more serious in the white matter than in the
gray matter. Furthermore, apart from increased GFAP expression, alterations of astrocyte markers including GLT1, GLAST and GS are observed, but these changes have not detected at 2 weeks after birth. These results suggest that reactive astrogliosis is neither an all-or-none response nor a single uniform process. Instead, reactive astrogliosis is a finely gradated continuum of progressive changes in gene expression and cellular morphology [22].
Astrocytes are more resistant to oxidative damage than neurons and oligodendrocytes because they contain a variety of antioxi-dants, vitamins and oxidative defense enzymes [35,36,37]. However, sustained oxidative stress also impairs cellular structures and functions of astrocytes [38]. Glutamate transporters and GS seem to be highly susceptible to oxidative damage [39,40,41]. Decreased expressions of glutamate transporters and GS have been observed in postmortem hippocampal tissues from epile-ptic patients, as well as from animal models of epilepsy [42,43,44,45,46]. Thus, decreased GS, GLT1 and GLAST would hamper glutamate clearance and conversion, subsequently exac-erbating glutamate-mediated neurotoxicity. This may represent a plausible mechanism for sporadic epileptic-like seizures in Bmi-12/2mice.
Additionally, impaired glutamate conversion in astrocyte processes would result in intracellular hyperosmotic pressure, thus drawing additional water into the astrocytes and causing their perivascular endfeet to swell, as demonstrated by electron microscopy. Astrocyte endfeet, one component of the blood-brain barrier, serve as the first line of defense in response to a variety of toxic agents in the blood stream [21]. Highly swollen endfeet may fail to protect the brain parenchyma from toxic substances found in the circulatory system, which in turn exacerbates neuropath-ological impairment in Bmi-12/2brain.
In conclusion, we have demonstrated that the polycomb group protein Bmi-1 is necessary for regulating endogenous antioxidant defenses in the brain, and its absence causes oxidative damage in the premature mouse brain. Bmi-12/2 mice may serve as a suitable model for preclinical evaluation of the neuroprotective efficacy of antioxidant agents.
Materials and Methods
Mice and genotyping
Bmi-1+/2mice (129Ola/FVB/N hybrid background) that were
backcrossed 10–12 times onto a C57BL/6J background were mated to generate 2 or 4-week-old (postnatal 14 or 28-day-old) Bmi-12/2 mice and WT littermates genotyped by PCR, as
described previously [33]. This study was carried out in strict accordance with international standards on animal welfare and the guidelines of the Institute for Laboratory Animal Research of Nanjing Medical University. The protocol was approved by the Committee on the Ethics of Animal Experiments of Nanjing
Figure 3. Ultrastructural alterations of the area CA1 stratum radiatum in 4-week-old Bmi-12/2mice.(A) A representative electron
micrograph showing axonal (Ax)-dendrite (De) synapses (arrowheads) in WT mice. (B) Ultrastructural architecture of synaptic areas in Bmi-12/2mice.
The density of synapses decreased, and the residual synapses underwent degeneration (arrowheads). Many aberrant mitochondria (arrows) exhibited ‘‘zebra-like’’, swollen or vacuolar profile. In addition, the density of microtubules also decreased in the dendritic cytoplasm as compared with that in the WT littermates. (C) A normal brain capillary from WT mice. Note that the capillary wall was surrounded by flattened endfeet of astrocytes (stars). (D) Abnormal architecture of the brain capillary from Bmi-12/2mice. The capillary lumen was narrowed and obstructed accompanied with the
swollen astrocyte endfeet (stars). doi:10.1371/journal.pone.0032015.g003
Medical University (Permit Number: BK2006576). All efforts were made to minimize animal suffering and to reduce the number of animals used.
Preparation of brain sections
The mice were anesthetized with sodium pentobarbital and transcardially perfused with 0.9% saline followed by 1% paraformaldehyde with 1% glutaraldehyde (for conventional electron microscopy) or 4% paraformaldehyde (for histochemistry or immunohistochemistry) in phosphate buffer (PB, 0.1 M, pH 7.4). The brains were dissected and postfixed overnight at 4uC. For electron microscopy, 80mm forebrain or hippocampus cross-sections were sliced via a vibratome. The striatum and CA1 stratum radiatum were trimmed, dehydrated and embedded in Epon 812. Ultrathin sections of 70 nm were obtained, counter-stained on copper grids with both uranyl acetate and lead citrate, and examined with a Jeol 1200EX electron microscope (Tokyo, Japan). For histochemistry or immunohistochemistry, some sections were dehydrated in a series of graded ethanol solutions and embedded in paraffin. Next, the coronal sections of the forebrain or hippocampus were cut to thickness of 5mm and divided into six series. The remaining brain tissues were stored in 30% sucrose solution at 4uC for 48 h, and cut transversely on a freezing microtome at 40mm thickness (Leica, Nussloch, Ger-many). The sections were collected in six series and used for Iba-1 immunostaining.
Toluidine blue staining
Paraffin-bedded forebrain sections were stained in 0.5% toluidine blue for 10 minutes after dewaxing and rehydration. Following a distilled water wash, the sections were dehydrated through a graded series of alcohol and vitrificated in xylene.
Immunohistochemical staining
The protocol for immunohistochemisty was as described previously [47]. Briefly, sections were incubated with the primary antibody as following: mouse anti-GFAP (1:1500, Sigma-Aldrich, Saint Louis, MO, USA), rabbit anti-caspase-3 (1:1500, Millipore, Billerica, MA, USA), guinea pig anti-GLT-1 (1:1000, Millipore), guinea pig anti-GLAST (1:1000, Millipore), rabbit anti-GS (1:200, Santa Cruz BioTech, Santa Cruz, CA, USA), rabbit anti-Iba-1 (1:500, Wako, Wako, Osaka, Japan), mouse anti-synaptophysin (1:1200, Sigma-Aldrich) or mouse anti-b-tubulin III (1:2000, Sigma-Aldrich) at 4uC overnight. After rinsing in PBS, the sections were incubated with biotinylated goat anti-rabbit (1:200), mouse (1:200) or guinea pig (1:200) IgG for 1 h at room temperature and visualized using Elite ABC Kit (Vector, Burlingame, CA, USA).
Quantitative analysis of immunostaining
The number of GFAP positive astrocytes per striatum or hippocampus cross-section was counted at a magnification of 6100 using a digital microscope (Leica Microsystems, Wetzlar,
Figure 4. Demyelination in the striatum of 4-week-old Bmi-12/2mice.(A–D) Toluidine blue staining (A–B) and MBP immunohistochemistry
(C–D). Many fiber bundles contained vacuoles (arrowheads) in the striatum of Bmi-12/2mice, but not in WT littermates. (E–F) Ultrastructure of the
myelinated axons in the striatum of WT mice (E) and Bmi-12/2mice (F). Many axons underwent demyelination with stripping of the myelin lamellae
(arrows in F) in Bmi-12/2mice. Some axons even totally degenerated with only empty vacuoles left.
doi:10.1371/journal.pone.0032015.g004
Germany). Three sections per mouse, and five mice per genotype, were averaged to provide a mean value for each group. The number of caspase-3 positive hippocampal neurons was also counted by the same method. In addition, the extent of demyelination within striatum was assessed on coronal sections stained with Toluidine blue or MBP. The ratio of the fiber bundles containing vacuoles to the total fiber bundles per striatum section was analyzed. Finally, the mean integrated optical density (MIOD) was measured to assess the expression levels of synaptophysin,b -tubulin III, GLT-1, GLAST, and GS in the whole hippocampus regions at a magnification of6100, respectively, using an Image-Pro Plus 6.0 Analysis System (Media Cybernetics Inc., San Francisco, CA, USA) [47].
Western blotting
Proteins were extracted from the hippocampus or striatum and quantified with a kit (Bio-Rad, Mississauga, Ontario, Canada). Ten mg protein samples were fractionated by SDS-PAGE and transferred to nitrocellulose membranes. The immunoblotting was carried out as described using antibodies against with GFAP
(1:2000), GLT-1 (1:1000), GLAST (1:1000) and GS (1:200) [47]. The immunocomplexes were visualized using the ECL detection kit (Amersham Pharmacia Biotech, Canada). Membranes were scanned and analyzed using an Omega 16ic Chemiluminescence Imaging System (Ultra-Lum, USA).
Biochemical measurement
The brain tissues were homogenized in cold saline. The homogenate (10%) was centrifuged at 4000rpm at 4uC for 10 min. The supernatant was used for measurements of hydroxyl radical, malondialdehyde and protein carbonyl levels. All examinations were performed according to the manufacturer’s instructions (Jiancheng Institute of Biotechnology, China). The detailed methods have been described in the previously published report [48].
Statistical Analysis
Data are presented as the mean6SEM. Statistical comparisons were made using the Student’s t-test, with a probability value ,0.05 being considered significant.
Figure 5. Reactive astrogliosis in the brain of 4-week-old Bmi-12/2mice.(A–B) Immunostaining for GFAP in the coronal sections of the
striatum and hippocampus. Activated astrocytes with hypertrophic cell bodies and intensely stained processes were present in Bmi-12/2 mice.
(C) Bmi-12/2 mice showed a higher number of GFAP positive astrocytes per coronal section of the striatum (786
672.4 vs. 183628.69) and hippocampus (626638.7 vs. 515622.89) compared with WT controls. Five mice per genotype and 3 sections per mouse. (D) Bmi-12/2mice showed
increases in relative protein expression levels of GFAP in the striatum (11.0960.59 vs. 160.22) and hippocampus (1.6360.22 vs. 160.16) compared with WT controls. Three mice per genotype and 3 independent experiments for each homogenized brain sample. Data are expressed as mean6SEM. *P,0.05 vs. WT mice.
doi:10.1371/journal.pone.0032015.g005
Figure 6. Reactive microgliosis in the hippocampus of 4-week-old Bmi-12/2mice. Compared with WT littermates (A and C), strong
immunostaining for the microglial marker Iba-1 was observed in the hippocampus of Bmi-12/2mice (B and D). Activated microglia with large soma
and thick processes (arrowheads) were present at Bmi-12/2mice (D).
doi:10.1371/journal.pone.0032015.g006
Figure 7. Decreased expression of GLT-1, GLAST and GS in the hippocampus of 4-week-old Bmi-12/2mice.(A–B) Representative
micrographs showing immunoreactivities of GLT-1, GLAST and GS in the dentate gyrus of the two genotype mice. (B) Semi-quantitative analysis showed lower mean integrated optical densities (MIOD) of immunostainings for GLT-1 (0.7160.07 vs. 160.1), GLAST (0.7860.06 vs. 160.07) and GS (0.4760.1 vs. 160.12) in the hippocampus of Bmi-12/2mice compared with WT controls. Five mice per genotype and 3 hippocampal sections per
mouse. (C) Western blotting showed decreases in protein expression levels of GLT-1 (0.5460.06 vs. 160.12), GLAST (0.6560.07 vs. 160.08) and GS (0.5860.1 vs. 160.1) in the hippocampus of Bmi-12/2mice compared with WT controls. Three mice per genotype and 3 independent experiments for
each homogenized brain sample. Data represent means6SEM. *P,0.05; vs. WT mice. doi:10.1371/journal.pone.0032015.g007
Supporting Information
Figure S1 Oxidative parameters in 2-week-old Bmi-12/2 mice and wild-type controls. Brain tissues from Bmi-12/2
mice showed higher levels of hydroxyl radical (93.8267.54 vs. 62.8166.35 U/mg protien; A), protein carbonyl (3.7360.25 vs. 3.4760.22 nmol/mg protein; B) and malondialdehyde (3.2260.25 vs. 2.9960.23 nmol/mg protein; C) than those from WT controls, but the significant difference was only hydroxyl radical levels. Five mice per genotype and 3 independent experiments for each homogenized brain sample. Data are expressed as mean6SEM. *P,0.05 vs. WT mice.
(TIF)
Figure S2 Immunohistochemistry for MBP in the striatum of 2-week-old Bmi-12/2 mice and wild-type controls.(A–D) The distributional pattern of MBP positive fibers bundles within the striatum was similar between the two genotype mice, although MBP immunostaining was weaker in Bmi-12/2 mice.
(TIF)
Figure S3 Expression of GLT-1, GLAST and GS in the hippocampus of 2-week-old Bmi-12/2 mice and wild-type controls.(A) Representative micrographs showing immu-noreactivities of GLT-1, GLAST and GS in the hippocampal CA1
region of the two genotype mice. (B) Semi-quantitative analysis showed that there were no significant differences in the mean integrated optical densities (MIOD) of immunostainings for GLT-1 (0.8860.15 vs. 160.12), GLAST (0.9460.1 vs. 160.11) and GS (1.0460.16 vs. 160.12) in the hippocampus of Bmi-12/2 mice
and WT controls. Five mice per genotype and 3 hippocampal sections per mouse. (C) There were no significant differences in protein expression levels of GLT-1 (0.9460.14 vs. 160.12), GLAST (0.960.15 vs. 160.11) and GS (0.9760.11 vs. 160.07) in the hippocampus of Bmi-12/2mice and WT controls. Three mice
per genotype and 3 independent experiments for each homoge-nized brain sample. Data represent means6SEM. *P,0.05 vs. WT mice.
(TIF)
Acknowledgments
We would like to thank Professor Anton Berns in the Netherlands Cancer Institute for providing Bmi1+/2mice.
Author Contributions
Conceived and designed the experiments: MX. Performed the experi-ments: GC MG MZ. Analyzed the data: JD DM. Contributed reagents/ materials/analysis tools: JG YY. Wrote the paper: MX CM.
References
1. AIkema MJ, Wiegant J, Raap AK, Berns A, van Lohuizen M (1993) Characterization and chromosomal localization of the human proto-oncogene BMI-1. Hum Mol Genet 2: 1597–1603.
2. Bracken AP, Kleine-Kohlbrecher D, Dietrich N, Pasini D, Gargiulo G, et al. (2007) The Polycomb group proteins bind throughout the INK4A-ARF locus and are disassociated in senescent cells. Genes Dev 21: 525–530.
3. Bruggeman SW, Hulsman D, Tanger E, Buckle T, Blom M, et al. (2007) Bmi1 controls tumor development in an Ink4a/Arf-independent manner in a mouse model for glioma. Cancer Cell 12: 328–341.
4. Dimri GP, Martinez JL, Jacobs JJ, Keblusek P, Itahana K, et al. (2002) The Bmi-1 oncogene induces telomerase activity and immortalizes human mammary epithelial cells. Cancer Res 62: 4736–4745.
5. Jacobs JJ, Kieboom K, Marino S, DePinho RA, van Lohuizen M (1999) The oncogene and Polycomb-group gene bmi-1 regulates cell proliferation and senescence through the ink4a locus. Nature 397: 164–168.
6. Oguro H, Iwama A, Morita Y, Kamijo T, van Lohuizen M, et al. (2006) Differential impact of Ink4a and Arf on hematopoietic stem cells and their bone marrow microenvironment in Bmi1-deficient mice. J Exp Med 203: 2247–2253. 7. Liu J, Cao L, Chen J, Song S, Lee IH, et al. (2009) Bmi1 regulates mitochondrial
function and the DNA damage response pathway. Nature 459: 387–392. 8. Chatoo W, Abdouh M, David J, Champagne MP, Ferreira J, et al. (2009) The
polycomb group gene Bmi1 regulates antioxidant defenses in neurons by repressing p53 pro-oxidant activity. J Neurosci 29: 529–542.
9. Hayry V, Tynninen O, Haapasalo HK, Wolfer J, Paulus W, et al. (2008) Stem cell protein BMI-1 is an independent marker for poor prognosis in oligodendroglial tumours. Neuropathol Appl Neurobiol 34: 555–563. 10. Zencak D, Lingbeek M, Kostic C, Tekaya M, Tanger E, et al. (2005) Bmi1 loss
produces an increase in astroglial cells and a decrease in neural stem cell population and proliferation. J Neurosci 25: 5774–5783.
11. Bruggeman SW, Valk-Lingbeek ME, van der Stoop PP, Jacobs JJ, Kieboom K, et al. (2005) Ink4a and Arf differentially affect cell proliferation and neural stem cell self-renewal in Bmi1-deficient mice. Genes Dev 19: 1438–1443. 12. Fasano CA, Phoenix TN, Kokovay E, Lowry N, Elkabetz Y, et al. (2009) Bmi-1
cooperates with Foxg1 to maintain neural stem cell self-renewal in the forebrain. Genes Dev 23: 561–574.
13. He S, Iwashita T, Buchstaller J, Molofsky AV, Thomas D, et al. (2009) Bmi-1 over-expression in neural stem/progenitor cells increases proliferation and neurogenesis in culture but has little effect on these functions in vivo. Dev Biol 328: 257–272.
14. Molofsky AV, He S, Bydon M, Morrison SJ, Pardal R (2005) Bmi-1 promotes neural stem cell self-renewal and neural development but not mouse growth and survival by repressing the p16Ink4a and p19Arf senescence pathways. Genes Dev 19: 1432–1437.
15. Molofsky AV, Pardal R, Iwashita T, Park IK, Clarke MF, et al. (2003) Bmi-1 dependence distinguishes neural stem cell self-renewal from progenitor proliferation. Nature 425: 962–967.
16. van der Lugt NM, Domen J, Linders K, van Roon M, Robanus-Maandag E, et al. (1994) Posterior transformation, neurological abnormalities, and severe
hematopoietic defects in mice with a targeted deletion of the bmi-1 proto-oncogene. Genes Dev 8: 757–769.
17. Leung C, Lingbeek M, Shakhova O, Liu J, Tanger E, et al. (2004) Bmi1 is essential for cerebellar development and is overexpressed in human medullo-blastomas. Nature 428: 337–341.
18. Andersen JK (2004) Oxidative stress in neurodegeneration: cause or conse-quence? Nat Med 5: 18–25.
19. Bishop NA, Lu T, Yankner BA (2010) Neural mechanisms of ageing and cognitive decline. Nature 464: 529–535.
20. Ischiropoulos H, Beckman JS (2003) Oxidative stress and nitration in neurodegeneration: cause, effect, or association? J Clin Invest 111: 163–169. 21. Allen NJ, Barres BA (2009) Neuroscience: Glia - more than just brain glue.
Nature 457: 675–777.
22. Sofroniew MV, Vinters HV (2010) Astrocytes: biology and pathology. Acta Neuropathol 119: 7–35.
23. Binder DK, Steinha¨user C (2006) Functional changes in astroglial cells in epilepsy. Glia 54: 358–368.
24. David Y, Cacheaux LP, Ivens S, Lapilover E, Heinemann U, et al. (2009) Astrocytic dysfunction in epileptogenesis: consequence of altered potassium and glutamate homeostasis? J Neurosci 29: 10588–10599.
25. Gonsette RE (2008) Neurodegeneration in multiple sclerosis: the role of oxidative stress and excitotoxicity. J Neurol Sci 274: 48–53.
26. Napoli I, Neumann H (2009) Microglial clearance function in health and disease. Neuroscience 158: 1030–1038.
27. Stoll G, Jander S (1999) The role of microglia and macrophages in the pathophysiology of the CNS. Prog Neurobiol 58: 233–247.
28. Grinstein E, Mahotka C (2009) Stem cell divisions controlled by the proto-oncogene BMI-1. J Stem Cells 4: 141–146.
29. Iwama A, Oguro H, Negishi M, Kato Y, Morita Y, et al. (2004) Enhanced self-renewal of hematopoietic stem cells mediated by the polycomb gene product Bmi-1. Immunity 21: 843–851.
30. Lessard J, Sauvageau G (2003) Bmi-1 determines the proliferative capacity of normal and leukaemic stem cells. Nature 423: 255–260.
31. Park IK, Qian D, Kiel M, Becker MW, Pihalja M, et al. (2003) Bmi-1 is required for maintenance of adult self-renewing haematopoietic stem cells. Nature 423: 302–305. 32. Fasano CA, Dimos JT, Ivanova NB, Lowry N, Lemischka IR, et al. (2007) shRNA knockdown of Bmi-1 reveals a critical role for p21-Rb pathway in NSC self-renewal during development. Cell Stem Cell 1: 87–99.
33. Zhang HW, Ding J, Jin JL, Guo J, Liu JN, et al. (2010) Defects in mesenchymal stem cell self-renewal and cell fate determination lead to an osteopenic phenotype in Bmi-1 null mice. J Bone Miner Res 25: 640–652.
34. Mattson MP (2004) Pathways towards and away from Alzheimer’s disease. Nature 430: 631–639.
35. Dringen R (2000) Metabolism and functions of glutathione in brain. Prog Neurobiol 62: 649–671.
36. van der Hel WS, Notenboom RG, Bos IW, van Rijen PC, van Veelen CW, et al. (2005) Reduced glutamine synthetase in hippocampal areas with neuron loss in temporal lobe epilepsy. Neurology 64: 326–333.
37. Wilson JX (1997) Antioxidant defense of the brain: a role for astrocytes. Can J Physiol Pharmacol 75: 1149–1163.
38. Seifert G, Schilling K, Steinhauser C (2006) Astrocyte dysfunction in neurological disorders: a molecular perspective. Nat Rev Neurosci 7: 194–206. 39. Butterfield DA, Hensley K, Cole P, Subramaniam R, Aksenov M, et al. (1997) Oxidatively induced structural alteration of glutamine synthetase assessed by analysis of spin label incorporation kinetics: relevance to Alzheimer’s disease. J Neurochem 68: 2451–2457.
40. Castegna A, Aksenov M, Aksenova M, Thongboonkerd V, Klein JB, et al. (2002) Proteomic identification of oxidatively modified proteins in Alzheimer’s disease brain. Part I: creatine kinase BB, glutamine synthase, and ubiquitin carboxy-terminal hydrolase L-1. Free Radic Biol Med 33: 562–571.
41. Li S, Mallory M, Alford M, Tanaka S, Masliah E (1997) Glutamate transporter alterations in Alzheimer disease are possibly associated with abnormal APP expression. J Neuropathol Exp Neurol 56: 901–911.
42. Bjørnsen LP, Eid T, Holmseth S, Danbolt NC, Spencer DD, et al. (2007) Changes in glial glutamate transporters in human epileptogenic hippocampus: inadequate explanation for high extracellular glutamate during seizures. Neurobiol Dis 25: 319–330.
43. Demarque M, Villeneuve N, Manent JB, Becq H, Represa A, et al. (2004) Glutamate transporters prevent the generation of seizures in the developing rat neocortex. J Neurosci 24: 3289–3294.
44. Eid T, Thomas MJ, Spencer DD, Runden-Pran E, Lai JC, et al. (2004) Loss of glutamine synthetase in the human epileptogenic hippocampus: possible mechanism for raised extracellular glutamate in mesial temporal lobe epilepsy. Lancet 363: 28–37.
45. Samuelsson C, Kumlien E, Flink R, Lindholm D, Ronne-Engstrom E (2000) Decreased cortical levels of astrocytic glutamate transport protein GLT-1 in a rat model of posttraumatic epilepsy. Neurosci Lett 289: 185–188.
46. Wong M, Ess KC, Uhlmann EJ, Jansen LA, Li W, et al. (2003) Impaired glial glutamate transport in a mouse tuberous sclerosis epilepsy model. Ann Neurol 54: 251–256.
47. Liu L, Su Y, Yang W, Xiao M, Gao J, et al. (2010) Disruption of neuronal-glial-vascular units in the hippocampus of ovariectomized mice injected with D-galactose. Neuroscience 169: 596–608.
48. Shin EJ, Suh SK, Lim YK, Jhoo WK, Hjelle OP, et al. (2005) Ascorbate attenuates trimethyltin-induced oxidative burden and neuronal degeneration in the rat hippocampus by maintaining glutathione homeostasis. Neuroscience 133: 715–727.