RNAi-mediated silencing of the
Bmi-1
gene causes growth inhibition
and enhances doxorubicin-induced apoptosis in MCF-7 cells
Xiang-mei Wu
1, Xing Liu
2, You-quan Bu
1, Joyeeta Sengupta
1, Hong-juan Cui
3, Fa-ping Yi
1,
Tao Liu
1, Chen-fu Yuan
1, Yan-yan Shi
1and Fang-zhou Song
11
Department of Biochemistry and Molecular Biology, Chongqing Medical University, Chongqing, PR China.
2Department of Pediatric Urology, Chongqing Children’s Hospital, Chongqing Medical University,
Chongqing, PR China.
3Department of Biochemistry and Cancer Biology, Medical University of Ohio, Ohio, USA.
Abstract
The oncogeneBmi-1 is a member of the Polycomb group gene family. Its expression is found to be greatly increased in a number of malignant tumors including breast cancer. This could suggest Bmi-1 as a potent therapeutic target. In
this study, RNAi was introduced to down-regulate the expression ofBmi-1 in a highly malignant breast
adeno-carcinoma cell line, MCF-7. A thorough study of the biological behavior and chemosensitivity changes of the MCF-7 cells was carried out in context to the therapeutic potential of Bmi-1. The results obtained indicated that siRNA target-ing ofBmi-1 could lead to an efficient and specific inhibition of endogenous Bmi-1 activity. The mRNA and protein
ex-pression ofBmi-1 were determined by RT-PCR and Western blot, respectively. Furthermore, silencing of Bmi-1
resulted in a drastic inhibition of the growth of MCF-7 cells as well as G1/S phase transition. The number of target cells
was found to increase in phase G0/G1and decrease in the S phase, but no increase in the basal level of apoptosis
was noticed. On the other hand, a reduction in the expression of cyclin D1 and an increase in the expression of p21
were also noticed. Silencing of Bmi-1 made the MCF-7 cells more sensitive to the chemotherapeutic agent
doxorubicin and induced a significantly higher percentage of apoptotic cells. Here, we report on a study regarding the RNAi-mediated silencing of theBmi-1 gene in breast cancer.
Key words:RNA interference, Bmi-1, retrovirus vector, doxorubicin, breast cancer. Received: January 22, 2009; Accepted: June 5, 2009.
Introduction
Breast cancer is one of the most common malignan-cies affecting women worldwide. Despite the recent devel-opment of various therapeutic strategies, the prognosis for this cancer still remains poor. Thus, more efforts are needed to understand its molecular pathway in order to develop an effective therapy to achieve cure.
Bmi-1 (B-cell-specific moloney murine leukemia vi-rus insertion site 1) was originally identified as an onco-genic partner of c-Myc in murine lymphomagenesis (Haupt
et al., 1993; Van Lohuizenet al., 1991). It is a component of the Polycomb repressive complex 1, which represses gene expression through chromatin modifications (Valk-Lingbeeket al., 2004). Previous studies have revealed that Bmi-1 is involved in the regulation of stem-cell-associated genes to control cell self-renewing and differentiation (Park
et al., 2003; Molofskyet al., 2005). Other studies also dem-onstrated that Bmi-1 regulates the differentiation and
clonogenic self-renewal of I-type neuroblastoma cells (Cui
et al., 2006).
Bmi-1is overexpressed in several malignancies, such as non-small cell lung cancer (Vonlanthen et al., 2001), colorectal cancer (Kimet al., 2004a), nasopharyngeal car-cinoma (Songet al., 2006) and oral cancer (Kang et al., 2007). On the other hand, loss ofBmi-1with RNA interfer-ence (RNAi) was effective in suppressing growth and tumorigenicity of cancer cells (such as SH-SY5Y neuro-blastoma and ovary adenocarcinoma) (Liuet al., 2006a). This is consistent with the study of Cuiet al.(2007) that showed that down-regulation ofBmi-1impaired the ability of neuroblastoma cells to grow in soft agar and tumo-rigenicity in immunodeficient mice. Therefore, silencing of
Bmi-1may be of great importance in the design and devel-opment of anticancer therapy. However, to our best knowl-edge, there is so far no study in the literature on the therapeutic potential of Bmi-1 in breast cancer cell lines.
Notably, Bmi-1 was found to regulate self-renewal of breast cancer stem cells and to alter mammary development in a humanized nonobese diabetic-severe combined
www.sbg.org.br
Send correspondence to Fang-zhou Song. 1#
Yixueyuan Road, Yuzhong District, Chongqing, 400016 China. E-mail: fzsongqq@163.com.
immunodeficient (SCID) mouse model (Liuet al., 2005; 2006b). Overexpression ofBmi-1induces telomerase activ-ity and immortalizes human mammary epithelial cells (MECs), suggesting a potential role for Bmi-1 in the devel-opment of human breast cancer (Dimriet al., 2002). Ampli-fication of the Bmi-1 gene is detected in approximately 85% of human invasive ductal breast cancers and this genomic alteration is correlated with axillary lymph node metastases and positive estrogen receptor status (Kimet al., 2004b). Furthermore, the Bmi-1 mRNA transcript levels are higher in plasma from breast carcinoma patients than in healthy controls, and this amplification of Bmi-1 is predic-tive of poor clinical outcome (Silvaet al., 2007).
Doxorubicin has emerged as one of the most widely used chemotherapeutic agents for breast cancer. Although there is initial response to this chemotherapeutic agent, re-sistance is seen to develop over a period of time. This leads to a phenotypically more aggressive cell variant with an in-clination to metastasize. So, increasing chemosensitivity is very important for breast cancer therapy.
A study onBmi-1mRNA levels in several breast can-cer cell lines (MCF-7, MDA-MB-468, MDA-MB-231, T47D) was carried out. In MCF-7 and MDA-MB-231
Bmi-1expression was found to be maximal. In order to in-vestigate the possibility of turning Bmi-1 into a novel thera-peutic agent for the treatment of breast cancer, MCF-7 was chosen to silence the expression ofBmi-1with the highly specific post-transcriptional suppression of RNAi. There-after, proliferation, cell cycle status, apoptosis, and chemo-sensitivity to doxorubicin were also studied. The results obtained suggest that targeting of Bmi-1 may be used as a potential and specific therapeutic tool for the treatment of breast cancer.
Materials and Methods
Cell line and reagents
The highly malignant human breast adenocarcinoma cell line MCF-7 was obtained from Dr. Yin (Third Military Medical University, China). The humanBmi-1gene short hairpin RNA (shRNA)-expressing plasmid pSuper-retro/Bmi-1 si and a control plasmid pSuper-retro/GFP si expressing Green Fluorescent Protein (GFP) shRNA (Cui
et al., 2007) were used. The Bmi-1 siRNA sequence was 5’-AATGGACATACCTAATACT-3’, position 546 to 564 bp relative to the start codon. The GFP target sequence was 5’-GCAAGCTGACCCTGAAGTTC-3’. Lipofecta-mine 2000 Reagent was purchased from Invitrogen (USA), 3-(4,5-Dimethylthiazol-2-yl)-2,5-diphenyltetrazolium bro-mide (MTT) and doxorubicin hydrochloride were pur-chased from Sigma (USA).
Cell culture and gene-silencing assays
The MCF-7 cell line was maintained as a monolayer culture in RPMI-1640 medium (Hyclone, USA) with
L-glutamine (2 mM) and 10% fetal calf serum (Hyclone, USA) in a humidified atmosphere supplemented with 5% CO2at 37 °C. When the density of cells reached 90%-95%, transfections were carried out with Lipofectamine 2000 re-agent, using 2 mg of expression vector/mL serum-free me-dium, as recommended by the manufacturer. The cells which were transfected with pSuper-retro/Bmi-1 si were named Bmi-1si, and the cells transfected with pSuper-retro/GFP si were named GFPsi. The MCF-7 cells devoid of transfection were used as blank control. After 6 h of transfection, the medium was replaced by serum-contai-ning medium.
RNA preparation and semiquantitative RT-PCR
After 48 h of transfection, the total RNA of the cells was extracted using the Trizol method (Invitrogen, USA) according to the manufacturer’s directions, and quantified by spectrophotometry at 260 nm. cDNA was generated from 3-5 mg of total RNA, using SuperScript II reverse transcriptase and random primers, according to the manu-facturer’s protocol (Invitrogen, USA). PCR-based amplifi-cation with rTaq DNA polymerase (Takara, Japan) was performed under standard conditions. GAPDH was used as internal control of integrity and uniformity of the sample preparation. The PCR conditions maintained were as fol-lows: pdenaturing at 94 °C for 5 min, followed by 30 re-action cycles at 94 °C for 30 s, 51 °C for 30 s, 72 °C for 30 s, and a final extension cycle at 72 °C for 5 min. The PCR products were analyzed on a 1.5% agarose gel stained with ethidium bromide, and the resultant target bands were densitometrically analyzed by using Vistra Fluor Imager SI (Molecular Dynamics Inc., USA). The ratio of target gene to GAPDH OD value was used to represent the relative in-tensity of the target product. Primers were designed with Primer Premier 5.0 software, according to the human se-quences obtained from Medline. The primers were de-signed as follows: Bmi-1, 5’-GACCACTACTGAATATA AGG-3’ (sense), and 5’-CATTTGTCAGTCCATCTCTC--3’ (anti-sense); GAPDH, 5’-CATGAGAAGTATGACAA CAGCCT-3’ (sense), and 5’-CGTCCTTCCACGATA CCAAAGT-3’ (anti-sense).
Immunofluorescent staining
addi-tion of the mixture of ProLong mounting medium and Pro-Long Antifade reagent onto the slides. Fluorescent images were taken by confocal laser-scanning microscopy using a Leica TCS SP confocal system attached to a Leica DM IRBE microscope; 568 nm laser wavelength was used for analysis.
Western blot analysis
Total protein was isolated and quantified. Cells trans-fected for 48 h were harvested, washed with ice-cold PBS and lysed in lysis buffer containing 25 mM Tris-HCl, pH 8.0, 137 mM NaCl, 2.7 mM KCl, 1% Triton X-100 and pro-tease inhibitor mixture (Sigma, USA) at 4 °C for 30 min, followed by brief sonication. All the experimental steps were performed on ice. After centrifugation at 16,220 g at 4 °C for 10 min, supernatants were collected, and the pro-tein concentration was measured with the BCA assay re-agent (Bioteke, China) according to the manufacturer’s protocol. Following sodium dodecyl sulfate-polyacryl-amide gel electrophoresis (SDS-PAGE), the proteins were transferred onto a PVDF membrane (Immobilon, USA). After saturation, the membranes were incubated at room temperature for 2 h in TBS with 0.1%Tween-20 (TBS-T) containing 5% nonfat dry milk, and subsequently incubated with primary antibodies against Bmi-1 (1:600 dilution), cyclin D1 and p21 (1:200 dilution, Santa Cruz, USA) over-night at 4 °C. Peroxidase conjugated IgG antibodies (MultiSciences Biotech, China) were used as secondary an-tibodies. The protein was detected using the ECL detection kit (keygen, China) following the manufacturer’s protocol. b-actin immunoblotting was used as protein loading con-trol.
MTT assay
The MTT assay was used to detect the effect of plasmids on the growth of MCF-7 cells and to determine the 50% inhibitory concentration (IC50) of doxorubicin. For measurement of cell growth curves, cells (1104/well) were plated into 96-well plates and allowed to grow for 4 days af-ter transfection with retro/Bmi-1 si and pSuper-retro/GFP si. Growth curves were plotted as optical density (570 nm) versus days after transfection. To study the IC50, 48 h after transfection, cells were treated with various con-centrations of doxorubicin (0.03-100mg/mL) for 72 h. At each time point, 10mL of MTT stock solution (5 mg/mL in PBS) were added to each microtiter well and incubated for 4 h at 37 °C. After aspiration of the medium, 150mL of dimethyl sulfoxide was added and mixed, and absorbances were measured at a wavelength of 570 nm. The rate of cell growth inhibition (IR) was calculated according to the fol-lowing equation: IR = [1–A570(drug)/A570(control)] 100%, where A570(drug) is the absorbance of the cells exposed to doxorubicin and A570(control) is the absorbance of the cells without doxorubicin treatment.
Cell cycle assay
The cell cycle was analyzed by using flow cytometry (FCM) with propidium iodide staining. Both floating and attached cells were collected by trypsin digestion and low-speed centrifugation, washed with cold PBS, and then fixed in ice-cold 70% ethanol overnight. The fixed cells were col-lected by brief centrifugation and resuspended in PBS, after which the cells were treated with RNaseA and stained with propidium iodide for 1 h at room temperature, and finally analyzed by FCM.
Apoptosis assay
Apoptosis was assayed using the Annexin V-FITC Apoptosis Kit (keygen, China) according to the manufac-turer’s instructions. Briefly, the cells were harvested and washed twice with PBS, followed by resuspension in Annexin-V binding buffer, and then FITC-conjugated Annexin V and PI were added. After incubation for 10 min at room temperature in the dark, another binding buffer was added, and the samples were immediately analyzed using FCM.
Statistical analysis
All experiments were performed at least three times and statistical analysis was done using the SPSS13.0 pack-age (SPSS Inc., Chicago, USA). The values were expressed as mean±SD. The ANOVA test was used whenever more than two groups were compared, and the significance level was set at p < 0.05. Dunnett’spost hoctest was used to ana-lyze multiple comparisons. P values of less than 0.05 (p < 0.05) were considered to be statistically significant.
Results
Inhibition of Bmi-1 expression at the mRNA and protein levels
Bmi-1silencing inhibited MCF-7 cell proliferation
The MTT assay indicated strong inhibition in the growth rate of Bmi-1si MCF-7 cells compared to that of the blank control and GFPsi. After 24 h and 48 h of trans-fection, the optical density (570 nm) in Bmi-1si showed no significant differences compared to the blank control and
GFPsi. However, 72 h after transfection, there were significant differences between Bmi-1si and controls (Fig-ure 3).
Bmi-1silencing induced G0/G1cell cycle arrest and
abnormal expression of cyclin D1 and p21
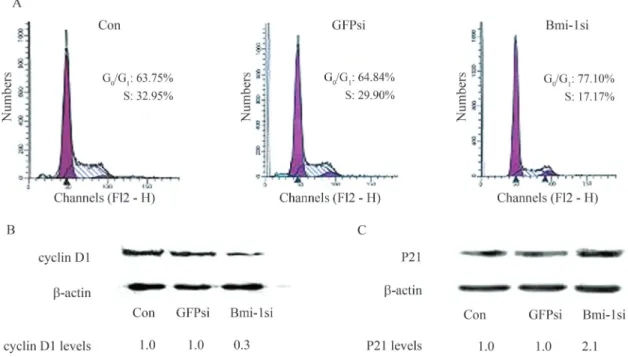
The effect ofBmi-1silencing on cell cycle progres-sion was analyzed using FCM.Bmi-1silencing induced an obvious increase in the number of cells at G0/G1phase and reduction in S phase, as 77.10% of the MCF-7 cells in Bmi-1si were noticed at G0/G1phase, compared to 63.75% and 64.84% cells in the blank control and GFPsi, respec-tively (Figure 4A). There were significant differences be-tween Bmi-1si and controls (p < 0.05). Western blot results clearly showed a reduction in the expression of cyclin D1 and an increase of p21 in Bmi-1si compared to the blank control and GFPsi (Figure 4B, C).
Apoptosis not induced byBmi-1silencing
The apoptotic rate was examined in three groups 48 h after transfection and the results are shown in Figure 5A. The basal level of apoptosis in Bmi-1si was 4.94%, com-pared to 3.18% and 2.84% in the blank control and GFPsi, respectively. No significant differences in cell apoptosis were noticed among these three groups.
Bmi-1silencing increased doxorubicin-induced
apoptosis
The apoptotic rate was further examined in cells after treatment with 1mg/mL doxorubicin for 48 h. The FCM data showed that the apoptotic rate in Bmi-1si treated with doxorubicin was 37%, as compared to 21% in the blank control also with doxorubicin. The levels of apoptosis in the
Figure 1- RT-PCR analysis of Bmi-1 mRNA level of MCF-7 cells 48 h after transfection. The ratio of band density for Bmi-1 to GAPDH in Bmi-1si was significantly lower, showing a 67% reduction in density as compared to the blank control; in GFPsi, the ratio showed a 5.2% reduc-tion compared to the blank control. There were significant differences be-tween Bmi-1si and controls (p < 0.05). Bar graphs represent the results of the densitometry analysis of Bmi-1, expressed as a percentage of the ratio (molecule of interest/GAPDH mRNA) detected in the control (*p < 0.05 vs.control).
Figure 2- Effect ofBmi-1silencing on the expression of Bmi-1 protein in MCF-7 cells. (A) immunofluorescent staining of Bmi-1 48 h after trans-fection, showing a significantly weaker fluorescence in MCF-7 cells of Bmi-1si compared to the blank control and GFPsi (Scale bars, 100mm). (B) Western blot analysis of Bmi-1 expression 48 h after transfection, showing a reduction of up to 70% in the protein level of Bmi-1, clearly in-dicating a marked difference from that of the blank control and GFPsi (p < 0.05).
blank control and Bmi-1si were 6.70% and 6.72%, respec-tively (Figure 5B). The differences between Bmi-1si treated with doxorubicin and the blank control treated with doxorubicin were significant (p < 0.05).
Bmi-1silencing made the cells more sensitive to
doxorubicin
After treatment with various concentrations of doxo-rubicin for 72 h, we found that the Bmi-1si cells showed a
Figure 4- Effect ofBmi-1silencing on cell cycle progression and expression of cyclin D1, p21 of MCF-7 cells. (A) The effect ofBmi-1silencing on cell cycle progression as shown by FCM. Cells were harvested 48 h after transfection and then stained with propidium iodide (PI).Bmi-1silencing induced an obvious increase in the number of cells at G0/G1 phase and reduction in S phase; 77.10% of the MCF-7 cells in Bmi-1si were found at G0/G1phase,
com-pared to 63.75% and 64.84% cells in blank control and GFPsi, respectively. There were significant differences between Bmi-1si and controls (p < 0.05). (B) and (C) Western blot analysis of cyclin D1 and p21 in MCF-7 cells 48 h after transfection. Relative levels of protein are indicated.b-actin levels are shown as loading control. Compared with blank control and GFPsi, a reduction in the expression of cyclin D1 and an increase in the expression of p21 were also noticed (p < 0.05).
higher IR than the blank control and GFPsi. The IC50value of doxorubicin in Bmi-1si was 0.12±0.07 mg/mL, com-pared to 0.86 ± 0.02 mg/mL in the blank control and 0.84±0.02mg/mL in GFPsi, respectively (Figure 6). There were significant differences between the IC50of Bmi-1si and that of controls.
Discussion
Previously, BE(2)-C cells infected with Bmi-1 siRNA expressing retrovirus showed a 70%-80% reduction in the Bmi-1 protein level (Cuiet al., 2006). In the present study, the same retrovirus vector was used to transiently transfect MCF-7 cells, resulting in 67% and 70% reduc-tions of Bmi-1 mRNA and protein levels, respectively. These data indicate that the RNAi strategy to silence Bmi-1 is specific and effective.
In this study, we found that the growth of MCF-7 cell was significantly retarded byBmi-1silencing. Because the Bmi-1-specific growth retardation was mediated by a de-layed cell cycle progression and/or an increased level of apoptosis (Menget al., 2005; Liuet al., 2006a; Yuet al., 2007), we measured the cell cycle distribution and apop-tosis ratio by FCM, in order to determine the relation be-tween inhibition of cell growth and cell cycle arrest or apoptosis.
According to our results,Bmi-1silencing both dis-rupted cell cycle progression and inhibited G1-S phase tran-sition significantly. The increase in the number of cells in G0/G1phase and decrease in S phase are consistent with the previous results observed in K562 (Menget al., 2005) and leukemic cells (Lessard and Sauvageau, 2003). Bmi-1 neg-atively regulates p16INK4a(Jacobset al., 1999), which acts in the P16INK4a-pRb pathway. P16INK4aaffects pRb by
in-hibiting the cyclin D/cyclin-dependent kinase 4/6 kinase complex. In the absence of Bmi-1, p16INK4amay get up-regulated and prevent binding of cyclin-dependent kinase 4/6 to cyclin D, thus inhibiting kinase activity. This in turn results in hypophosphorylation of pRb, which ultimately leads to cell cycle arrest, senescence, or apoptosis, depend-ing on context (Sherr, 2001). Our study shows that the marked down-regulation of cyclin D1 might be related to the inhibition of the G1-S phase transition.
Our results indicate that the expression of p21 protein was increased. Bmi-1 can negatively regulate ARF, which probably promotes senescence by regulating the ARF-p53-p21 pathway (Jacobset al., 1999; Dimriet al., 2000). Evidence has shown the key role of p21 in senescence. Ab-rogation of the p53-p21 pathway by various strategies can bypass senescence in human and mouse cells, a variety of stimuli induce senescence in a p53/p21-dependent manner and enforced expression of p21 in certain cell types can in-duce a senescence-like phenotype (Dimri, 2005). So, we conjectured that p21 might be involved in the senescence induced by Bmi-1 silencing.
Bmi-1 may negatively regulate p19ARF, which se-questers the p53 inhibitor MDM2 and thereby prevents the degradation of p53, resulting in p53-mediated apoptosis (Jacobset al., 1999). So, loss of Bmi-1 may promote cell apoptosis (Liuet al., 2006a). However, in agreement with previous findings in human I-type neuroblastoma cells (Cui
et al., 2006) and in A549 lung cancer cells (Yuet al., 2007), we observed no significant cell apoptosis. This suggests thatBmi-1silencing affects cell apoptosis, which may vary in different cell lines. We therefore conclude thatBmi-1 si-lencing may induce the inhibition of MCF-7 cell prolifera-tion through a mechanism that is largely dependent on cell cycle regulation, but not on apoptosis.
We also studied the role of Bmi-1 on chemother-apy-induced apoptosis in MCF-7 cells and found that the down-regulation ofBmi-1resulted in an increased sensitiv-ity of these cells to doxorubicin, expressed by apoptosis. This report is consistent with a previous result observation in nasopharyngeal carcinoma cells (Qinet al., 2008).
Altogether, our study demonstrates that siRNA tar-geting ofBmi-1led to the efficient and specific inhibition of endogenous Bmi-1 mRNA and protein expression of MCF-7 cellsin vitro. Down-regulation of Bmi-1 inhibited the proliferation and increased the chemosensitivity of MCF-7 cells, indicating that Bmi-1 can be developed into a therapeutic option for the treatment of breast cancer. Fur-ther studies will be directed toward uncovering the mecha-nism underlying the enhancement of doxorubicin-induced apoptosis by the silencing ofBmi-1.
References
Cui H, Ma J, Ding J, Li T, Alam G and Ding HF (2006) Bmi-1 reg-ulates the differentiation and clonogenic self-renewal of
Figure 6- Effect ofBmi-1silencing on the chemosensitivity of MCF-7 cells to doxorubicin. The Y-axis indicates IR, the X-axis indicates concen-tration of doxorubicin. Cells in Bmi-1si showed higher IR than that in the blank control and GFPsi. The IC50value of doxorubicin in Bmi-1si was
0.12 ± 0.07 mg/mL, compared to 0.86 ± 0.02 mg/mL and 0.84±0.02mg/mL in the blank control and GFPsi, respectively. The dif-ferences between the IC50of Bmi-1si and that of controls were significant
I-type neuroblastoma cells in a concentration-dependent manner. J Biol Chem 281:34696-34704.
Cui H, Hu B, Li T, Ma J, Alam G, Gunning WT and Ding HF (2007) Bmi-1 is essential for the tumorigenicity of neuro-blastoma cells. Am J Pathol 170:1370-1378.
Dimri GP (2005) What has senescence got to do with cancer? Cancer Cell 7:505-512.
Dimri GP, Itahana K, Acosta M and Campisi J (2000) Regulation of a senescence checkpoint response by the E2F1 transcrip-tion factor and p14(ARF) tumor suppressor. Mol Cell Biol 20:273-285.
Dimri GP, Martinez JL, Jacobs JJ, Keblusek P, Itahana K, Van Lohuizen M, Campisi J, Wazer DE and Band V (2002) The Bmi-1 oncogene induces telomerase activity and immortal-izes human mammary epithelial cells. Cancer Res 62:4736-4745.
Haupt Y, Bath ML, Harris AW and Adams JM (1993) Bmi-1 transgene induces lymphomas and collaborates with myc in tumorigenesis. Oncogene 8:3161-3164.
Jacobs JJ, Kieboom K, Marino S, DePinho RA and van Lohuizen M (1999) The oncogene and Polycomb-group gene bmi-1 regulates cell proliferation and senescence through the ink4a locus. Nature 397:164-168.
Kang MK, Kim RH, Kim SJ, Yip FK, Shin KH, Dimri GP, Christensen R, Han T and Park NH (2007) Elevated Bmi-1 expression is associated with dysplastic cell transformation during oral carcinogenesis and is required for cancer cell replication and survival. Br J Cancer 96:126-133.
Kim JH, Yoon SY, Kim CN, Joo JH, Moon SK, Choe IS, Choe YK and Kim JW (2004a) The Bmi-1 oncoprotein is over-expressed in human colorectal cancer and correlates with the reduced p16INK4a/p14ARF proteins. Cancer Lett 203:217-224.
Kim JH, Yoon SY, Jeong SH, Kim SY, Moon SK, Joo JH, Lee Y, Choe IS and Kim JW (2004b) Overexpression of Bmi-1 oncoprotein correlates with axillary lymph node metastases in invasive ductal breast cancer. Breast 13:383-388. Lessard J and Sauvageau G (2003) Bmi-1 determines the
proli-ferative capacity of normal and leukaemic stem cells. Nature 423:255-260.
Liu L, Andrews LG and Tollefsbol TO (2006a) Loss of the human polycomb group protein BMI1 promotes cancer-specific cell death. Oncogene 25:4370-4375.
Liu S, Dontu G and Wicha MS (2005) Mammary stem cells, self-renewal pathways, and carcinogenesis. Breast Cancer Res 7:86-95.
Liu S, Dontu G, Mantle ID, Patel S, Ahn NS, Jackson KW, Suri P and Wicha MS (2006b) Hedgehog signaling and Bmi-1 reg-ulate self-renewal of normal and malignant human mam-mary stem cells. Cancer Res 66:6063-6071.
Meng XX, Liu WH, Liu DD, Zhao XY and Su BL (2005) Con-struction of antisense Bmi-1 expression plasmid and its in-hibitory effect on K562 cells proliferation. Chin Med J 118:1346-1350.
Molofsky AV, He S, Bydon M, Morrison SJ and Pardal R (2005) Bmi-1 promotes neural stem cell self-renewal and neural de-velopment but not mouse growth and survival by repressing the p16Ink4a and p19Arf senescence pathways. Genes Dev 19:1432-1437.
Park IK, Qian D, Kiel M, Becker MW, Pihalja M, Weissman IL, Morrison SJ and Clarke MF (2003) Bmi-1 is required for maintenance of adult self-renewing haematopoietic stem cells. Nature 423:302-305.
Qin L, Zhang X, Zhang L, Feng Y, Weng GX, Li MZ, Kong QL, Qian CN, Zeng YX, Zeng MS,et al.(2008) Downregulation of BMI-1 enhances 5-fluorouracil-induced apoptosis in na-sopharyngeal carcinoma cells. Biochem Biophys Res Com-mun 371:531-535.
Sherr CJ (2001) The INK4a/ARF network in tumour suppression. Nat Rev Mol Cell Biol 2:731-737.
Silva J, García V, García JM, Peña C, Domínguez G, Díaz R, Lorenzo Y, Hurtado A, Sánchez A and Bonilla F (2007) Cir-culating Bmi-1 mRNA as a possible prognostic factor for advanced breast cancer patients. Breast Cancer Res 9:R55. Song LB, Zeng MS, Liao WT, Zhang L, Mo HY, Liu WL, Shao
JY, Wu QL, Li MZ, Xia YF,et al.(2006) Bmi-1 is a novel molecular marker of nasopharyngeal carcinoma progression and immortalizes primary human nasopharyngeal epithelial cells. Cancer Res 66:6225-6232.
Valk-Lingbeek ME, Bruggeman SW and van Lohuizen M (2004) Stem cells and cancer; the polycomb connection. Cell 118:409-418.
Van Lohuizen M, Verbeek S, Scheijen B, Wientjens E, van der Gulden H and Berns A (1991) Identification of cooperating oncogenes in E mu-myc transgenic mice by provirus tag-ging. Cell 65:737-752.
Vonlanthen S, Heighway J, Altermatt HJ, Gugger M, Kappeler A, Borner MM, van Lohuizen M and Betticher DC (2001) The bmi-1 oncoprotein is differentially expressed in non-small cell lung cancer and correlates with INK4A-ARF locus ex-pression. Br J Cancer 84:1372-1376.
Yu Q, Su B, Liu D, Liu B, Fan Y, Wang Y and Meng X (2007) Antisense RNA-mediated suppression of Bmi-1 gene ex-pression inhibits the proliferation of lung cancer cell line A549. Oligonucleotides 17:327-335.
Associate Editor: Carlos F.M. Menck