J of Evolution of Med and Dent Sci/ eISSN- 2278-4802, pISSN- 2278-4748/ Vol. 4/ Issue 84/ Oct. 19, 2015 Page 14692
AUDIOLOGICAL EVALUATION OF PREGNANT WOMEN WITH GESTATIONAL
DIABETES MELLITUS: A CLINICAL STUDY
A. S. Aruna Kumari1,M. Mahendra Kumar2, S. Muneeruddin Ahmed3
HOW TO CITE THIS ARTICLE:
A. S. Aruna Kumari,M. Mahendra Kumar, S. Muneeruddin Ahmed. Audiological Evaluation of Pregnant Women with Gestational Diabetes Mellitus: A Clinical Study . Journal of Evolution of Medical and Dental Sciences 2015; Vol. 4, Issue 84, October 19; Page: 14692-14698, DOI: 0.14260/jemds/2015/2088
ABSTRACT: Gestational Diabetes Mellitus (GDM) is defined as an abnormal glucose metabolism with varying severity, recognized first during pregnancy. GDM usually occurs during 2nd and 3rd trimesters
of pregnancy. The pathological changes caused by it are same as Diabetes Mellitus affecting various organs including eyes and ears. The high fluctuations in blood glucose levels are known to produce micro vascular changes in kidney, retina, cochlea and peripheral nerves. WHO prescribed criterion for Glucose Tolerance Test (GTT) helps in diagnosing the condition. The aim of diagnosis of GDM is to prevent complications of High fluctuating blood levels in the mother. A clinical study is conducted to assess the effect of GDM on hearing acuity of the patients diagnosed with GDM in 2nd and 3rd
trimesters of pregnancies in a tertiary Hospital. MATERIALS AND METHODS: 39 pregnant women with GDM during their antenatal checkups at the OPD of OBG department of Government General Hospital attached to Gandhi Medical College, Secunderabad are randomly selected for this study are termed as study group. 43 Subjects without GDM, with Body mass Index (BMI) above 25Kg/m² are included as control group. GTT is done as prescribed by the American Association of Dialectologists to confirm the diagnosis. The hearing acuity is assessed by pure tone audiometry by a trained audiologist in a sound proof room. Air conduction thresholds and PTA are recorded in both the groups after a preliminary ENT examination. RESULTS: There was no decrease in air or bone conduction thresholds of lower frequencies and SRT in both the groups. There was decrease in air conduction threshold levels in mid frequencies, but no decrease in bone conduction thresholds (4K, 6K) of study group. There was statistically significant fall in Air conduction thresholds of higher frequencies (10K, 12K, and 14K) in the study group. CONCLUSIONS: Gestational Diabetes Mellitus is a Pregnancy risk factor causing hearing loss in women affecting the mid and high frequency air conduction thresholds.
KEYWORDS: Pregnancy, Diabetes Mellitus, GDM, Hearing Loss, High Frequencies, PTA, SRT, GTT, Child birth and Audiometry.
INTRODUCTION: Diabetes mellitus (DM) is a genetically transmitted disease.1 causing reduced
production of insulin by pancreas or absolute or relative impairment in insulin function. It is clinically characterized by polyphagia, polydypsia and increased blood sugar levels.2 once established it
presents as a chronic degenerative disorder affecting all the organs. Gestational diabetes mellitus (GDM is defined as glucose intolerance of variable severity with onset or first recognition during pregnancy Metzger, 1991 .3,4 GDM can occur during 2nd and 3rd trimesters of pregnancy.
Depending on the population studied and the diagnostic test employed, prevalence may range
from 2.4 to 21 per cent of all pregnancies.5 Surveys conducted in different cities of India in
2002-2003 showed an overall GDM prevalence of 16.55%.6 In a similar study in Tamil Nadu, it was
J of Evolution of Med and Dent Sci/ eISSN- 2278-4802, pISSN- 2278-4748/ Vol. 4/ Issue 84/ Oct. 19, 2015 Page 14693
DM is classified as 4 major groups; type 1 – As a result of destruction of bet-cells from autoimmune reaction; type2: impaired insulin metabolism or secretion disorder; secondary diabetes due to genetic predisposition, drug us, unknown cause; gestational diabetes.1 The common type is DM
type 2, about 80-90% of all cases and common in obese persons. DM type1 accounts for 10-20%. Organs like kidney, eye, peripheral nerves and cranial nerves are commonly involved. In the auditory system DM causes atrophy of the spiral ganglion and degeneration of the myelin sheath of the VIIth nerve. It also found to cause reduction in the number of nerve fibres of spiral lamina,
thickening of the capillary walls of striae vascularis and micro vasculature of the inner ear.1 the
changes may take a gradual onset and progression, but during gestation the process may take a rapid downhill course and results in Sudden Sensory-neural hearing Loss.
The main aim of treatment of GDM is to prevent complications. The present study aims at clinically evaluating Gestational DM type 2 patients in relation to the hearing acuity with the help of pure tone audiogram. Fluctuation in the hearing loss is also assessed by serial audiological evaluation. Hearing loss affecting the different frequency ranges are also recorded in the present study. Even though the DM is found to be one of the causes of hearing loss, but the cause and effect relation is not yet described.2
MATERIALS AND METHODS: The present study was conducted at General hospital attached to Gandhi Medical Hospital, Secunderabad, Telangana, between April 2009 and February 2011. The study was in collaboration with the department of OBG. 82 pregnant women attending the OPD for ante natal checkups were divided into two groups. 39 women with established GDM during these checkups for the first time were considered as study group and 43 women with no abnormal sugar levels but with BMI more than 25Kg/M² as control group.
Inclusion Criteria: Pregnant women aged between 23 to 39years were included. Women with gestational ages at 28th to 36th week were included.
Exclusion Criteria: Women aged above 40 years, Gestational ages beyond 36th week or earlier than
28th week, GDM diagnosed in earlier pregnancies, patients already diagnosed and taking treatment
for DM, previous history of hearing loss due to middle ear diseases or drug induced or idiopathic preexisting HL.
Due ethical clearance from the committee of the institute was taken and an informed consent about the participation of the women was taken. General information and demographic data, socio-economic status, level of education, number of pregnancies, and family history of diabetes and/or hypertension were recorded. Body Mass Index (BMI) was calculated depending upon their height and weight of the pregnant women and BMI above 25Kg/m² to 33Kg/m² were included in the study as control group. GDM was diagnosed in these women according to diagnostic criteria recommended by the American Diabetes Association (ADA) for a 2-h 75g OGTT. If two or more plasma glucose levels meet or exceed the following thresholds: 1. fasting glucose concentration of 95 mg/dl 2.1-h glucose concentration of 180mg/dl 3.2hr. glucose concentration of 155mg/dl. GDM was diagnosed if the fasting glucose levels are more than 126mg% and HbA1c levels were more than 7%.
J of Evolution of Med and Dent Sci/ eISSN- 2278-4802, pISSN- 2278-4748/ Vol. 4/ Issue 84/ Oct. 19, 2015 Page 14694
The women in the control group were also selected according to the same criteria and did not have history of earlier GDM and pathological high sugar levels. Women of both the groups were evaluated with audiological tests 1. Air conduction and Bone conduction thresholds for the frequencies from 250KHZ to 16K KHZ were recorded. 2. PTA calculated from the above reading at 500KHZ to 2K KHZ. All the audiological tests and clinical assessments were done by the same investigators.
Statistical Analysis: T test calculator was used to test the difference between two proportions. Mann-Whitney U test was used to calculate p value using SPSS version of 17.0 software.
OBSERVATIONS: In the study group of 39 women the youngest was aged 23 years and the eldest was aged 39 years with a mean age of 26.30; Median 25 and mode 24.
Age Group Socio economic status Education Level BMI- Kg/m² Low Middle Higher +2 Graduate P.G 25-27 28-30 31-33 23-27 Yrs. 04 05 03 06 05 02 03 05 02 28-32 Yrs. 03 04 04 03 07 03 05 03 01 33-37 Yrs. 04 06 02 02 04 03 06 04 02 >37 Yrs. 01 02 01 00 01 03 04 02 02
Total 12 17 10 11 17 11 18 14 07
Table 1: Showing the Socio-economic, education status in relation with BMI in the Study group (n=39)
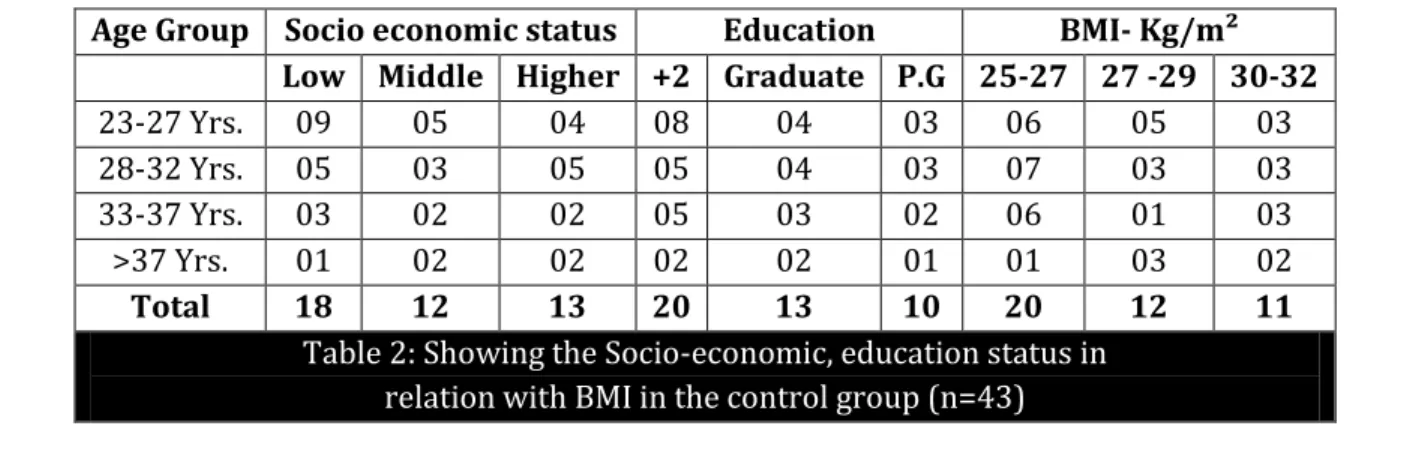
In the study group pregnant women belonging to low socio economic group were 12(30.76%), middle group were 17(43.58%) and higher status were 10(25.64%). Education level was plus 2 in 11(28.02%), graduate in 17(43.58%) and P. G in 11(28.02%) of the women. The Body Mass Indices between 25 and 27 were observed in 18(46.15%), BMI 28 to 30 were in 14(35.89%) and 31 to 33 were observed in 07(17.94%) of the pregnant women (Table 1). In the control group of 43 women the youngest was aged 25 years and the eldest was aged 39 years with a mean age of 28.23; Median 28 and mode 28. Pregnant women belonging to low socio economic group were 18(41.86%), middle group were 12(27.90%) and higher status were 13(30.23%). Education level was plus 2 in 11(25.58%), graduate in 17(39.53%) and P. G in 11(25.58%) of the women. The Body Mass Indices between 25 and 27 were observed in 18(41.86%), BMI 28 to 30 were in 14(32.55%) and 31 to 33 were observed in 07(16.27%) of the pregnant women (Table2).
Age Group Socio economic status Education BMI- Kg/m² Low Middle Higher +2 Graduate P.G 25-27 27 -29 30-32 23-27 Yrs. 09 05 04 08 04 03 06 05 03 28-32 Yrs. 05 03 05 05 04 03 07 03 03 33-37 Yrs. 03 02 02 05 03 02 06 01 03 >37 Yrs. 01 02 02 02 02 01 01 03 02
Total 18 12 13 20 13 10 20 12 11
J of Evolution of Med and Dent Sci/ eISSN- 2278-4802, pISSN- 2278-4748/ Vol. 4/ Issue 84/ Oct. 19, 2015 Page 14695
In the control group the mean FBS in the age group of 23-27 was 128±4.6, 116±3.2 in the age group of 28-32 years, 122±2.8 in the age group of 33-37 years and 130±4.0 in the age group of above 37 years. The mean PBS was 270±3.8 in the age group of 23-27 years, 190±2.8 in the age group of 33-37 years and 240±3.6 in the age group of above 37 years. In the control group the corresponding means of FBS and PBS values for the age group 23-27 years was 80±2 & 120±3, for the age group 28-32 was 70±3.2 & 124±2.1, for 33-37 years was 138±2.5 and for above 37 years was 160±1.6. Statistical analysis using T test calculator using the values with their corresponding age groups showed to be not significant as the P value was more than predicted P value at 0.05. It indicates that the study is conducted on groups with independent variables (Table 3).
Study Group Control Group
Age Group Mean FBS
Mean PBS
Mean HbA1c
Mean FBS
Mean PBS
Mean
HbA1c P value 23-27 Yrs. 128±4.6 270±3.8 9 80±2.0 120±3.0 6 0.14 28-32 Yrs. 116±3.2 190±2.8 10 70±3.2 124±2.1 5 0.83 33-37 Yrs. 122±2.8 210±4.2 8 76±2.8 138±2.5 6 0.92 >37 Yrs. 130±4.0 240±3.6 11 82±1.8 160±1.6 6 0.22
Table 3: Showing the mean FBS, RBS and HbA1c values and chi square values (n=39)
Study Group (n=39) Control group(n=43) P Value
Frequency KHZ
Air conduction Mean± SD
Bone conduction Mean± SD
Air conduction Mean± SD
Bone conduction Mean± SD
Right Left Right Left Right Left Right Left
0.912 250 8.2±1.2 7.2±1.2 9.3±1.2 9.0±1.4 7.2±1.2 6.6±1.2 8.0±2.0 9.5±2.0
500 8.6±2.2 7.6±2.2 9.4±2.8 9.2±3.8 7.0±2.4 7.0±2.4 8.9±2.8 9.9±2.8 1000 9.4±3.1 8.4±3.1 11±3.4 11±3.0 8.1±2.1 8.0±1.9 10±2.0 12±2.0 1500 9.0±3.0 7.0±3.0 10±4.22 11±3.2 7.0±1.0 7.1±2.0 11±2.2 12±1.2 2000 11±2.9 09±2.9 14±2.3 15±2.6 9.0±2.9 9.8±2.0 16±2.4 16±1.6 3000 12±4.2 12±4.2 14±3.2 15±2.8 12±4.2 12±1.2 16±0.8 15±1.8 4000 28±8.8 26±8.8 22±4.8 21±3.3 15±8.8 17±4.8 14±2.0 17±2.3
0.005 6000 32±9.0 30±9.0 28±5.2 27±3.2 16±9.0 16±6.0 18±1.5 17±2.2
8000 15±8.4 14±8.4 17±8.4 16±6.0 15±8.4 15±4.4 18±4.0 18±1.0 0.52 10000 28±6.2 26±7.2 20±9.2 21±4.2 18±9.2 18±6.2 18±3.2 19±4.2
0.005 12000 28±6.9 24±6.9 28±4.9 27±8.9 16±6.9 16±3.9 19±2.9 19±4.9
14000 29±10.1 26±10 31±10.1 32±4.1 15±4.1 15±3.1 21±4.1 20±2.1 16000 30±8.6 29±8.6 34±8.6 32±6.6 14±2.2 14±1.2 22±6.6 20±3.6
Table 4: Showing the mean with SD PTA
values at different frequencies in both the groups (n=82)
J of Evolution of Med and Dent Sci/ eISSN- 2278-4802, pISSN- 2278-4748/ Vol. 4/ Issue 84/ Oct. 19, 2015 Page 14696
The p-value was 0.00512. The result was significant at P equal to or less than 0.05. Other frequencies did not show statistical significance between the two groups with P value more than 0.05(Table 4). The PTA was calculated as an average of air conduction values at consecutive frequencies 500, 1000, 1500 and 2000KHZ in both ears. The mean PTA values of both the ears of both groups showed ranging from 14 to 20dB. The normal PTA is taken as 15dB. The values of the present study were falling within normal limits in majority of the subjects and very few of the values crossing the upper limit of 15dB (Table 5).
Study Group-39 Control Group-43
Age Group Mean PTA Mean SRT Mean PTA Mean SRT
Right Left Right Left Right Left Right Left 23-27 Yrs. 16.4±1.4 15±3.4 78.6 79.4 15.4±1.4 14±1.4 74.6 78.1 28-32 Yrs. 17±2.6 18±2.9 84.2 82.6 14±2.4 15±1.9 86.4 80.5 33-37 Yrs. 19±2.8 20±3.3 83.6 86.4 13±2.7 14±2.3 85.6 83.3 >37 Yrs. 18±3.1 19±2.7 80 88.2 15±3.3 16±2.3 83.4 82.1
Table 5: Showing the mean with SD PTA and SRT values in both the groups (n=82)
DISCUSSION: Review of literature shows many studies establishing direct correlation between Diabetes Mellitus and hearing loss. But it was Framingham who demonstrated the relation between blood glucose and hearing loss in women. In 1997 a study on type 2GDM showed that there were no changes on the central pathways and the HL was due to involvement of cochlear receptors. To establish correlation between DM and Hearing loss many authors have conducted studies.
Framingham showed the relation between blood glucose levels and hearing loss in pregnant women. An analysis of central and peripheral auditory pathways was done in type 2 GDM in 1997 and it was found that the central pathways show no involvement and it was cochlear receptors are mainly affected.8
Insulin resistance and hyper insulinemia in the body causes raised triglycerides and impaired lipid metabolism which is related to auditory and vestibular symptoms in patients with DM.9,10
Diabetic patients with neuropathy present with HL in frequencies ranging from 250KHZ to 8000KHZ higher mean hearing thresholds compared to DM patients without neuropathy.11 The HL is
fluctuating type in DM as in Endolymphatic hydrops but may progress to develop microangiopathy of striae vascularis and spiral ligament and diabetic neuropathy assists in worsening of the situation.12
It can be concluded with this available evidence that for normal inner ear function there should be a good balance between insulin and blood glucose levels. In GDM similar to DM though blood glucose levels are high it cannot enter the cells of the inner ear because of insulin resistance and/or lack of insulin.9,13 In the present study audiometry is performed irrespective of hearing loss
mentioned or not mentioned by the patients. It was observed that the reason could be due to normal threshold levels in the speech frequencies and the audiometry showed normal PTA values in both the groups. Inner ear is vulnerable to fluctuations in glucose levels because it has no storage capacity and itself presents with intense metabolic activity.14
J of Evolution of Med and Dent Sci/ eISSN- 2278-4802, pISSN- 2278-4748/ Vol. 4/ Issue 84/ Oct. 19, 2015 Page 14697
Another study on 5,140 individuals in 2008 found diabetic subjects had reduced hearing in all frequencies, and higher degrees of hypoacusis at higher frequencies.17 In the present study the GDM
patients showed statistical significant audiometry changes in the test frequencies from 4000KHZ to 6000KHZ and 10,000 KHZ to 16000KHZ in both ears with a p value at 0.005 which was less than predicted value of 0.05. The study shows that the patients with GDM developed sensory neural HL especially at mid and higher frequencies. None of the subjects of control group showed either subjective complaints of HL or audiometry evidence of raised threshold values in Air conduction at all frequencies.
Even though there are papers in the literature in which no direct correlation is found between GDM or DM patients to loss of hearing like Profazio & Barraveli (1959), Strauss et al.; (1982), Miller et al; (1983), Axellson & Fagerberg (1968), and España et al; (1995). This study is in agreement with papers which show relation between GDM, DM to hearing loss.
CONCLUSION: Audiological examination indicated the presence of statistically significant differences between study group of GDM women and control group of pregnant women with matching BMI at 4000KHZ, 6000KHZ and 10000KHZ, 12000KHZ, 14000KHZ and 16000 KHz of both ears and mean values for both ears. The study group subjects were statistically more likely to have hypoacusis in both ears at the specified frequencies. There were no threshold shifts of Pure Tone Average in both the groups which would explain the lack of subjective presentation of hearing loss.
REFERENCES:
1. Alvarenga KF, Duarte JL, Silva DPC, Agostinho-Pesse RS, Negrato CA, Costa OA. P300 cognitive potential on subjects with diabetes mellitus. Braz J Otorhinolaryngol. 2005; 71(2):202-7.
2. Maia CAS, Campos CAH. Diabetes Mellitus as etiological factor of hearing loss. Braz J Otorhinolaryngol. 2005; 71(2):208-14.
3. Metzger, B.E. Summary and recommendations of the third international workshop-conference on gestational diabetes mellitus. Diabetes, 40(Suppl.2):197– 201(1991).
4. American Diabetes Association, Gestational Diabetes Mellitus (Position Statement) Diabetes Care.2004; 27(Suppl 2):S88–90.
5. Seshiah V, Balaji V, Balaji MS, Paneerselvam A, Arthi T, Thamizharasi M, et al. Prevalence of gestational diabetes mellitus in South India(Tamil Nadu) - a community based study. J Assoc Physicians India. 2008; 56:329–33.
6. Seshiah V, Balaji V, Balaji MS, Sanjeevi CB, Green A. Gestational diabetes mellitus in India. J Assoc Physicians India. 2004; 52:707–11.
7. Di Leo MA, Di Nardo W, Cercone S, Ciervo A, Lo Monaco M, Greco AV, et al. Cochlear dysfunction in IDDM patients with subclinical peripheral neuropathy. Diabetes Care. 1997; 20(5):824-8. 8. Dall'Igna C, Batista LRP, Siqueira MK. Patogênese da disacusia neurossensorial em Diabetes
Mellitus. Rev Bras Otorrinolaringol. 2000; 66(2):155-8.
9. Ferreira Jr. CA, Guimarães RES, Becker HMG, Silva CDL, Gonçalves TML, Crosara PFTB, et al. Avaliação metabólica do paciente com labirintopatia. Arq Otorrinolaringol. 2000; 4(1):28-32. 10. Olefsky JM, Farquhar JW, Reaven GM. Reappraisal of the role of insulin in hypertriglyceridemia.
Am J Med. 1974; 57(4):551-60.
J of Evolution of Med and Dent Sci/ eISSN- 2278-4802, pISSN- 2278-4748/ Vol. 4/ Issue 84/ Oct. 19, 2015 Page 14698
12. Bittar RMB, Sanchez TG, Santoro PP, Medeiros IRT. O metabolismo da glicose e o ouvido interno. Arq Fund Otorrinolaringológica - USP. 1998; 2(1):4-7.
13. Myers SF, Ross MD. Morphological evidence of vestibular pathology in long-term experimental diabetes mellitus. Acta Otolaryngol. 1987; 104 :( 1-2):40-9.
14. Fukushima H, Cureoglu S, Schachern PA, Kusunoki T, Oktay MF, Fukushima N, et al. Cochlear changes in patients with type 1 diabetes mellitus. Otolaryngol Head Neck Surg. 2005; 133(1):100-6.
15. Tay HL, Ray N, Ohri R, Frootko NJ. Diabetes mellitus and hearing loss. Clin Otolaryngol Allied Sci. 1995; 20(2):130-4.
16. Gibbin KP, Davis CG. A hearing survey in diabetes mellitus. Clin Otolaryngol Allied Sci. 1981; 6(5):345-50.
17. Bainbridge KE, Hoffman HJ, Cowie CC. Diabetes and hearing impairment in the United States: audiometric evidence from the National Health and Nutrition Examination Survey, 1999 to 2004. Ann Intern Med. 2008; 149(1):1-10
.
AUTHORS:
1. A. S. Aruna Kumari 2. M. Mahendra Kumar 3. S. Muneeruddin Ahmed
PARTICULARS OF CONTRIBUTORS:
1. Assistant Professor, Department of ENT, Gandhi Medical College, Secunderabad. 2. Associate Professor, Department of ENT,
Government Medical College, Anantapur, Andhra Pradesh.
3. Professor and HOD, Department of ENT, Osmania Medical College, Hyderabad.
FINANCIAL OR OTHER
COMPETING INTERESTS: None
NAME ADDRESS EMAIL ID OF THE CORRESPONDING AUTHOR:
Dr. A. S. Aruna Kumari, Flat No. 207, Vaishnavi,
Laxmi Venkata Villa Vegetable Market, Nallakunta, Hyderabad-500044. E-mail: arunaannavaram@gmail.com