Prevalence of All-Cause and
Diagnosis-Specific Disability Pension at the Time of First
Coronary Revascularisation: A
Population-Based Swedish Cross-Sectional Study
Katharina Zetterström1*, Margaretha Voss1,2, Kristina Alexanderson1, Torbjörn Ivert3, Kenneth Pehrsson4, Niklas Hammar5,6, Marjan Vaez1,7
1Division of Insurance Medicine, Department of Clinical Neuroscience, Karolinska Institutet, Stockholm, Sweden,2Department of Analysis and Forecasts, Swedish Social Insurance Agency, Stockholm, Sweden, 3Department of Cardiothoracic Surgery and Anesthesiology, Karolinska University Hospital and Department of Molecular Medicine and Surgery, Karolinska Institutet, Stockholm, Sweden,4Department of Medicine, Karolinska Institutet, Stockholm, Sweden,5AstraZeneca R&D, Mölndal, Sweden,6Institute of
Environmental Medicine, Karolinska Institutet, Stockholm, Sweden,7Centre for Occupational and Environmental Medicine, Stockholm County Council, Stockholm, Sweden
Abstract
Background
Although coronary revascularisation by coronary artery bypass graft surgery (CABG) and percutaneous coronary intervention (PCI) is well documented, scientific knowledge on disability pension (DP) at the time of revascularisation is lacking. The aim was to investi-gate the prevalence of all-cause and diagnosis-specific DP at the time of a first coronary revascularisation, accounting for socio-demographic and medical factors.
Materials and Methods
A population-based cross-sectional study using Swedish registers was conducted including all 65,676 patients (80% men) who when aged 30–63 years, within 1994–2006, had a first
CABG (n = 22,959) or PCI (n = 42,717) and did not have old-age pension. Associations be-tween socio-demographic and medical factors and the probability of DP were estimated by odds ratios (OR) with 95% confidence intervals (CI) using logistic regression analyses.
Findings
The prevalence of DP at time of revascularisation was 24%, mainly due to musculoskeletal diagnoses. Sixty-two percent had had DP for at least four years before the revascularisation. In the multivariable analyses, DP was more common in women (OR: 2.40; 95% CI: 2.29–2.50), older patients (50–63 years); especially men aged 60–63 years with CABG
(OR: 4.91; 95% CI: 4.27–5.66), lower educational level; especially men with PCI (OR: 2.96;
95% CI: 2.69–3.26), patients born outside Sweden; especially men with PCI (OR: 2.11;
OPEN ACCESS
Citation:Zetterström K, Voss M, Alexanderson K, Ivert T, Pehrsson K, Hammar N, et al. (2015) Preva-lence of All-Cause and Diagnosis-Specific Disability Pension at the Time of First Coronary Revascularisation: A Population-Based Swedish Cross-Sectional Study. PLoS ONE 10(1): e0115540. doi:10.1371/journal. pone.0115540
Academic Editor:Carmine Pizzi, University of Bolo-gna, ITALY
Received:July 12, 2014
Accepted:November 25, 2014
Published:January 28, 2015
Copyright:© 2015 Zetterström et al. This is an open access article distributed under the terms of the
Creative Commons Attribution License, which permits unrestricted use, distribution, and reproduction in any medium, provided the original author and source are credited.
95% CI: 1.96–2.27), and in women with an indication of other diagnoses than acute
coro-nary syndrome (ACS) or stable angina pectoris for PCI (OR: 1.72; 95% CI: 1.31–2.24).
Conclusion
About a quarter had DP at the time of revascularisation, often due to musculoskeletal diag-noses. More than half had had DP for at least four years before the intervention. DP was as-sociated with female gender, older age, lower educational level, and being born outside Sweden.
Introduction
Annually in Sweden about 10,000 patients of working age undergo coronary revascularisation, i.e. coronary artery bypass graft surgery (CABG) or percutaneous coronary intervention (PCI). These are established and well-documented interventions [1–8] resulting in symptom reduc-tion, improved physical capacity, and reduced mortality among patients with ischemic heart disease, including acute coronary syndrome (ACS) and stable angina pectoris [6]. Coronary revascularisation could hence increase the possibility of return to work [9]. And alertness is warranted in health care, regarding individualised rehabilitation measures, to promote return to work. Nevertheless, some patients might already be on disability pension (DP) at the time of revascularisation and thus, already permanently excluded from the work force. Also, over the last decades, DP has increased in many western countries [10,11]. However, no studies have, so far, investigated the extent of DP at the time of coronary revascularisation–and even less is known about the diagnoses for DP in this patient group. Such knowledge is of importance when planning for what type of rehabilitation measures to offer patients with coronary revascularisation. In general, DP is more common among women [12–22], older individuals [23,24], lower level educated [17,25–29] and foreign-born individuals [30–33]. Whether this also applies for patients undergoing coronary revascularisation is not scientifically known. Results from studies on DP rates could be attrition biased by drop outs, and the generalisability of findings could be affected when only a few clinics are included. Also employment frequency might affect results–if those older than 55 or 60 years are not gainfully employed, and if women are less employed than men, this would imply an age- or gender bias in who applies for DP. As Sweden has one of the highest employment frequencies, also regarding people of higher age and of female gender [34,35], it would be an advantage to base such a study on all coronary revascularisations conducted in Sweden. The aim of this study was to investigate the prevalence of all-cause and diagnosis-specific DP at the time of a first coronary revascularisation, accounting for socio-demographic and medical factors.
Materials and Methods
Ethics Statement
The study population was identified through nationwide registers collected and stored with the consent of the patients. Additional information was collected by linkage of several public na-tional registers. Ethical vetting is always required when using register data in purpose of re-search in Sweden. The ethical vetting is performed by regional ethical review boards and the risk appraisal associated with the Law on Public Disclosure and Secrecy is done by data owners. The ethical review boards can however waive the requirement to consult the data subjects Funding:This work was supported by the Swedish
Research Council for Health, Working Life and Wel-fare (grant number 2007-0728 + 1762;www.fas.se/) and the National School of Research in Caring Sci-ence, Karolinska Institutet (www.ki.se). The funders had no role in study design, data collection and analy-sis, decision to publish, or preparation of the manuscript.
directly to obtain their informed consent, and will often do so if the research is supported by the ethical review board and the data has already been collected in some other context. Accord-ing to these standards in Sweden this project has been evaluated and approved by the Regional Ethical Review Board of Stockholm, Sweden (2006/661-31).
Study population
This population-based register study comprised all the 65,676 (80% men) individuals in Sweden, who within 1994–2006, when aged 30–63 years, had a first CABG (n = 22,959) or PCI (n = 42,717) and did not have old-age pension. The patients were identified using the nationwide quality register for coronary revascularisation SWEDEHEART [3] including infor-mation on patient characteristics, date and type of intervention for all performed coronary revascularisations in Sweden.
Linkage to Nationwide Registers
The information from nationwide registers was linked to each patient using the unique Swedish personal identification number. Information on date, degree and diagnosis of DP was obtained from the Swedish Social Insurance Agency (MiDAS data base). Information on level of education, country of birth, and type of living area was obtained from the Statistics Sweden (LISA register). And, if data was not available in SWEDEHEART, information on diabetes mellitus and indication for intervention was obtained from the Board of Health and Welfare (The National Patient Register).
Outcome
The outcome was having DP at the time of a first CABG or PCI.
Categorisation of variables
DP diagnoses were classified according to International Classification of Diseases version 10 (ICD-10) [36] and categorised into five groups: Cardiovascular diseases (I00-99) (referred as ‘CVD’), mental and behavioural disorders (F00-F99) (‘mental diagnoses’), diseases of the musculoskeletal system and connective tissue (M00-M99) (‘musculoskeletal diagnoses’), all ‘other diagnoses’, and‘no information’. Information about DP diagnoses was not available for most of the DPs granted before the year 1994. Degree of DP was categorised as part- (50%) and full-time DP (>50%). Years on DP before intervention were categorised into3, 4–10,
and 11–35 years. Socio-demographic and medical factors were categorised as follows. Age at intervention: 30–49, 50–54, 55–59, and 60–63 years. Level of education: elementary school (9 years), high school (>9 and12 years), and college/university (>12 years). Country of
Statistical analyses
Descriptive statistics were used to outline study-population characteristics and prevalence of all-cause and diagnosis-specific DP at the time of coronary revascularisation. Crude and ad-justed odds ratios (OR) with 95% confidence interval (CI) for DP at the time of revascularisation were calculated by logistic regression analyses. Significant covariates from the univariable model were included in the multivariable analyses. The ORs were adjusted for covariates in the following models; model I (age), model II (age and level of education), model III (gender), and model IV (all variables included). Most analyses were stratified by gender and type of interven-tion (CABG, PCI).
Social insurance in Sweden
In Sweden, all individuals aged 19–64 years with long-term or permanent work incapacity due to disease or injury can be granted DP for part- or full-time of ordinary working hours. The common age for old-age pension is 65, but it can be obtained earlier. For individuals with no or a low previous income, the DP benefits amount to a minimum level. For those with a previous income, the benefits amount to at least 64% of lost income and up to a certain level.
Results
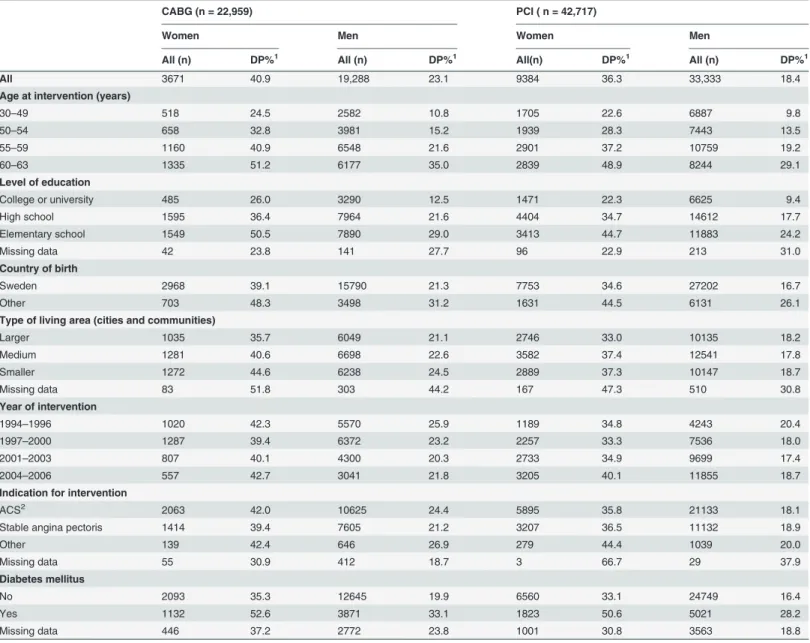
The characteristics of the study population and the prevalence of DP stratified by type of inter-vention and gender are presented inTable 1. Mean age at intervention was 55 years and a ma-jority had at most a high school education, were born in Sweden, and lived in medium-sized cities and smaller communities. Most had their first PCI during year 2004–2006 whereas most CABG procedures were performed before 2001. ACS was the main indication for revascularisation in a majority of the patients (61%). Eighteen percent had diabetes mellitus at the time of revascularisation. The prevalence of DP at the time of revascularisation was 24% and the highest prevalence was found among women with CABG (41%)
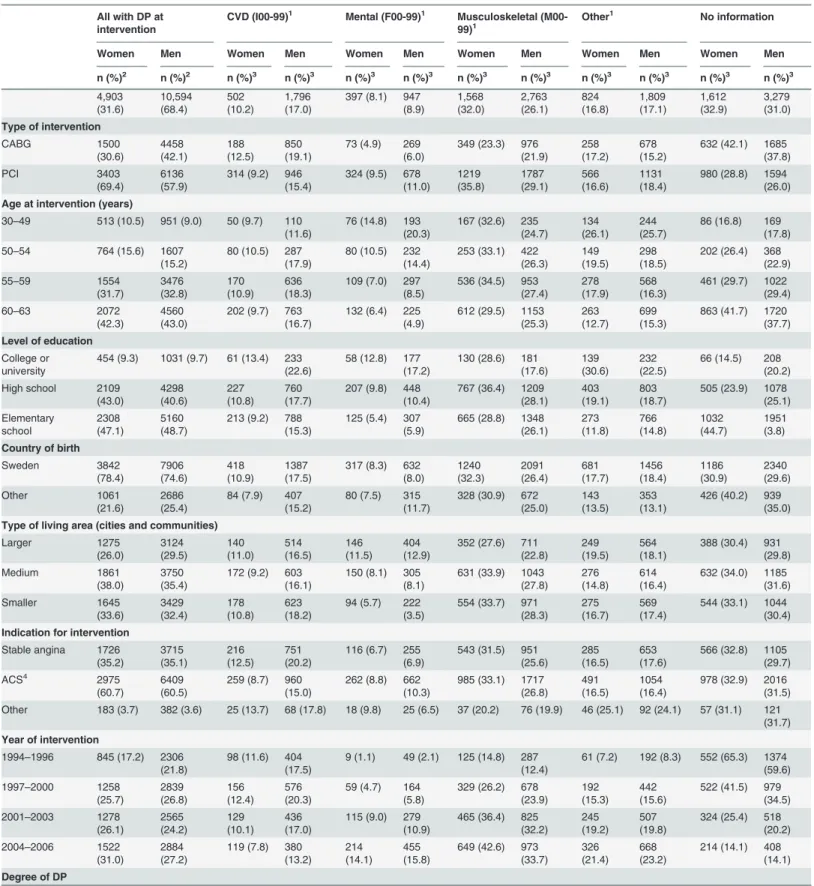
Descriptive data for all-cause and diagnosis-specific DP is presented inTable 2. The largest DP-diagnostic group was musculoskeletal diagnoses (28% of all; and 41% of all with information available on DP diagnoses). This was also the largest diagnostic group in most subgroups. The second largest DP-diagnostic group was CVD (15%; 22% among those with diagnoses). Among those with DP diagnoses, DP due to CVD was most common in men with revascularisation before year 1996. The third largest DP-diagnostic group was mental diagnoses (9%; 13% among those with diagnoses). Musculoskeletal and mental DP diagnoses were about three times more common among the PCI patients compared to CABG. Of all on DP at the time of revascularisation, 89% had full-time DP and 43% were 60–63 years of age. Sixty-two percent had had DP for at least four years before the revascularisation.
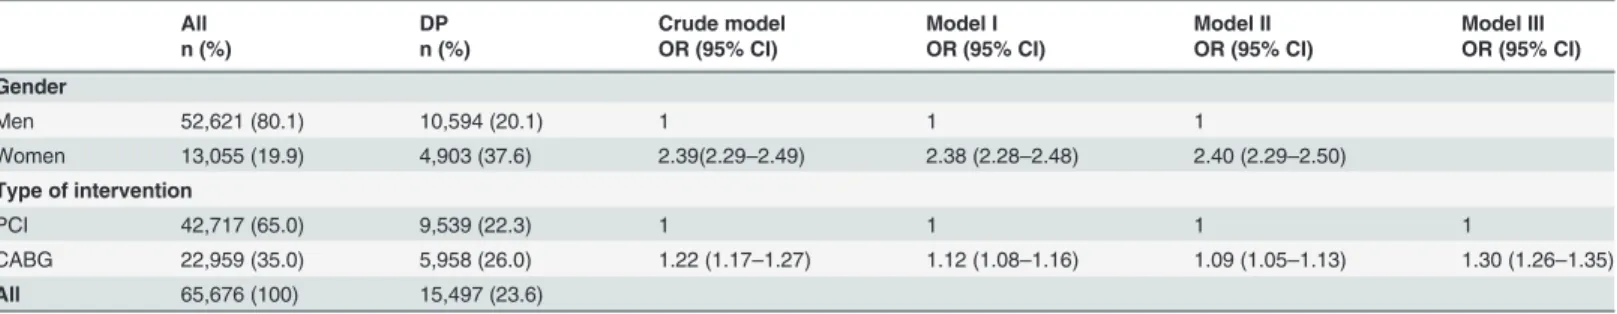
More women (38%) than men (20%) and more CABG patients (26%) than PCI pa-tients (22%) had DP at the time of revascularisation (Table 3). After adjustments for age and level of education, the OR for DP in women compared to men was 2.40 (95% CI: 2.29–2.50). After adjustments for gender, the OR for DP in CABG compared to PCI pa-tients was 1.30 (95% CI: 1.26–1.35). Thus, both gender and type of intervention were of importance for DP, why also the logistic analyses were stratified by gender and type of intervention.
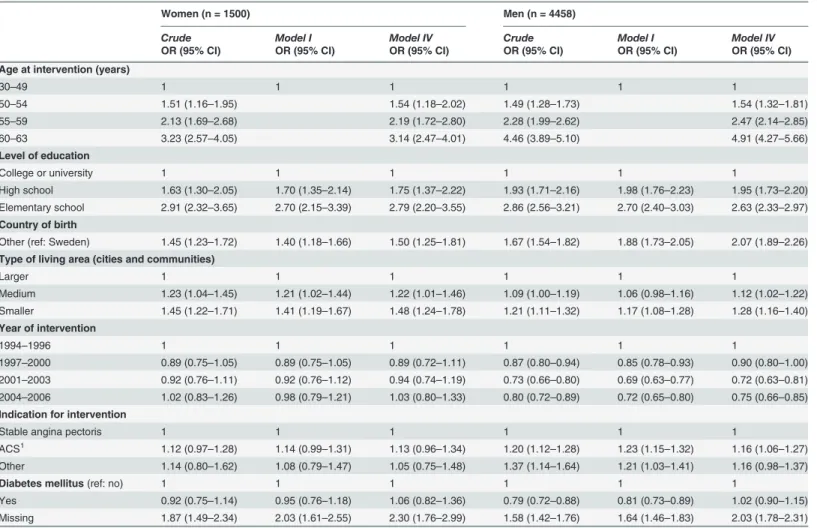
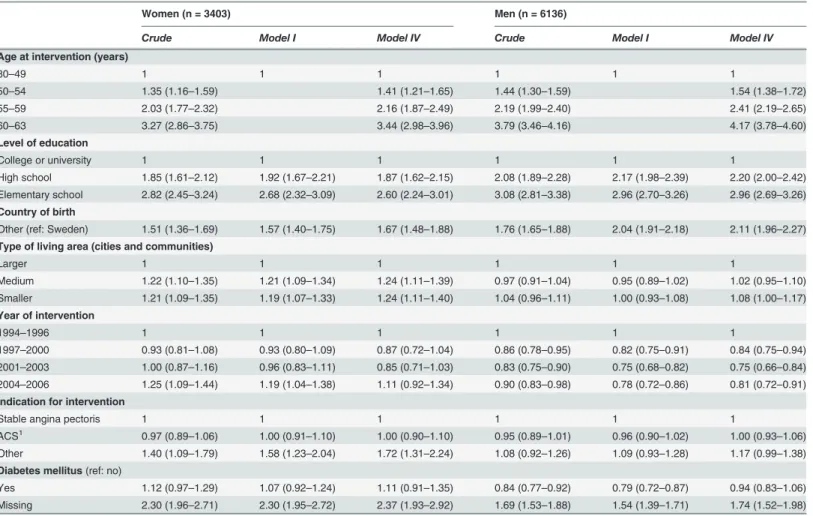
CI: 4.27–5.66) (Table4and5, model IV). Also, patients with elementary or high school com-pared to college/university education, had a higher OR for DP; especially men with PCI and elementary school (OR: 2.96; 95% CI: 2.69–3.26). A higher OR was found among foreign-born patients compared to those born in Sweden; especially men with PCI (OR: 2.11; 95% CI: 1.96– 2.27) and among women with an indication of other diagnoses than ACS or stable angina pec-toris for PCI (OR: 1.72; 95% CI: 1.31–2.24). On the contrary, the OR was lower among men who had their first revascularisation after 1996; lowest in men with CABG in year 2001–2003 (OR: 0.72; 95% CI: 0.63–0.81). There was no significant association between diabetes mellitus and DP at the time of revascularisation.
Table 1. Patient characteristics, stratified by type of intervention and gender, of all patients in Sweden (N = 65,676), 30–63 years of age, with a first coronary artery bypass graft surgery (CABG) or percutaneous coronary intervention (PCI) within the year 1994–2006, and with disability
pension (DP) (n = 15,497) at time of intervention.
CABG (n = 22,959) PCI ( n = 42,717)
Women Men Women Men
All (n) DP%1 All (n) DP%1 All(n) DP%1 All (n) DP%1
All 3671 40.9 19,288 23.1 9384 36.3 33,333 18.4
Age at intervention (years)
30–49 518 24.5 2582 10.8 1705 22.6 6887 9.8
50–54 658 32.8 3981 15.2 1939 28.3 7443 13.5
55–59 1160 40.9 6548 21.6 2901 37.2 10759 19.2
60–63 1335 51.2 6177 35.0 2839 48.9 8244 29.1
Level of education
College or university 485 26.0 3290 12.5 1471 22.3 6625 9.4
High school 1595 36.4 7964 21.6 4404 34.7 14612 17.7
Elementary school 1549 50.5 7890 29.0 3413 44.7 11883 24.2
Missing data 42 23.8 141 27.7 96 22.9 213 31.0
Country of birth
Sweden 2968 39.1 15790 21.3 7753 34.6 27202 16.7
Other 703 48.3 3498 31.2 1631 44.5 6131 26.1
Type of living area (cities and communities)
Larger 1035 35.7 6049 21.1 2746 33.0 10135 18.2
Medium 1281 40.6 6698 22.6 3582 37.4 12541 17.8
Smaller 1272 44.6 6238 24.5 2889 37.3 10147 18.7
Missing data 83 51.8 303 44.2 167 47.3 510 30.8
Year of intervention
1994–1996 1020 42.3 5570 25.9 1189 34.8 4243 20.4
1997–2000 1287 39.4 6372 23.2 2257 33.3 7536 18.0
2001–2003 807 40.1 4300 20.3 2733 34.9 9699 17.4
2004–2006 557 42.7 3041 21.8 3205 40.1 11855 18.7
Indication for intervention
ACS2 2063 42.0 10625 24.4 5895 35.8 21133 18.1
Stable angina pectoris 1414 39.4 7605 21.2 3207 36.5 11132 18.9
Other 139 42.4 646 26.9 279 44.4 1039 20.0
Missing data 55 30.9 412 18.7 3 66.7 29 37.9
Diabetes mellitus
No 2093 35.3 12645 19.9 6560 33.1 24749 16.4
Yes 1132 52.6 3871 33.1 1823 50.6 5021 28.2
Missing data 446 37.2 2772 23.8 1001 30.8 3563 18.8
1Proportion of patients with disability pension at the time of
first coronary revascularisation
2Acute Coronary Syndrome: Non-ST-elevated myocardial infarction or ST-elevated myocardial infarction
Table 2. Frequencies (n) and proportions (%) of disability pension (DP) diagnoses among women and men with afirst coronary revascularisation within the year 1994–2006 (n = 15,497).
All with DP at intervention
CVD (I00-99)1 Mental (F00-99)1 Musculoskeletal
(M00-99)1
Other1 No information
Women Men Women Men Women Men Women Men Women Men Women Men
n (%)2 n (%)2 n (%)3 n (%)3 n (%)3 n (%)3 n (%)3 n (%)3 n (%)3 n (%)3 n (%)3 n (%)3
4,903 (31.6) 10,594 (68.4) 502 (10.2) 1,796 (17.0)
397 (8.1) 947 (8.9) 1,568 (32.0) 2,763 (26.1) 824 (16.8) 1,809 (17.1) 1,612 (32.9) 3,279 (31.0)
Type of intervention
CABG 1500 (30.6) 4458 (42.1) 188 (12.5) 850 (19.1)
73 (4.9) 269 (6.0)
349 (23.3) 976 (21.9)
258 (17.2)
678 (15.2)
632 (42.1) 1685 (37.8)
PCI 3403
(69.4)
6136 (57.9)
314 (9.2) 946 (15.4)
324 (9.5) 678 (11.0) 1219 (35.8) 1787 (29.1) 566 (16.6) 1131 (18.4)
980 (28.8) 1594 (26.0)
Age at intervention (years)
30–49 513 (10.5) 951 (9.0) 50 (9.7) 110
(11.6)
76 (14.8) 193 (20.3)
167 (32.6) 235 (24.7)
134 (26.1)
244 (25.7)
86 (16.8) 169 (17.8)
50–54 764 (15.6) 1607
(15.2)
80 (10.5) 287 (17.9)
80 (10.5) 232 (14.4)
253 (33.1) 422 (26.3)
149 (19.5)
298 (18.5)
202 (26.4) 368 (22.9)
55–59 1554
(31.7) 3476 (32.8) 170 (10.9) 636 (18.3)
109 (7.0) 297 (8.5)
536 (34.5) 953 (27.4)
278 (17.9)
568 (16.3)
461 (29.7) 1022 (29.4)
60–63 2072
(42.3)
4560 (43.0)
202 (9.7) 763 (16.7)
132 (6.4) 225 (4.9)
612 (29.5) 1153 (25.3)
263 (12.7)
699 (15.3)
863 (41.7) 1720 (37.7)
Level of education
College or
university 454 (9.3) 1031 (9.7) 61 (13.4) 233(22.6) 58 (12.8) 177(17.2) 130 (28.6) 181(17.6) 139(30.6) 232(22.5) 66 (14.5) 208(20.2) High school 2109
(43.0) 4298(40.6) 227(10.8) 760(17.7) 207 (9.8) 448(10.4) 767 (36.4) 1209(28.1) 403(19.1) 803(18.7) 505 (23.9) 1078(25.1) Elementary
school 2308(47.1) 5160(48.7) 213 (9.2) 788(15.3) 125 (5.4) 307(5.9) 665 (28.8) 1348(26.1) 273(11.8) 766(14.8) 1032(44.7) 1951(3.8)
Country of birth
Sweden 3842 (78.4) 7906 (74.6) 418 (10.9) 1387 (17.5)
317 (8.3) 632 (8.0) 1240 (32.3) 2091 (26.4) 681 (17.7) 1456 (18.4) 1186 (30.9) 2340 (29.6) Other 1061 (21.6) 2686 (25.4)
84 (7.9) 407 (15.2)
80 (7.5) 315 (11.7)
328 (30.9) 672 (25.0)
143 (13.5)
353 (13.1)
426 (40.2) 939 (35.0)
Type of living area (cities and communities)
Larger 1275 (26.0) 3124 (29.5) 140 (11.0) 514 (16.5) 146 (11.5) 404 (12.9)
352 (27.6) 711 (22.8)
249 (19.5)
564 (18.1)
388 (30.4) 931 (29.8)
Medium 1861
(38.0)
3750 (35.4)
172 (9.2) 603 (16.1)
150 (8.1) 305 (8.1)
631 (33.9) 1043 (27.8)
276 (14.8)
614 (16.4)
632 (34.0) 1185 (31.6) Smaller 1645 (33.6) 3429 (32.4) 178 (10.8) 623 (18.2)
94 (5.7) 222 (3.5)
554 (33.7) 971 (28.3)
275 (16.7)
569 (17.4)
544 (33.1) 1044 (30.4)
Indication for intervention
Stable angina 1726 (35.2) 3715 (35.1) 216 (12.5) 751 (20.2)
116 (6.7) 255 (6.9)
543 (31.5) 951 (25.6)
285 (16.5)
653 (17.6)
566 (32.8) 1105 (29.7)
ACS4 2975
(60.7)
6409 (60.5)
259 (8.7) 960 (15.0)
262 (8.8) 662 (10.3)
985 (33.1) 1717 (26.8)
491 (16.5)
1054 (16.4)
978 (32.9) 2016 (31.5) Other 183 (3.7) 382 (3.6) 25 (13.7) 68 (17.8) 18 (9.8) 25 (6.5) 37 (20.2) 76 (19.9) 46 (25.1) 92 (24.1) 57 (31.1) 121
(31.7)
Year of intervention
1994–1996 845 (17.2) 2306
(21.8) 98 (11.6) 404(17.5) 9 (1.1) 49 (2.1) 125 (14.8) 287(12.4) 61 (7.2) 192 (8.3) 552 (65.3) 1374(59.6) 1997–2000 1258
(25.7) 2839(26.8) 156(12.4) 576(20.3) 59 (4.7) 164(5.8) 329 (26.2) 678(23.9) 192(15.3) 442(15.6) 522 (41.5) 979(34.5) 2001–2003 1278
(26.1) 2565(24.2) 129(10.1) 436(17.0) 115 (9.0) 279(10.9) 465 (36.4) 825(32.2) 245(19.2) 507(19.8) 324 (25.4) 518(20.2) 2004–2006 1522
(31.0) 2884(27.2) 119 (7.8) 380(13.2) 214(14.1) 455(15.8) 649 (42.6) 973(33.7) 326(21.4) 668(23.2) 214 (14.1) 408(14.1)
Degree of DP
Discussion
In this nationwide study we investigated the prevalence of all-cause and diagnosis-specific DP at the time of CABG or PCI within the year 1994–2006, accounting for socio-demographic and medical factors. We found that 24% of the patients had DP, usually for full-time. This means that about a quarter already had left working life at the time of revascularisation. Moreover, in the studied population, the proportion of being on DP in 2004 was almost twice as large (22%) as in the general population aged 30–63 (12%) in 2004 (the year with the, so far, highest DP rate in Sweden) [38]. In the whole working population of OECD countries, the corresponding rates were 6% in 2007, 5% in 1990[39] and in Sweden 9% in 2007 [38].
Although the indication for intervention was cardiac symptoms, musculoskeletal diagnoses was the largest DP-diagnostic group; also in most of the subpopulations. This is also the largest DP-diagnostic group in the general population [9,40–42]. CVD was the second largest DP-diagnostic group (22%), however, the rate of DP due to CVD was much lower in the general population (6%) of Sweden in 2002 [42]. In the general population, mental diagnoses usually
Table 2. (Continued)
All with DP at intervention
CVD (I00-99)1 Mental (F00-99)1 Musculoskeletal
(M00-99)1
Other1 No information
Women Men Women Men Women Men Women Men Women Men Women Men
n (%)2 n (%)2 n (%)3 n (%)3 n (%)3 n (%)3 n (%)3 n (%)3 n (%)3 n (%)3 n (%)3 n (%)3
>50% DP 4375
(89.2)
9391 (88.6)
451 (10.3)
1564 (16.7)
366 (8.4) 875 (9.3)
1360 (31.1)
2397 (25.5)
724 (16.5)
1566 (16.7)
1474 (33.7)
2989 (31.8)
50% DP 516 (10.5) 1186
(11.2)
51 (9.9) 230 (19.4)
31 (6.0) 72 (6.1) 207 (40.1) 366 (30.9)
100 (19.4)
242 (20.4)
127 (24.6) 276 (23.3)
Years on DP before revascularisation
3 1556
(31.7) 4337(40.9) 245(15.7) 1060(24.4) 186(12.0) (10.5)454 652 (41.9) 1408(32.5) 351(22.6) 955(22.0) 122 (7.8) 460(10.6)
4–10 1975
(40.3) 4233(40.0) 195 (9.9) 634(15.0) 147 (7.4) 356(8.4) 673 (34.1) 1104(26.1) 327(16.6) 694(16.4) 633 (32.1) 1445(34.1)
11–35 1372
(28.0) 2024(19.1) 62 (4.5) 102 (5.0) 64 (4.7) 137(6.8) 243 (17.7) 251(12.4) 146(10.6) 160 (7.9) 857 (62.5) 1374(67.9)
1DP-diagnoses according to the International Classi
fication of Diseases (ICD-10)
2gender-speci
fic column percent of all with DP at time of intervention
3gender-speci
fic row percent of all with DP at intervention in the different sub-groups
4Acute Coronary Syndrome: Non-ST-elevated or ST-elevated myocardial infarction.
doi:10.1371/journal.pone.0115540.t002
Table 3. Disability pension (DP) at the time offirst coronary artery bypass graft surgery (CABG) or percutaneous coronary intervention (PCI), frequencies (n), proportions (%), crude and adjusted odds ratio (OR) with 95% confidence intervals (CI), by gender and type of intervention.
All DP Crude model Model I Model II Model III
n (%) n (%) OR (95% CI) OR (95% CI) OR (95% CI) OR (95% CI)
Gender
Men 52,621 (80.1) 10,594 (20.1) 1 1 1
Women 13,055 (19.9) 4,903 (37.6) 2.39(2.29–2.49) 2.38 (2.28–2.48) 2.40 (2.29–2.50)
Type of intervention
PCI 42,717 (65.0) 9,539 (22.3) 1 1 1 1
CABG 22,959 (35.0) 5,958 (26.0) 1.22 (1.17–1.27) 1.12 (1.08–1.16) 1.09 (1.05–1.13) 1.30 (1.26–1.35)
All 65,676 (100) 15,497 (23.6)
Model I = adjusted for age; Model II = adjusted for age and level of education; Model III = adjusted for gender.
was the second largest DP-diagnostic group, e.g. 30% of all DPs in 2002 [42]. However, in this study mental diagnoses was only the third largest group (13%), also in most of the subpopula-tions. Of all with DP, 62% had had DP for at least four years before revascularisation. Thus, long-term DP (marginalisation from the labour market) in itself might be a risk factor for fu-ture CVD, something that requires other studies. There is hardly any scientific knowledge on consequences of being on DP. Some recent studies indicate that DP might be a risk indicator for mortality [43–48], also due to non-lethal DP diagnoses such as musculoskeletal diagnoses.
Regardless of gender, type of intervention or adjustments, and in accordance with previous studies of DP in the general population [17,23–33], we found a higher OR for DP among older patients, among lower level educated; especially men with PCI who almost had a tripled OR for DP, and among those born outside Sweden; especially men with PCI who had a doubled OR for DP at the time of revascularisation.
In line with previous studies of DP [12–22], the studied women were twice as likely as the men to have DP, also after adjustments for age and educational level. This indicates that also other factors were associated with the higher odds for DP in women. There are several theories
Table 4. Crude and adjusted odds ratio (OR) with 95% confidence interval (CI) for disability pension (DP) at time of afirst coronary artery bypass graft surgery (CABG), among women and men, with regard to sociodemographic and medical factors.
Women (n = 1500) Men (n = 4458)
Crude Model I Model IV Crude Model I Model IV
OR (95% CI) OR (95% CI) OR (95% CI) OR (95% CI) OR (95% CI) OR (95% CI)
Age at intervention (years)
30–49 1 1 1 1 1 1
50–54 1.51 (1.16–1.95) 1.54 (1.18–2.02) 1.49 (1.28–1.73) 1.54 (1.32–1.81)
55–59 2.13 (1.69–2.68) 2.19 (1.72–2.80) 2.28 (1.99–2.62) 2.47 (2.14–2.85)
60–63 3.23 (2.57–4.05) 3.14 (2.47–4.01) 4.46 (3.89–5.10) 4.91 (4.27–5.66)
Level of education
College or university 1 1 1 1 1 1
High school 1.63 (1.30–2.05) 1.70 (1.35–2.14) 1.75 (1.37–2.22) 1.93 (1.71–2.16) 1.98 (1.76–2.23) 1.95 (1.73–2.20)
Elementary school 2.91 (2.32–3.65) 2.70 (2.15–3.39) 2.79 (2.20–3.55) 2.86 (2.56–3.21) 2.70 (2.40–3.03) 2.63 (2.33–2.97)
Country of birth
Other (ref: Sweden) 1.45 (1.23–1.72) 1.40 (1.18–1.66) 1.50 (1.25–1.81) 1.67 (1.54–1.82) 1.88 (1.73–2.05) 2.07 (1.89–2.26)
Type of living area (cities and communities)
Larger 1 1 1 1 1 1
Medium 1.23 (1.04–1.45) 1.21 (1.02–1.44) 1.22 (1.01–1.46) 1.09 (1.00–1.19) 1.06 (0.98–1.16) 1.12 (1.02–1.22) Smaller 1.45 (1.22–1.71) 1.41 (1.19–1.67) 1.48 (1.24–1.78) 1.21 (1.11–1.32) 1.17 (1.08–1.28) 1.28 (1.16–1.40)
Year of intervention
1994–1996 1 1 1 1 1 1
1997–2000 0.89 (0.75–1.05) 0.89 (0.75–1.05) 0.89 (0.72–1.11) 0.87 (0.80–0.94) 0.85 (0.78–0.93) 0.90 (0.80–1.00) 2001–2003 0.92 (0.76–1.11) 0.92 (0.76–1.12) 0.94 (0.74–1.19) 0.73 (0.66–0.80) 0.69 (0.63–0.77) 0.72 (0.63–0.81) 2004–2006 1.02 (0.83–1.26) 0.98 (0.79–1.21) 1.03 (0.80–1.33) 0.80 (0.72–0.89) 0.72 (0.65–0.80) 0.75 (0.66–0.85)
Indication for intervention
Stable angina pectoris 1 1 1 1 1 1
ACS1 1.12 (0.97–1.28) 1.14 (0.99–1.31) 1.13 (0.96–1.34) 1.20 (1.12–1.28) 1.23 (1.15–1.32) 1.16 (1.06–1.27)
Other 1.14 (0.80–1.62) 1.08 (0.79–1.47) 1.05 (0.75–1.48) 1.37 (1.14–1.64) 1.21 (1.03–1.41) 1.16 (0.98–1.37)
Diabetes mellitus(ref: no) 1 1 1 1 1 1
Yes 0.92 (0.75–1.14) 0.95 (0.76–1.18) 1.06 (0.82–1.36) 0.79 (0.72–0.88) 0.81 (0.73–0.89) 1.02 (0.90–1.15) Missing 1.87 (1.49–2.34) 2.03 (1.61–2.55) 2.30 (1.76–2.99) 1.58 (1.42–1.76) 1.64 (1.46–1.83) 2.03 (1.78–2.31)
Model I = adjusted for age. Model IV = adjusted for all variables included.
1Acute Coronary Syndrome: Non-ST-elevated or ST-elevated myocardial infarction.
on reasons for the higher DP rates in women [49,50]. Possible explanations regarding this pa-tient group are women’s higher age at the diagnosis of cardiovascular disease [51] and that women who undergo CABG have more co-morbidity and smaller coronary arteries than men [2]. Moreover, women’s higher sick-leave rate [52], different work demands, and possible gender bias in health care [49,50] could be contributing factors to the higher DP rate in women.
Patients above 50 years of age had, as expected, a higher odds for DP; men, 60–63 years of age, had more than a fourfold OR for DP; this is only slightly above that of men in the general population of that age (30 vs 27%) [38].
This is the first study of DP prevalence at the time of first coronary revascularisation among working-aged women and men. In line with previous studies on DP in the general population [30–33], foreign-born individuals had a higher DP-rate than those born in Sweden, even after adjustments for other socio-demographic factors. However, in order to gain more knowledge on these associations, further specific studies are needed.
Diabetes mellitus was not associated with a higher OR for DP at time of revascularisation. Nevertheless, it is a risk indicator for future DP and long-term sick leave after coronary
Table 5. Crude and adjusted odds ratio (OR) with 95% confidence intervals (CI) for disability pension (DP) at time of afirst percutaneous coronary intervention (PCI), among women and men, with regard to socio-demographic and medical factors.
Women (n = 3403) Men (n = 6136)
Crude Model I Model IV Crude Model I Model IV
Age at intervention (years)
30–49 1 1 1 1 1 1
50–54 1.35 (1.16–1.59) 1.41 (1.21–1.65) 1.44 (1.30–1.59) 1.54 (1.38–1.72)
55–59 2.03 (1.77–2.32) 2.16 (1.87–2.49) 2.19 (1.99–2.40) 2.41 (2.19–2.65)
60–63 3.27 (2.86–3.75) 3.44 (2.98–3.96) 3.79 (3.46–4.16) 4.17 (3.78–4.60)
Level of education
College or university 1 1 1 1 1 1
High school 1.85 (1.61–2.12) 1.92 (1.67–2.21) 1.87 (1.62–2.15) 2.08 (1.89–2.28) 2.17 (1.98–2.39) 2.20 (2.00–2.42) Elementary school 2.82 (2.45–3.24) 2.68 (2.32–3.09) 2.60 (2.24–3.01) 3.08 (2.81–3.38) 2.96 (2.70–3.26) 2.96 (2.69–3.26)
Country of birth
Other (ref: Sweden) 1.51 (1.36–1.69) 1.57 (1.40–1.75) 1.67 (1.48–1.88) 1.76 (1.65–1.88) 2.04 (1.91–2.18) 2.11 (1.96–2.27)
Type of living area (cities and communities)
Larger 1 1 1 1 1 1
Medium 1.22 (1.10–1.35) 1.21 (1.09–1.34) 1.24 (1.11–1.39) 0.97 (0.91–1.04) 0.95 (0.89–1.02) 1.02 (0.95–1.10) Smaller 1.21 (1.09–1.35) 1.19 (1.07–1.33) 1.24 (1.11–1.40) 1.04 (0.96–1.11) 1.00 (0.93–1.08) 1.08 (1.00–1.17)
Year of intervention
1994–1996 1 1 1 1 1 1
1997–2000 0.93 (0.81–1.08) 0.93 (0.80–1.09) 0.87 (0.72–1.04) 0.86 (0.78–0.95) 0.82 (0.75–0.91) 0.84 (0.75–0.94) 2001–2003 1.00 (0.87–1.16) 0.96 (0.83–1.11) 0.85 (0.71–1.03) 0.83 (0.75–0.90) 0.75 (0.68–0.82) 0.75 (0.66–0.84)
2004–2006 1.25 (1.09–1.44) 1.19 (1.04–1.38) 1.11 (0.92–1.34) 0.90 (0.83–0.98) 0.78 (0.72–0.86) 0.81 (0.72–0.91)
Indication for intervention
Stable angina pectoris 1 1 1 1 1 1
ACS1 0.97 (0.89
–1.06) 1.00 (0.91–1.10) 1.00 (0.90–1.10) 0.95 (0.89–1.01) 0.96 (0.90–1.02) 1.00 (0.93–1.06)
Other 1.40 (1.09–1.79) 1.58 (1.23–2.04) 1.72 (1.31–2.24) 1.08 (0.92–1.26) 1.09 (0.93–1.28) 1.17 (0.99–1.38)
Diabetes mellitus(ref: no)
Yes 1.12 (0.97–1.29) 1.07 (0.92–1.24) 1.11 (0.91–1.35) 0.84 (0.77–0.92) 0.79 (0.72–0.87) 0.94 (0.83–1.06) Missing 2.30 (1.96–2.71) 2.30 (1.95–2.72) 2.37 (1.93–2.92) 1.69 (1.53–1.88) 1.54 (1.39–1.71) 1.74 (1.52–1.98)
Model I = adjusted for age. Model IV = adjusted for all variables.
1Acute Coronary Syndrome: Non-ST-elevated or ST-elevated myocardial infarction.
revascularisation [53,54]. This finding could be of importance in the rehabilitation of patients with diabetes mellitus at time of coronary revascularisation.
Strengths and limitations
This is the first nationwide, population-based study that investigates the prevalence of all-cause and diagnosis-specific DP at the time of coronary revascularisation among working aged women and men. The main strengths are the large study population, that all patients, aged 30–63 years, with no on old-age pension, and with a first coronary revascularisation in Sweden between 1994–2006, were included, and the high quality of data linked from several registers [55]. Although most studies on DP do not have access to information on DP diagno-ses at all, limitations are the non-available information on DP-diagnodiagno-ses for DPs granted before 1994 and the missing data on diabetes mellitus. Diabetes data was collected by the physi-cians asking the patients a question at the time of the intervention. The reason for this missing data is unclear, but a likely explanation is that physicians did not register information if the patient did not have diabetes.
Conclusions
About a quarter of patients aged 30–63 years already had DP at the time of their first coronary revascularisation, most often due to musculoskeletal DP diagnoses. More than half had had DP for at least four years before intervention. DP was associated with female gender, older age, lower educational level, and being born outside Sweden.
Author Contributions
Conceived and designed the experiments: KZ M. Voss KA TI KP NH M. Vaez. Performed the experiments: KZ M. Voss M. Vaez. Analyzed the data: KZ M. Voss M. Vaez. Contributed re-agents/materials/analysis tools: KZ M. Voss KA TI KP NH M. Vaez. Wrote the paper: KZ M. Voss KA TI KP NH M. Vaez. Interpretation of data: KZ M. Voss KA TI KP NH M. Vaez. Re-vised the manuscript critically for important intellectual content: KZ M. Voss KA TI KP NH M. Vaez.
References
1. Bravata DM, Gienger AL, McDonald KM, Sundaram V, Perez MV, et al. (2007) Systematic review: the comparative effectiveness of percutaneous coronary interventions and coronary artery bypass graft surgery. Ann Intern Med 147: 703–716. doi:10.7326/0003-4819-147-10-200711200-00185PMID:
17938385
2. Hammar N, Sandberg E, Larsen FF, Ivert T (1997) Comparison of early and late mortality in men and women after isolated coronary artery bypass graft surgery in Stockholm, Sweden, 1980 to 1989. J Am Coll Cardiol 29: 659–664. doi:10.1016/S0735-1097(96)00531-1PMID:9060908
3. Jernberg T, Attebring MF, Hambraeus K, Ivert T, James S, et al. (2010) The Swedish Web-system for Enhancement and Development of Evidence-based care in Heart disease Evaluated According to Recommended Therapies (SWEDEHEART). Heart 96: 1617–1621. doi:10.1136/hrt.2010.198804 PMID:20801780
4. Norheim A, Segadal L (2011) Relative survival after CABG surgery is poorer in women and in patients younger than 70 years at surgery. Scand Cardiovasc J 45: 247–251. doi:10.3109/14017431.2011.
582139PMID:21604963
5. Pilote L, Dasgupta K, Guru V, Humphries KH, McGrath J, et al. (2007) A comprehensive view of sex-specific issues related to cardiovascular disease. CMAJ 176: 1–44. doi:10.1503/cmaj.051455 PMID:17353516
7. Yusuf S, Zucker D, Peduzzi P, Fisher LD, Takaro T, et al. (1994) Effect of coronary artery bypass graft surgery on survival: overview of 10-year results from randomised trials by the Coronary Artery Bypass Graft Surgery Trialists Collaboration. Lancet 344: 563–570. doi:10.1016/S0140-6736(94)91963-1 PMID:7914958
8. (2009) Årsrapport SWEDEHEART 2008.(Yearly report, SWEDEHEART 2008) (In Swedish). Uppsala Clinical Research Center. Available:http://www.ucr.uu.se/swedeheart/index.php/arsrapporter. Accessed 4 July 2014.
9. Perk J, Alexanderson K (2004) Swedish Council on Technology Assessment in Health Care (SBU). Chapter 8. Sick leave due to coronary artery disease or stroke. Scand J Public Health Suppl 63: 181– 206. doi:10.1080/14034950410021880PMID:15513657
10. Alexanderson K, Norlund A. (2004) Swedish Council on Technology Assessment in Health Care (SBU). Chapter 1. Aim, background, key concepts regulations, and current statistics. Scand J Public Health 32 (suppl 63): 12–30. doi:10.1080/14034950410021808PMID:15513650
11. Henderson M, Glozier N, Holland Elliot K (2005) Long term sickness absence. BMJ 330: 802–803. doi:
10.1136/bmj.330.7495.802PMID:15817531
12. Albertsen K, Lund T, Christensen KB, Kristensen TS, Villadsen E (2007) Predictors of disability pension over a 10-year period for men and women. Scand J Public Health 35: 78–85. doi:10.1080/
14034940600858474PMID:17366091
13. Alexanderson KAE, Borg KE, Hensing GKE (2005) Sickness absence with low-back, shoulder, or neck diagnoses: An 11-year follow-up regarding gender differences in sickness absence and disability pension. Work 25: 115–124. PMID:16131741
14. Borg K, Hensing G, Alexanderson K (2004) Risk factors for disability pension over 11 years in a cohort of young persons initially sick-listed with low back, neck, or shoulder diagnoses. Scand J Public Health 32: 272–278. doi:10.1080/14034940310019524PMID:15370767
15. Borg K, Hensing G, Alexanderson K (2001) Predictive factors for disability pension—an 11-year follow up of young persons on sick leave due to neck, shoulder, or back diagnoses. Scand J Public Health 29: 104–112. doi:10.1177/14034948010290020701PMID:11484862
16. Claussen B, Dalgard OS (2009) Disability pensioning: the gender divide can be explained by occupa-tion, income, mental distress and health. Scand J Public Health 37: 590–597. doi:10.1177/
1403494809105795PMID:19535405
17. Gjesdal S, Bratberg E, Maeland JG (2011) Gender differences in disability after sickness absence with musculoskeletal disorders: five-year prospective study of 37,942 women and 26,307 men. BMC Musculoskelet Disord 12: 37. doi:10.1186/1471-2474-12-37PMID:21299856
18. Gjesdal S, Lie RT, Maeland JG (2004) Variations in the risk disability pension in Norway 1970–99. Scand J Public Health: 340–348. doi:10.1080/14034940410029487PMID:15513666
19. Gjesdal S, Ringdal PR, Haug K, Maeland JG (2004) Predictors of disability pension in long-term sick-ness absence: results from a population-based and prospective study in Norway 1994–1999. Eur J Public Health 14: 398–405. doi:10.1093/eurpub/14.4.398PMID:15542877
20. Hansson T, Jensen I (2004) Sickness absence due to back and neck disorders. Scandinavian J Public Health 32: 109–151. doi:10.1080/14034950410021862PMID:15513655
21. Krokstad S, Johnsen R, Westin S (2002) Social determinants of disability pension: a 10 year follow-up of 62 000 people in a Norwegian county population. Int J Epidemiol 31: 1183–1191. doi:10.1093/ije/ 31.6.1183PMID:12540720
22. (2010) Sickness, disability and work: Breaking the barriers: Sweden. OECD. Available:http://www.
oecd.org/social/soc/sicknessdisabilityandworkbreakingthebarrierssweden-willtherecentreformsmakeit. htm. Accessed: 4 July 2014.
23. Allebeck P, Mastekaasa A (2004) Swedish Council on Technology Assessment in Health Care (SBU). Chapter 5. Risk factors for sick leave—general studies. Scand J Public Health 32 (suppl 63): 49–108. doi:10.1080/14034950410021853PMID:15513654
24. Karlsson N, Carstensen J, Gjesdal S, Alexanderson K (2008) Risk factors for disability pension in a population-based cohort of men and women on long-term sick leave in Sweden. Eur J Public Health 18: 224–231. doi:10.1093/eurpub/ckm128PMID:18245150
25. Gjesdal S, Bratberg E (2002) The role of gender in long-term sickness absence and transition to perma-nent disability benefits. Eur J Public Health: 180–186. doi:10.1093/eurpub/12.3.180PMID:12232956 26. Jensen LD, Ryom PK, Christensen MV, Andersen JH (2012) Differences in risk factors for voluntary
early retirement and disability pension: a 15-year follow-up in a cohort of nurses’aides. BMJ Open 2. doi:10.1136/bmjopen-2012-000991PMID:23148337
absence of obstructive coronary artery disease. Eur Heart J 34: 3294–3303. doi:10.1093/eurheartj/ eht395PMID:24071763
28. Ropponen A, Silventoinen K, Svedberg P, Alexanderson K, Koskenvuo K, et al. (2011) Health-related risk factors for disability pensions due to musculoskeletal diagnoses: a 30-year Finnish twin cohort study. Scand J Public Health 39: 839–848. doi:10.1177/1403494811418283PMID:21893608 29. Ostby KA, Orstavik RE, Knudsen AK, Reichborn-Kjennerud T, Mykletun A (2011) Health problems
account for a small part of the association between socioeconomic status and disability pension award. Results from the Hordaland Health Study. BMC Public Health 11: 12. doi:10.1186/1471-2458-11-12
PMID:21210992
30. Beckman A, Hakansson A, Rastam L, Lithman T, Merlo J (2006) The role country of birth plays in re-ceiving disability pensions in relation to patterns of health care utilisation and socioeconomic differ-ences: a multilevel analysis of Malmo, Sweden. BMC Public Health 6: 71. doi: 10.1186/1471-2458-6-71PMID:16542459
31. Johansson B, Helgesson M, Lundberg I, Nordquist T, Leijon O, et al. (2012) Work and health among immigrants and native Swedes 1990–2008: a register-based study on hospitalization for common potentially work-related disorders, disability pension and mortality. BMC Public Health 12: 845. doi:10.1186/1471-2458-12-845PMID:23039821
32. Claussen B, Smeby L, Bruusgaard D (2012) Disability pension rates among immigrants in Norway. J Immigr Minor Health 14: 259–263. doi:10.1007/s10903-010-9430-9PMID:21188530
33. Osterberg T, Gustafsson B (2006) Disability pension among immigrants in Sweden. Soc Sci Med 63: 805–816. doi:10.1016/j.socscimed.2006.02.009PMID:16635540
34. (2014) OECD Labour Market Statistics: Labour force statistics by sex and age, OECD Employment and Labour Market Statistics (database). DOI: 10.1787/data-00309-en).
35. (2014) OECD Better Life Index.http://www.oecdbetterlifeindex.org/countries/sweden/
36. WHO (2010) International Classification of Diseases and Related Health Problems, Tenth Revision (ICD-10). World Health Organization.Available:http://apps.who.int/classifications/icd10/browse/2010/ en. Accessed: 14 July 2014.
37. Samuelsson A, Ropponen A, Alexanderson K, Lichtenstein P, Svedberg P (2012) Disability pension among Swedish twins—prevalence over 16 years and associations with sociodemographic factors in 1992. J Occup Environ Med 54: 10–16. doi:10.1097/JOM.0b013e31823d86d5PMID:22157805
38. (2014) Sjukersättning (Disability pension)(In Swedish). Försäkringskassan Available:http://www. forsakringskassan.se. Accessed: 4 July 2014.
39. (2009) OECD Employment Outlook 2009 Tackling the Jobs Crisis.
40. (2014) Social Insurance in Figures 2012. Swedish Social Insurance Agency. Available:http://www.
forsakringskassan.se/wps/wcm/connect/3107947a-6e12-4dcc-b1a6-e952a289ea95/sfis+2014-e.pdf? MOD=AJPERES. Accessed: 4 July 2014
41. Hamalainen H, Maki J, Virta L, Keskimaki I, Mahonen M, et al. (2004) Return to work after first myocardial infarction in 1991–1996 in Finland. Eur J Public Health 14: 350–353. doi:10.1093/eurpub/
14.4.350PMID:15542868
42. (2004) Sjukdomar som orsakat pensionering (Disability pension diagnoses)(In Swedish). Riksförsäkringsverket. Is-I 2004:3
43. Gjesdal S, Haug K, Ringdal P, Maeland JG, Hagberg J, et al. (2009) Sickness absence with musculo-skeletal or mental diagnoses, transition into disability pension and all-cause mortality: A 9-year pro-spective cohort study. Scand J Public Health 37: 387–394. doi:10.1177/1403494809103994PMID:
19324926
44. Gjesdal S, Svedberg P, Hagberg J, Alexanderson K (2009) Mortality among disability pensioners in Norway and Sweden 1990–96: Comparative prospective cohort study. Scand J Public Health 37: 168–175. doi:10.1177/1403494808100937PMID:19179451
45. Gjesdal S, Maeland JG, Svedberg P, Hagberg J, Alexanderson K (2008) Role of diagnoses and socio-economic status in mortality among disability pensioners in Norway—a population-based cohort study. Scand J Work Environ Health 34: 479–482. doi:10.5271/sjweh.1286PMID:19137210
46. Jonsson U, Alexanderson K, Kjeldgard L, Westerlund H, Mittendorfer-Rutz E (2013) Diagnosis-specific disability pension predicts suicidal behaviour and mortality in young adults: a nationwide prospective cohort study. BMJ Open 3:e002286. doi:10.1136/bmjopen-2012-002286PMID:23396561
48. Wallman T, Wedel H, Johansson S, Rosengren A, Eriksson H, et al. (2006) The prognosis for individu-als on disability retirement. An 18-year mortality follow-up study of 6887 men and women sampled from the general population. BMC Public Health 6: 103. doi:10.1186/1471-2458-6-103PMID:16630360
49. Alexanderson K, Norlund A (2004) Swedish Council on Technology Assessment in Health Care (SBU). Chapter 1. Aim, backround, key concepts regulations, and current statistics. Scand J Public Health 32: 12–30. doi:10.1080/14034950410021808PMID:15513650
50. Kilbom Å, Messing K, Bildt Thorbjörnsson C, Arbetslivsinstitutet (1998) Women’s health at work. Solna: National Institute for Working Life (Arbetslivsinstitutet). 321 s. ([328] s., s. 311–321) p.
51. Stramba-Badiale M, Fox KM, Priori SG, Collins P, Daly C, et al. (2006) Cardiovascular diseases in women: a statement from the policy conference of the European Society of Cardiology. Eur Heart J 27: 994–1005. doi:10.1093/eurheartj/ehi819PMID:16522654
52. Allebeck P, Mastekaasa A (2004) Swedish Council on Technology Assessment in Health Care (SBU). Chapter 5. Causes of sickness absence: research approaches and explanatory models. Scand J Public Health 32 (suppl 63): 36–43. doi:10.1080/14034950410021835PMID:15513652
53. Voss M, Ivert T, Pehrsson K, Hammar N, Alexanderson K, et al. (2012) Sickness absence following coronary revascularisation. A national study of women and men of working age in Sweden 1994–2006. PLoS One 7: e40952. doi:10.1371/journal.pone.0040952PMID:22848415
54. Zetterstrom K, Vaez M, Alexanderson K, Ivert T, Pehrsson K, et al. (2014) Disability pension after coro-nary revascularization: a prospective nationwide register-based Swedish cohort study. Eur J Prev Cardiol. DOI: 10.1177/2047487313518472