Lagoon Determined by Mass Balance and Stable Isotope
Approaches
Tomohiro Komorita1,2*, Rumiko Kajihara1, Hiroaki Tsutsumi2, Seiichiro Shibanuma1, Toshiro Yamada3, Shigeru Montani1
1Graduate School of Environmental Science, Hokkaido University, Sapporo, Japan,2Faculty of Environmental and Symbiotic Science, Prefectural University of Kumamoto, Tsukide, Kumamoto, Japan,3Nishimuragumi Co. Ltd., Hokkaido, Japan
Abstract
The relationship between the food demand of a clam population (Ruditapes philippinarum(Adams & Reeve 1850)) and the isotopic contributions of potential food sources (phytoplankton, benthic diatoms, and organic matter derived from the sediment surface, seagrass, and seaweeds) to the clam diet were investigated. In particular, we investigated the manner in which dense patches of clams with high secondary productivity are sustained in a coastal lagoon ecosystem (Hichirippu Lagoon) in Hokkaido, Japan. Clam feeding behavior should affect material circulation in this lagoon owing to their high secondary productivity (ca. 130 g C m22yr21). Phytoplankton were initially found to constitute 14–77% of the clam diet, although phytoplankton nitrogen content (1.79–4.48 kmol N) and the food demand of the clam (16.2 kmol N d–1) suggest that phytoplankton can constitute only up to 28% of clam dietary demands. However, use of isotopic signatures alone may be misleading. For example, the contribution of microphytobenthos (MPB) were estimated to be 0–68% on the basis of isotopic signatures but was subsequently shown to be 35613% (mean6S.D.) and 6464% (mean6S.D.) on the basis of phytoplankton biomass and clam food demand respectively, suggesting that MPB are the primary food source for clams. Thus, in the present study, the abundant MPB in the subtidal area appear to be a key food source for clams, suggesting that these MPB may sustain the high secondary production of the clam.
Citation:Komorita T, Kajihara R, Tsutsumi H, Shibanuma S, Yamada T, et al. (2014) Food Sources forRuditapes philippinarumin a Coastal Lagoon Determined by Mass Balance and Stable Isotope Approaches. PLoS ONE 9(1): e86732. doi:10.1371/journal.pone.0086732
Editor:Arga Chandrashekar Anil, CSIR- National institute of oceanography, India
ReceivedJune 20, 2013;AcceptedDecember 15, 2013;PublishedJanuary 28, 2014
Copyright:ß2014 Komorita et al. This is an open-access article distributed under the terms of the Creative Commons Attribution License, which permits unrestricted use, distribution, and reproduction in any medium, provided the original author and source are credited.
Funding:This study was funded by MEXT Grants-in-Aid for Scientific Research, Nos. 22380102 (to SM) and 15201001 (to SM). The funders had no role in study design, data collection and analysis, decision to publish, or preparation of the manuscript.
Competing Interests:Toshiro Yamada is employee of Nishimuragumi Co. Ltd. This does not alter the authors’ adherence to all the PLOS ONE policies on sharing data and materials.
* E-mail: komorita@pu-kumamoto.ac.jp
Introduction
Suspension-feeding bivalves occurring in coastal waters and on tidal flats often establish high-density populations with extremely large standing stocks of biomass (i.e. over several kilograms in wet weight per square meter) and exhibit much higher productivity than other common members of macrobenthic communities. For example, the annual secondary productivity of dense patches of mussels,Mytilus edulis(L. 1758), reached 11 MJ m22yr21(275 g C m22yr21, using 0.025 g C KJ–1 based on Brey [1]) in the sublittoral zone at Bellevue, Newfoundland, Canada [2], whereas that of surf clams (Donax serra(Ro¨ding 1798)) inhabiting the highly exposed sandy beaches of Namibia was reported to be 167–637 g ash free dry mass (AFDM) m22yr21(81.2–310 g C m22yr21 ,us-ing 0.486 g C gAFDM–1 based on Brey [1]) [3]. Moreover, the high secondary productivity of suspension-feeding bivalves corre-sponds to the range of primary productivity (165–320 g C m22yr21[4–6]) of microalgae that are suspended in the water in which the bivalves live, including phytoplankton and microphy-tobenthos (MPB); these microalgae are a primary source of food for the bivalves.
Based on the rate of conversion of food to somatic growth in invertebrates, which is typically assumed to be 20% [7], the
amount of food consumed by suspension-feeding bivalves should be at least five times greater than the secondary productivity for the same population. Therefore, such bivalves require efficient mechanisms to allow the collection of sufficient food from the surrounding environment to sustain their high secondary tivities. However, the relationship between the secondary produc-tivity of suspension-feeding bivalves and the availability of primarily produced organic matter such as phytoplankton and MPB remains poorly understood [8,9].
land-use characteristics within catchments [15], both of which can effect changes in the food supply [16]. Thus, the relative contributions of phytoplankton and MPB to the diet of R. philippinarummay simply be dependent on their relative availability [16–18].
The proportional contribution of different food sources to the diet of organisms is typically determined using only isotopic mass balance, which assesses the quality of diet components. Quanti-tative estimation of the food demand of dense patches of suspension-feeding bivalves has rarely been attempted with reference to the contributions of different food sources (i.e. the quantity of diet components). However, adopting such a quanti-tative approach is important for the precise estimation of material circulation via suspension-feeding bivalves, and this can allow a more realistic determination of the contribution of each food source.
The present study was conducted as part of a long-term research project that aimed to quantify population dynamics and associated energy and/or material flows at various trophic levels in the coastal lagoon ecosystem of Hichirippu Lagoon, located in the eastern part of Hokkaido, northern Japan. On the tidal flats of this lagoon, R. philippinarum constitutes one of the dominant macro-benthic communities, and its biomass often exceeds 265 g dry weight (DW) m22 (approximately 5 kg wet weight (WW) m22 using 0.053 gDW gWW–1) [19]. Abundant primarily produced organic matter is required to sustain the secondary productivity of dense patches of the clam; such matter is available for suspension feeding in the water overlying the sediment. Our recent study revealed that the areal biomass of MPB occurring in the surface layer of the sediment (i.e. within 0.5 cm of the surface) is about 100 times greater than the biomass of phytoplankton contained in the water column up to a depth of about 1 m during high tide in summer [19]. Therefore, both phytoplankton and MPB are likely available as primary food resources for clams; however, their availability varies seasonally. Moreover, through their suspension-feeding activities, clams exert a considerable influence on the flow of energy and materials between the primary (i.e. the microalgae) and dominant secondary (i.e. the clams themselves) producers in the tidal flat ecosystem.
In the present study, field surveys to monitor the physicochem-ical environmental conditions of water and sediment and performed quantitative sampling of macrobenthic animals
includ-ing dense patches of the clam,R. philippinarum, were conducted between February 2005 and April 2006. The observed seasonal fluctuations in the abundance and biomass of the macrobenthic organisms and estimate the secondary productivity of the clam population for the entire tidal flat area in the lagoon were described. Furthermore, we compare the food demand of the clams to the amount of potential food sources (phytoplankton, benthic diatoms, and organic matter derived from the sediment surface, seagrass, and seaweeds) and the stable carbon and nitrogen isotope ratios of the clams with those of potential food sources both quantitatively and qualitatively. Finally, how the dense patches and high secondary productivity of the clam population are sustained in the tidal flat ecosystem of Hichirippu Lagoon is discussed.
Materials and Methods
Study Area
Hichirippu Lagoon bordering the Pacific Ocean in Hokkaido, Japan (44u03’ N, 145u03’ E, Figure 1) covers an area of approximately 3.56 km2 and is shallow (mean water depth: ,1 m) and brackish. The maximum tidal flow at the entrance to the lagoon reaches approximately 40 cm s21 during spring tide [19], and the flow direction is primarily from northwest to southeast. Freshwater has a relatively small effect on the water budget, ranging from 0.9 to 8.0% of total volume, and salinity ranges between 27.5–34.1 throughout the year [20]. Temperature of the surface sediment (approximately 5 cm depth) ranges from –9.5uC to 19.7uC at a tidal flat station [21]. The sediment in the subtidal area of the lagoon is muddy sand with the mud (less than 63mm in particle diameter) content ranging between 8.7 and 28.1% [22]. At extreme low water spring tides, the area of the tidal flat exposed reaches approximately 0.19 km2; this represents around 5.3% of the total lagoon area. These tidal flats have typically been used as fishery sites to harvest the clam, R philippinarum, with 30–92 metric tons in wet weight of clam harvested per year during 1998–2004.
Sampling Procedures
Five sampling stations on the tidal flats (stations A – E) to represent clam habitats and 16 stations (stations 0–15) in the subtidal area to represent a reservoir of food supply were selected Figure 1. Study area and locations of sampling stations.The oval and rectangular grey areas represent naturally occurring (stations A and B) and artificial tidal flats (the other stations), respectively.
(Figure 1). Quantitative sampling of macrobenthic animals were conducted and the concentration of chlorophyll-a (Chl-a) and organic matter in the surface sediment were measured at the tidal flat stations and Chl-aconcentration in the water column and at the sediment surface were also monitored at the subtidal stations. This monitoring was conducted between February 2005 and April 2006, with monthly sampling from April to October and bimonthly sampling from December to April. Surface water samples were collected during flood tide. At each tidal flat station, sediment samples for geochemical analysis were randomly collected at 10 different sites within a 1 m radius of the station using an acrylic core tube (3 cm in diameter). The samples were extruded carefully and their surface layers (i.e. up to 0.5 cm depth) were retained to determine Chl-aand organic matter content of the sediment (SOM). At subtidal stations, sediment samples were carefully collected using an Ekman–Birge grab sampler, which sampled a 20620 cm area to a depth of 20 cm. The topmost 0.5 cm of the sediment was also collected using an acrylic core tube.
For the quantitative survey of macrobenthic animals, 3–5 replicates of each sediment sample were collected using a stainless-steel core sampler (10610610 cm) and sieved through a 1 mm mesh screen. The residues of each sediment sample were stored in a plastic bag. Furthermore, 18–30 additional sediment samples were collected using the steel core sampler to improve the accuracy of the quantitative data describing the occurrence (in terms of density and biomass) of adult clams that were present at low densities. These additional samples were sieved through a 5 mm mesh screen and treated in the same manner as the other quantitative samples for macrobenthic animals.
From June to October 2005, 4 L of samples of surface water were collected in a sampling bucket at stations 0, 6, and 10 during flood tides to determine the stable carbon and nitrogen isotopic signatures of the suspended particulate organic matter (POM) in the water; these samples were stored in plastic bottles. The tidal flats near station 14 was selected as MPB sampling site, where locates on the center portion of the tidal flats. MPB samples were collected from the sediment surface by following a modified version of the method developed by Couch [23] for the determination of the stable isotopic signatures of carbon and nitrogen [22].
For quantitative analysis, macrophytobenthos (seagrass and macroalgae) were collected with bottom sediment using a handy core sampler (25625610 cm); sampling was performed five times for each station during August 2004 and October 2004. The samples were sieved through a mesh bag with a 1-mm opening and the residues of each sample in the mesh bag were stored in plastic bags. Seagrass (Zostera japonica L. 1753) and benthic macroalgae (Ulva pertusa L. 1753) were collected with the grab sampler in August 2005 and October 2005 for stable isotope analysis.
Sample Treatment and Analysis
To determine the Chl-acontent of the water, the water samples were filtered through glass fiber filters (Whatman GF/F) and Chl-a
was extracted from residues on the filters in test tubes using 90% acetone. The test tubes were stored in darkness for 24 h at220uC and then sonicated for 5 min. The concentrations of Chl-ain the supernatants were analyzed to estimate Chl-astanding stocks using a spectrophotometer (Turner 10-AU-5, Turner Designs) according to the method of Lorenzen [24]. To determine the Chl-acontent of the surface sediment, Chl-a was extracted from duplicate subsamples of the wet surface sediment (,0.5 g) in test tubes using
90% acetone. The concentrations of the supernatants were also determined by spectrophotometry [25].
Macrobenthic animals were sorted from the residues of the quantitative samples, identified, counted, and weighed by species. For the population study ofR. philippinarum, the shell lengths of all specimens were measured using a digital caliper to produce a size– frequency distribution for the population. To determine the relationship between the shell length and dry weight of clam body tissues, 361 individuals were randomly collected in different seasons and their shell lengths were measured using the digital caliper. All of these clams were stored in filtered seawater for evacuation for 6–8 h. The body tissues were then removed from the shells, freeze-dried, and weighed. The relationship between the shell length and dry weight of body tissues for individual clams were obtained as follows:
DW~0:007e0:1063 SL, ð1Þ
where r2= 0.945, n = 361, DW is dry weight, and SL is shell length.
The shell lengths of all specimens of the clams were measured for stable isotope analysis of carbon and nitrogen. The clams were then opened and their posterior adductor muscles were dissected, frozen at220uC for storage, freeze-dried, and ground to powder with a mortar. Prior to analysis, the samples were treated with a chloroform–methanol mixture solution (2:1, v/v) for 24 h to remove lipids, filtered with a precombusted GF/F filter (450uC, 5 h), rinsed with ethanol, and freeze-dried. The macroalgae and seagrass tissue used for stable isotope analysis were separated from the sample, rinsed with distilled water, freeze-dried, and ground into fine powder with a mortar. The organic matter derived from the surface sediment (SOM) was also ground into a powder with a mortar. Prior to analysis, the samples were treated with 1 N HCl to remove inorganic carbon, rinsed with deionized and distilled water to remove the acid, and freeze-dried. For the analysis of POM, 4 L of the water sample were filtered with a precombusted GF/F filter (450uC, 5 h), and the residues on the filter were used for stable isotope analysis. For the analysis of MPB, the MPB adhering to glass beads was rinsed with filtered seawater and sieved with a 125mm mesh screen to remove the glass beads, which were then filtered using a precombusted GF/F filter (450uC, 5 h). Prior to analysis, the POM or MPB filters were treated with 1 N HCl to remove inorganic carbonates, rinsed with deionized and distilled water to remove the acid, and freeze-dried.
Analysis of Stable Isotope Ratios of Carbon and Nitrogen The stable isotope ratios of carbon and nitrogen were determined using a mass spectrometer (DELTA V Plus, Thermo Electron) connected directly to an elemental analyzer (Flash Elemental Analyzer 1112 Series, Thermo Electron). All isotopic data are reported in conventional delta notation (in%) as follows:
X~(Rsample=RStandar1) 1000, ð2Þ
where X is13C or15N and R is13C/12C or15N/14N for carbon and nitrogen, respectively. Pee Dee Belemnite and air N2 were used as the standards for carbon and nitrogen, respectively. The overall analytical error was within60.2%.
Estimation of the Secondary Production of the Clam Population
distribution of the clam population. Version 4.0 of the PROGEAN software [26] was used for generation analysis of the clam population by a graphic method. Mean shell length and the density of each cohort were determined from the size–frequency distribution of the population. Secondary productivity of the clam population was calculated in dry weight according to an incremental summation method [27] using density and mean shell length data for each cohort (obtained by generation analysis of the population) and the relationship between the shell length and biomass (in dry weight) of the clams (Equation 1).
P(t) represents the productivity of the clam population between sampling timestand (t21) and is expressed as follows:
P(t)~X i~n
i~1
1
2|(D(t)izD(t{1)i)|(B(t)i{B(t{1)i) ð3Þ
whereiis the cohort number, D(t)iis the density of cohortiat time
z t, and B(t)iis the biomass of the individual with the modal shell size in cohortiat timet.
The estimated productivity of the clam population is represent-ed by the amount of carbon and nitrogen basrepresent-ed on the carbon and nitrogen contents of body tissues (40.1% and 12.3%, respectively),
which allows evaluation of the importance of this productivity in material flow in the tidal-flat area.
Data Analysis
POM from the lagoon, MPB, SOM,U. pertusa, andZ. japonica
leaves were considered as potential trophic resources for the short-necked clam. The IsoSource software [28,29] was used to determine the relative contribution of each source to the mixed signature of the clam adductor muscle at the tidal flats stations. The trophic enrichments ofR. philippinarum(0.6%for d13C and 3.4%ford15
N; [30]) were subtracted from the adductor muscle values before IsoSource analysis.
The carbon content (C/Chl) of phytoplankton and MPB were assumed to be 20–50 [31] and 10–150 [32], respectively, and the elemental compositions (C/N) of phytoplankton and MPB were assumed to be 6.6 [33] and 7.5 [25], respectively. The nitrogen content ofZ. japonicaand U. pertusadetermined by the elemental analyzer were 2.8% and 1.9%, respectively. The standing stock of nitrogen in the microalgae was obtained by multiplying these elemental ratios with the microalgal standing stock.
Ethics statement. The field survey of this study is approved by the Chirippu Fishery Cooperative Union.
Results
Macrobenthic Community at the Representative Station Station B was defined as a representative station for the macro-benthic animals, because it was suitable to analyze the cohort of the clam population at this station with the high density and biomass of the clam. Figure 2 illustrates the seasonal fluctuations in the density and biomass of macrobenthic animals at station B. The short-necked clam (Ruditapes philippinarum) was found to dominate the benthic community by density, accounting for 57.9% of all macrobenthic animals collected in the present study. The density of the clam peaked at 12960 ind. m22 on July 19, 2005 and decreased gradually to 7000 ind. m22by April 27, 2006. A small gastropod, Lacuna decorata (Adams 1861), and an amphipod,
Corophiumsp., were the second and third most dominant species in the macrobenthic community. The density ofL. decoratatended to increase in late summer to autumn and reached a peak density of 4930 ind. m22in October 2005 (Figure 2a).Corophiumsp. also increased from 1,870 ind. m22 to 4940 ind. m22 between October 2005 and March 2006. In terms of biomass, R. philippinarum dominated the macrobenthic community exclu-sively (Figure 2b). The biomass of the clam was found to be 3.65–17.0 kgWW m22, with a mean biomass of 7.77
6 3.68 kgWW m22(all values are given as mean
6SD), throughout the duration of the present study; this represents 95.9% of the total biomass in wet weight of the specimens collected.
Biomass, Secondary Productivity, and P/B of R. philippinarum
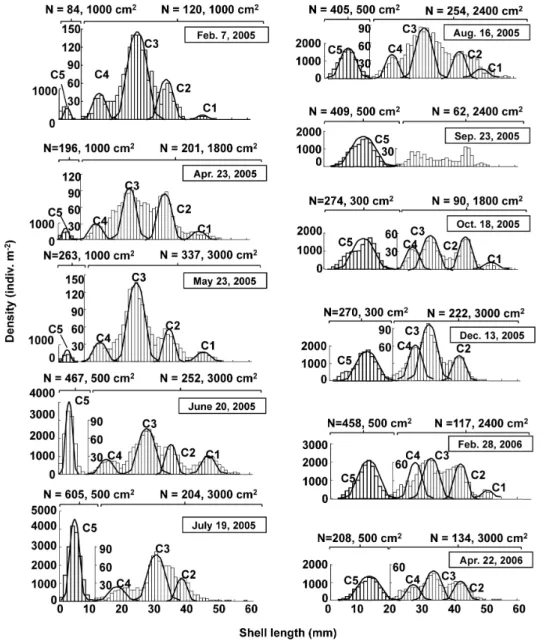
The size–frequency distributions of the clam population between February 2005 and April 2006 are presented in Figure 3; these distributions were obtained by combining data collected from quantitative samples covering two different size ranges for macrobenthic organisms. The presence of five different cohorts (C1–C5) can be recognized in these size–frequency distributions, and the shell growth curves of these five cohorts are plotted in Figure 4a. In the study area, the clam breeds in September and planktonic larvae settle on tidal flat sediments in October [21]. In the size–frequency distributions, a new cohort (C5) initiated recruitment in April 2005, reaching a peak in recruitment in July 2005 with a density of 11250 ind. m22.
Figure 2. Seasonal variability of the macrobenthic animals at station B.(a) density and (b) biomass.
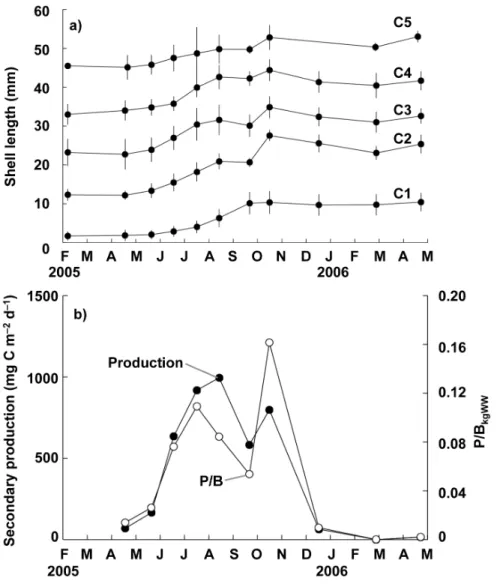
Moreover, all five cohorts recognized here exhibited increases in shell length of 5–12 mm in the warm season between May 2005 and October 2005. In contrast, their growth was extremely depressed or ceased altogether in the cold season between November 2005 and April 2006. From the growth curves produced, the clam was considered as approximately 1 year and 5 years to reach shell lengths of 10 mm and 50 mm, respectively, in the area investigated.
Figure 4b illustrates seasonal fluctuations in the secondary productivity of the clam population estimated from changes in the size–frequency distributions of the five cohorts. The annual secondary productivity of the clam population was 130 g C m22yr21between April 2005 and April 2006, peaking at 994 mg C m22d21 in August 2005 and decreasing to 0–64.0 mg C m22d21 between December 2005 and April 2006 owing to the depression or cessation of growth. Seasonal variation in the ratio of the daily secondary productivity of the clam to its biomass in kg wet weight (P/BkgWW) at each sampling instance exhibited a
pattern similar to that of secondary productivity and varied between 0 and 0.16 (Figure 4b). The period between June and October was defined as the productive period, i.e. the period during which secondary production was greater than 500 mg C m22d21.
Figure 5 illustrates seasonal variation in biomass and secondary productivity for the tidal-flat area. The biomass of clams was found to be heterogeneously distributed among tidal-flat stations (Figure S1); although, the clam accounted for at least 70% of the biomass of the benthic community. The mean values were found to be relatively stable, ranging from 1.9861.77 kgWW m22 to 5.5967.51 kgWW m22 (Figure 5a). The secondary productivity at the tidal-flat stations, calculated based on the mean biomass (Figure 5a) and P/BkgWW(Figure 4b) at the representative station, exhibited a clear seasonal pattern: productivity peaked at 8406634 mg C m22d21 in October 2005 and decreased to 9.665.9 and 28.0633.8 mg C m22d21by December 2005 and April 2006, respectively. Thus, the annual secondary productivity Figure 3. Size–frequency distribution ofRuditapes philippinarumpopulation at station B.The left and right scales correspond to samples obtained using mesh sizes of 1 and 5 mm, respectively (C = cohorts; n = number of individuals).
was estimated to be 96.5 g C m22yr21throughout the tidal flats. During the productive period (i.e. for 120 days during June– October 2005), the integrated secondary productivity accounted for 90.6% (87.5 g C m22) of the annual productivity.
Food Demand of the Clam and Quantification of Potential Food Sources
Table 1 presents the net growth efficiency (i.e. growth/ consumption) of six different species of bivalves including R.
philippinarum. The food demand of the clam population (mg C m22d21) was determined using an assimilation number of 18.8%, which was the mean value obtained from nine different energy budgets for the bivalve species (Table 1).
During the productive period, nitrogen-based secondary pro-ductivity and the food demand of the clam was 1.92 mol N m22 and 10.2 mol N m22, respectively, and the total secondary productivity and food demand of the clam throughout the tidal flats (i.e. for 0.19 km2) were 364 kmol N and 1939 kmol N, respectively. The daily secondary productivity and food demand of the clam during the productive season were 3.04 kmol N d21and 16.2 kmol N d21, respectively, for the entire tidal flat area (0.19 km2) (Table 2).
During the productive season, the mean biomass per unit area of MPB in the surface sediment (depth: 0.5 cm; 140.6679.8 mg Chl-a m22 in the subtidal area, n = 56; 140.6
652.5 mg Chl-a
m22on the tidal flats, n = 39) was approximately 70 times greater than that of phytoplankton in the water column (depth: 1 m; 2.061.3 mg Chl-am22) (n = 123). The mean standing stocks of
Zostera japonicaandUlva pertusawere 98.86102.4 g DW m22and 19.96129.2 g DW m22, respectively, in the subtidal area (n = 30). The nitrogen-based biomasses of MPB, phytoplankton,Z. japonica, andU. pertusawere 213–3200 mmol N m22(for both the tidal flats and the subtidal area), 6.04–15.1, 203, and 9.22 mmol N m22, respectively.
The total nitrogen content of phytoplankton (1.79–4.48 kmol N) was lower than that for all other organisms in the lagoon, and phytoplankton accounted for only 12–28% of the daily food demand of the clam population (Table 2). MPB in tidal flats also imposed limits on the daily food demand of the clams, accounting for 42–104% of the daily food demand. However, none of the other food sources studied imposed limits on the daily food demand of the clams.
Figure 4. Seasonal variation of growth of the clam (Ruditapes philippinarum) at station B.Changes in (a) mean shell length of each cohort of the clamRuditapes philippinarumand (b) daily secondary productivity and P/BkgWWat station B.
Carbon and Nitrogen Isotopic Signatures and Contribution to the Diet of the Clam
The carbon stable isotope ratios (d13
C) of the clam diet and potential food sources in the lagoon ranged from218.561.2% for POM to 29.760.6 % for Z. japonica, whereas the nitrogen isotope ratios (d15
N) ranged from 4.860.9%for SOM to 6.860.5
%forU. pertusa(Figure 6). Thus, the diet of the clam was found to exhibit 216.460.9 % d13C and 5.960.9 % d15N, which corresponds to the isotopic signature of MPB (217.161.1 %
d13
C and 5.560.6%d15
N). At our study site, the d13
C value of POM fell within the ranges of previously reported for temperate marine phytoplankton (–24%to –18%) from other estuarine and coastal waters [17,34–36]. Thus, the isotope signature of the POM samples was regarded in this study to primarily reflect the presence of phytoplankton.
According to the IsoSource mixing model, POM was the primary contributor to the clam diet (43612%) (all values are given as mean6SD) followed by MPB (20615%) has a wider range (min.–max.: 0–69%) andU. pertusa(2066%) has a narrower range (min.–max.: 3–34%); SOM, andZ. japonicacontributed, on average, 1168%, and 664%, respectively (Figure 7).
Comparison of the total amount of phytoplankton present to the daily food demand of the clam indicates that phytoplankton account for 12–28% of the daily food demand of the clam (Table 2). A curve was constructed to a represent the mean contribution (and associated standard deviations) of potential food sources at each contribution (i.e. for every 1% increase) of POM, thus illustrating the entire range of solutions using only isotopic constraints (for all regions). Then, a subset of the output (left side of the dotted line) was extracted; this subset contains only solutions that satisfy the food demands of the clam population (Figure 8). For this subset, MPB was the primary contributor (35613% to 6464%), followed by U. pertusa (1961% to 2364%). The contribution of SOM and Z. japonica to the clam diet were 363% to 1369% and 060% to 261%, respectively.
Discussion
The short-necked clam (R. philippinarum) was found to be the dominant macrobenthic species in the present study area (Figure 2a, b). Comparison of the secondary productivity of the clam with that of the other suspension-feeding bivalve species present demonstrates that higher secondary productivity (i.e. 228– 996 gC m22yr21) was found in the following mytilid species:
Choromytilus meridionalis(Krauss 1848) [37],Perna picta(Born 1778) [38,39], andM. edulis[2]. These species typically form extremely dense populations, which accounts (at least primarily) for their high productivity. During the productive season, secondary productivity of the clam population in the lagoon was estimated to be 364 kmol N (per 120 days) based on both the mean secondary productivity of the clam and the area of the tidal flats Figure 5. Seasonal variation of the clam (Ruditapes
philippi-narum) population at tidal flats stations.(a) biomass (kgWW m–2)
and (b) secondary productivity (g C m–2d–1) of the clam at five tidal flat
stations, expressed as box plots. doi:10.1371/journal.pone.0086732.g005
Table 1.Net growth efficiency (%) of bivalves.
Species Country Net growth efficiency Method* Reference
Cardium edule Sweden 15.4 in situ+lab [7]
Mya arenaria Sweden 15.5 in situ+lab [7]
Macoma balthica Netherland 4.4 in situ+lab [47]
Ruditapes philippinarum USA 41.7 lab [48]
Scrobicularia plana Wales 14.8 in situ+lab [49]
Tellina tenuis Scotland 13.6 core [50]
Tellina tenuis Scotland 16.2 core [50]
Tellina tenuis Scotland 28.7 core [50]
Mean 18.8
(0.19 km2). A recent study showed that ingress of nitrate from the Pacific Ocean through the tidal inlet is necessary to maintain the lagoon ecosystem, and the dissolved inorganic nitrogen budget of this lagoon has been estimated to be 258 kmol N yr21[20]; this is comparable to the secondary productivity of the clam. Therefore, the feeding of the clam should have a considerable impact on the material circulation of the lagoon.
Yokoyama et al. [17] suggested that the relatively large biomass of phytoplankton and the scarcity of benthic microalgae could have produced the phytoplankton-based trophic structure (includ-ing R. philippinarum) found in Ariake Bay, southern Japan. In contrast, several authors have suggested that the clam depends more on MPB than on phytoplankton based on the biomass of microalgae [16,18,35]. In the present study, the relatively low contribution of the phytoplankton (at most 28%) as a food source for the clam should correspond to the occurrence of low phytoplankton biomass (Table 2); however, this is not the case. Although the contribution of the phytoplankton was estimated initially to be 14–77% based on isotopic data alone (Figure 7a), the stable isotope signatures obtained indicate that the phytoplankton
contribute (at most) 28% of the food resources required for the clam population in the study area (Figure 8). Thus, the contributions derived using only isotopic signatures may be somewhat misleading.
Assuming a POM contribution of 28% based on the phyto-plankton biomass, the clam population within the tidal flats (i.e. an area of 0.19 km2) must consume all of the phytoplankton present in the entire lagoon (i.e. an area of 3.56 km2) each day. Filtration experiments conducted on the clam [40] have demonstrated its weight-specific filtration rate for Chl-ais 2.3 L gDW21h21under temperatures of 24uC and mean Chl-aconcentrations of 3.1mg L21. However, the temperature and Chl-aconcentration for the water column in the present study were somewhat lower than those for the filtration experiment (Table 3) [20,22]. Assuming that the weight-specific filtration rate of the clam (which has a mean biomass of 246–276 gDW m22in the study area) remains constant throughout the day, the filtration rate for clams on the tidal flats of the present study can be estimated to be 2.89–7.17 kg Chl-a d21. The total amount of Chl-a in the lagoon was 3.56–9.90 kg; thus, the dense clam population appears to filtrate Table 2.Food demand of the clam (Ruditapes philippinarumm) and total amount of potential food sources during the productive season.
Food demand of the clam Region* kmol N d–1
Tidal flats 16.2
Amount of potential food sources kmol N (min.–max.) Amount/Demand (min.–max.)
Phytoplankton Whole 1.79–4.48 0.11–0.28
Microphytobenthos Tidal flats 6.8–16.9 0.42–1.04
Subtidal 120–300 7.41–18.5
Zostera japonica Subtidal 685 42.3
Ulva pertusa Subtidal 31.1 1.92
Area: entire (3.56 km2), subtidal (3.37 km2), and tidal-flat (0.19 km2).
doi:10.1371/journal.pone.0086732.t002
Figure 6. A dual isotope plot for carbon and nitrogen for the expected diet of the clam (Ruditapes philippinarum) and their potential food sources in Hichirippu Lagoon.See text in Materials and methods for diet-tissue fractionation for the clam to determine expected diet (R. philippinarum). Error bars are standard deviations.
72.5–80% of the Chl-a of water in the lagoon each day. The feeding activity of the clam population should have a considerable effect on the water column phytoplankton; however, it is highly unlikely that the clams present could consume all of the phytoplankton in the lagoon water owing to the circadian nature of suspension-feeding bivalves [41,42]. Thus, it is reasonable to assume that the contribution of the phytoplankton to the clam diet is less than 28%.
Assuming the lower limit of the phytoplankton contribution to be accurate, the clam population would tend toward consuming
almost all of (or more than) the total MPB available in the tidal-flat area each day (Table 2). Resuspended primarily produced organic particles (i.e. those originating from MPB) in tidal flats are considered to be important food sources for benthic animals [43], and their lateral transport to the habitat of suspension-feeding benthic bivalves (R. philippinarum and Mactra veneriformis Reeve 1854) is thought to be essential to sustain the high secondary productivity of these bivalves [9]. In the inner part of Ariake Bay, resuspended MPB was supplied to the benthic community on tidal flats and provided an additional source of food in addition to that Figure 7. Histograms of the proportional contribution of each food source to the diet of the clam (Ruditapes philippinarum) based on the IsoSource mixing model.
doi:10.1371/journal.pone.0086732.g007
Figure 8. Scatter plot illustrating the relationship between the contributions of phytoplankton and other food sources.(a) MPB, (b) SOM, (c)U. pertusa, and (d)Z. japonica. Solid lines and grey region indicate mean and standard deviations for every 1% increase of POM contribution, respectively. Vertical dotted line indicates the upper limit to the phytoplankton contribution based on their abundance and the food demand of the clam.
found in the subtidal region, thus increasing the food availability by 50% [44]. In the present study, the abundant MPB in the subtidal area (where MPB are approximately 18 times more abundant than in the tidal flat area) appear to have been a key clam food source, particularly in its resuspended form; in this manner, MPB could have sustained the high secondary produc-tivity of the clam.
In the muddy tidal flats of Ariake Bay, southern Japan, a certain portion of the MPB typically becomes resuspended during high tide, thus contribution to the total biomass in the water column [13]. In the central part of the area investigated in the present study, resuspension of MPB due to the tidal cycle has been estimated to contribute up to 74% of water column Chl-a[45]. Therefore, the biomass of phytoplankton has likely been somewhat overestimated in the present study owing to the lack of consideration of resusupended MPB.
Interestingly, the contribution of U. pertus for the extracted subset to the clam diet (based on the amount of phytoplankton) was found to be 12–28% (Figure 8c). Previously, clam feeding experiments have demonstrated that the clam can filtrate a
maximum particle size of 200mm [40]. Furthermore, the hard clam Mercenaria mercenaria L. 1758, which is in the same family (Veneridae) as R. philippinarum, can filtrate aggregates up to approximately 1 mm in diameter [46]. These previous studies suggest that seaweeds must be broken down into fine particles (i.e. less than 1 mm diameter) to be filtrated. During this process, the numerous bacteria that are attached to the debris form a community and act as a further food source for the clam.
The results of the present study suggest a clear relationship between the isotopic signature and food demand of the clam population. The contribution of MPB was unclear before the extraction; however, the final results, which are revised with respect to the combination of food available and the total abundance of primary producers in the lagoon, indicate that MPB are likely the main food source for the clam population in this environment. The dense patches of clams with high productivity (130 g C m22yr21) are likely sustained by the supply of particulate organic matter derived from MPB (35–64%) in the subtidal area, where the standing stock of MPB is approximately 18 times that for the tidal flats.
Supporting Information
Figure S1 Seasonal variations of macro-benthic bio-mass (in kgWW m–2) at each tidal flat station.
(TIF)
Acknowledgments
We would like to express our gratitude to Ms. Y Inaba, Ms. A. Hamada and Mr. N. Kawanishi for their assistance in the field survey, and to Dr. I. Kudo, and 2 anonymous reviewers for their constructive comments of this manuscript.
Author Contributions
Conceived and designed the experiments: TK RK SM SS TY HT. Performed the experiments: TK RK SS TY. Analyzed the data: TK RK SM. Contributed reagents/materials/analysis tools: TK RK. Wrote the paper: TK RK SM HT.
References
1. Brey T (2001) Population dynamics in benthic invertebrates. A virtual handbook. Version 01.2. Available: http://www.thomas-brey.de. Accessed 2013 Sept 14.
2. Thompson R (1984) Production, reproductive effort, reproductive value and reproductive cost in a population of the blue mussel Mytilus edulis from a subarctic environment. Mar Ecol Prog Ser 16: 249–257. Available: http://www. int-res.com/articles/meps/16/m016p249.pdf. Accessed 2013 April 22. 3. Laudien J, Brey T, Arntz W (2003) Population structure, growth and production
of the surf clamDonax serra (Bivalvia, Donacidae) on two Namibian sandy beaches. Estuar Coast Shelf Sci 58S: 105–115. Available: http://www. sciencedirect.com/science/article/pii/S0272771403000441. Accessed 2013 April 22.
4. MacIntyre H, Geider R, Miller D (1996) Microphytobenthos: The ecological role of the ‘‘secret garden’’ of unvegetated, shallow-water marine habitats. I. Distribution, abundance and primary production. Estuaries 19: 186–201. Available: http://link.springer.com/article/10.2307/1352224. Accessed 2013 April 22.
5. Cahoon LB (1999) The role of benthic microalgae in neritic ecosystems. Oceanogr Mar Biol Annu Rev 37: 47–86.
6. Underwood G, Kromkamp J (1999) Primary production by phytoplankton and microphytobenthos in estuaries. Adv Ecol Res 29: 93–153. Available: http:// www.sciencedirect.com/science/article/pii/S0065250408601920. Accessed 2013 April 22.
7. Loo L, Rosenberg R (1996) Production and energy budget in marine suspension feeding populations:Mytilus edulis, Cerastoderma edule, Mya arenariaandAmphiura filiformis. J Sea Res 35: 199–207. Available: http://www.sciencedirect.com/ science/article/pii/S1385110196907479. Accessed 2013 April 15.
8. Nakaoka M (1992) Spatial and seasonal variation in growth rate and secondary production of Yoldia notabilis in Otsuchi Bay, Japan, with reference to the influence of food supply from the water column. Mar Ecol Prog Ser 88: 215– 223. Available: http://www.int-res.com/articles/meps/88/m088p215.pdf.
9. Yamaguchi H, Tsutsumi H, Tsukuda M, Nagata S, Kimura C, et al. (2004) Utilization of photosynthetically produced organic particles by dense patches of suspension feeding bivalves on the sand flat of Midori River Estuary, Kyusyu, Japan. Benthos Res 59: 67–77. Available: https://www.jstage.jst.go.jp/article/ benthos1996/59/2/59_2_67/_pdf. Accessed 2013 April 22.
10. Kang C, Sauriau P (1999) the infaunal suspension-feeding bivalveCerastoderma edulein a muddy sandflat of Marennes-Oleron Bay, as determined by analyses of carbon and nitrogen. Mar Ecol Prog Ser 187: 147–158. Available: http://www. int-res.com/articles/meps/187/m187p147.pdf. Accessed 2013 Sept 14. 11. Kanaya G, Nobata E, Toya T, Kikuchi E (2005) Effects of different feeding
habits of three bivalve species on sediment characteristics and benthic diatom abundance. Mar Ecol Prog Ser 299: 67–78. Available: www.int-res.com/ articles/meps2005/299/m299p067.pdf.
12. Kasai A, Horie H, Sakamoto W (2004) Selection of food sources byRuditapes philippinarumandMactra veneriformis(Bivalva: Mollusca) determined from stable isotope analysis. Fish Sci 70: 11–20. Available: http://onlinelibrary.wiley.com/ doi/10.1111/j.1444-2906.2003.00764.x/full. Accessed 2012 Feb 16. 13. Koh C, Khim J, Araki H (2006) Tidal resuspension of microphytobenthic
chlorophyll a in a Nanaura mudflat, Saga, Ariake Sea, Japan: flood-ebb and spring-neap variations. Mar Ecol Prog Ser 312: 85–100. Available: http://www. int-res.com/abstracts/meps/v312/p85-100/. Accessed 2013 Sept 12. 14. Ponurovsky S, Yakovlev Y (1992) The reproductive biology of the Japanese
littleneck,Tapes philippinarum(A. Adams and Reeve, 1850) (Bivalvia: Veneridae). J Shellfish Res 22: 814–823.
15. Dang C, Sauriau P, Savoye N (2009) Determination of diet in Manila clams by spatial analysis of stable isotopes. Mar Ecol Prog Ser 387: 167–177. Available: http://www.int-res.com/abstracts/meps/v387/p167-177/. Accessed 2012 Aug 31.
16. Kanaya G, Takagi S, Nobata E, Kikuchi E (2007) Spatial dietary shift of macrozoobenthos in a brackish lagoon revealed by carbon and nitrogen stable Table 3.Estimation of the rate of filtration by the clam
(Ruditapes philippinarum) in Hichirippu Lagoon during productive season.
June August October
Clam biomass (gDW m–2) 246 (211) 296 (398) 276 (304)
Chl-aconc. (mg L–1) 2.78 (1.51) 1.49 (1.16) 1.00 (0.67)
Filteration rate (L gDW–1h–1) 2.3
Capacity of filteration (kg Chl-a d–1)
7.17 4.63 2.89
Amount of Chl-a(kg) 9.90 5.30 3.56
Filteration/Amount (%) 72.5 87.2 81.3
isotope ratios. Mar Ecol Prog Ser 345: 117–127. Available: http://www.int-res. com/abstracts/meps/v345/p117-127/. Accessed 2012 Aug 14.
17. Yokoyama H, Tamaki A, Koyama K, Ishii Y, Shimoda K, et al. (2005) Isotopic evidence for phytoplankton as a major food source for macrobenthos on an intertidal sandflat in Ariake Sound, Japan. Mar Ecol Prog Ser 304: 101–116. Available: http://www.int-res.com/abstracts/meps/v304/p101-116/. Accessed 2013 April 13.
18. Watanabe S, Katayama S, Kodama M, Cho N, Nakata K, et al. (2009) Small-scale variation in feeding environments for the Manila clam Ruditapes philippinarumin a tidal flat in Tokyo Bay. Fish Sci 75: 937–945. Available: http://link.springer.com/10.1007/s12562-009-0113-1. Accessed 2013 Sept 12. 19. Komorita T, Kajihara R, Tsutsumi H, Shibanuma S, Yamada T, et al. (2010) Reevaluation of the nutrient mineralization process by infaunal bivalves (Ruditapes philippinarum) in a shallow lagoon in Hokkaido, Japan. J Exp Mar Bio Ecol 383: 8–16. Available: http://linkinghub.elsevier.com/retrieve/pii/ S0022098109004870. Accessed 2013 Sept 18.
20. Komorita T, Tsutsumi H, Kajihara R, Suga N, Shibanuma S, et al. (2012) Oceanic nutrient supply and uptake by microphytobenthos of the Hichirippu Lagoon, Hokkaido, Japan. Mar Ecol Prog Ser 446: 161–171. Available: http:// www.int-res.com/abstracts/meps/v446/p161-171/. Accessed 2013 Feb 13. 21. Komorita T, Shibanuma S, Yamada T, Kajihara R, Tsukuda M, et al. (2009)
Impact of low temperature during the winter on the mortality in the post-settlement period of the juvenile of short-neck clam,Ruditapes philippinarum, on the tidal flats in Hichirippu Lagoon, Hokkaido, Japan. Plankt Benthos Res 4: 31–37. Available: https://www.jstage.jst.go.jp/article/pbr/4/1/4_1_31/_pdf. Accessed 2013 Feb 16.
22. Kajihara R, Komorita T, Hamada A, Shibanuma S, Yamada T, et al. (2010) Possibility of direct utilization of seagrass and algae as main food resources by small gastropod,Lacuna decorata, in a subarctic lagoon, Hichirippu, eastern Hokkaido, Japan. Plankt Benthos Res 5: 90–97. Available: https://www.jstage. jst.go.jp/article/pbr/5/3/5_3_90/_pdf.
23. Couch C (1989) Carbon and nitrogen stable isotopes of meiobenthos and their food resources. Estuar Coast Shelf Sci 28: 433–441. Available: http://www. sciencedirect.com/science/article/pii/0272771489900905. Accessed 2013 May 14.
24. Lorenzen C (1967) Determination of cholorophyll and pheopigments: spectrophotometric equations. Limnol Oceanogr 22: 1096–1109. Available: http://aslo.org/lo/toc/vol_12/issue_2/0343.pdf. Accessed 2013 April 22. 25. Montani S, Magni P, Abe N (2003) Seasonal and interannual patterns of
intertidal microphytobenthos in combination with laboratory and areal production estimates. Mar Ecol Prog Ser 249: 79–91. Available: www.int-res. com/articles/meps2003/249/m249p079.pdf.
26. Tsutsumi H, Tanaka M (1994) Cohort analysis of size frequency distribution with computer programs based on a graphic method and simplex’s method. Benthos Res 46: 1–10. doi:10.1521/jaap.2011.39.4.753.
27. Crisp D (1984) Energy flow measurements. In: Holm NA, McIntyre AD, editors. Methods for the study of marine benthos, IBP Handbook No. 16. Blackwell Scientific publication, Vol. 16. pp. 416–426.
28. Phillips DL, Gregg JW (2003) Source partitioning using stable isotopes: coping with too many sources. Oecologia 136: 261–269. Available: http://www.epa. gov/naaujydh/pages/models/stableIsotopes/publications/Phillips %26 Gregg 2003.pdf. Accessed 2013 Feb 4.
29. Phillips DL, Newsome SD, Gregg JW (2005) Combining sources in stable isotope mixing models: alternative methods. Oecologia 144: 520–527.Available: http://www.epa.gov/naaujydh/pages/models/stableIsotopes/publications/ Phillips et al 2005.pdf. Accessed 2013 Feb 4.
30. Yokoyama H, Tamaki A, Harada K (2005) Variability of diet-tissue isotopic fractionation in estuarine macrobenthos. Mar Ecol Prog Ser 296: 115–128. Available: http://www.int-res.com/abstracts/meps/v296/p115-128/. Accessed 2013 Feb 12.
31. Eppley R (1968) An incubation method for estimating the carbon content of phytoplankton in natural samples. Limnol Ocean 13: 574–582. Available: http://tube.aslo.net/lo/toc/vol_13/issue_4/0574.pdf. Accessed 2013 Jan 30. 32. Jonge V De (1980) Fluctuations in the organic carbon to chlorophyll a ratios for
estuarine benthic diatom populations. Mar Ecol Prog Ser 2: 343–353. Available: http://www.int-res.com/articles/meps/2/m002p345.pdf. Accessed 2013 Sept 13.
33. Redfield A, Ketchum B, Richards F (1963) The influence of organisms on the composition of sea-water. In: Hill M, editor. The Sea. New York: Wiley, Vol. 22. pp. 26–77.
34. France R (1995) Carbon-13 enrichment in benthic compared to planktonic algae: foodweb implications. Mar Ecol Prog Ser 124: 307–312. Available: http://www.int-res.com/articles/meps/124/m124p307.pdf. Accessed 2013 Sept 14.
35. Kanaya G, Nakamura Y, Koizumi T, Yamada K, Koshikawa H, et al. (2013) Temporal changes in carbon and nitrogen stable isotope ratios of macro-zoobenthos on an artificial tidal flat facing a hypertrophic canal, inner Tokyo Bay. Mar Pollut Bull 71: 179–189. Available: http://www.ncbi.nlm.nih.gov/ pubmed/23602262. Accessed 2013 Sept 12.
36. Yokoyama H, Sakami T, Ishihi Y (2009) Food sources of benthic animals on intertidal and subtidal bottoms in inner Ariake Sound, southern Japan, determined by stable isotopes. Estuar Coast Shelf Sci 82: 243–253. Available: http://dx.doi.org/10.1016/j.ecss.2009.01.010. Accessed 2013 Feb 16. 37. Griffiths R (1981) Production and energy flow in relation to age and shore level
in the bivalveChoromytilus meridionalis(Kr.). Estuar Coast Shelf Sci 13: 477–493. Available: http://www.sciencedirect.com/science/article/pii/S0302352481 800539. Accessed 2013 April 22.
38. Shafee M (1992) Production estimate of a mussel populationPerna picta(Born) on the Atlantic coast of Morocco. J Exp Mar Bio Ecol 163: 183–197. Avail-able: http://www.sciencedirect.com/science/article/pii/002209819290048F. Accessed 2013 April 22.
39. Hicks DW, Jr JWT, Mcmahon RF (2001) Population dynamics of the nonindigenous brown musselPerna pernain the Gulf of Mexico compared to other world-wide populations. Mar Ecol Prog Ser 211: 181–192. Available: http://www.int-res.com/articles/meps/211/m211p181.pdf.
40. Nakamura Y (2001) Filtration rates of the Manila clam,Ruditapes philippinarum: dependence on prey items including bacteria and picocyanobacteria. J Exp Mar Bio Ecol 266: 181–192. Available: http://www.sciencedirect.com/science/ article/pii/S0022098101003549. Accessed 2013 May 27.
41. Garcı´a-March JR, Sanchı´s Solsona MA´ , Garcı´a-Carrascosa M (2008) Shell gaping behaviour ofPinna nobilisL., 1758: circadian and circalunar rhythms revealed by in situ monitoring. Mar Biol 153: 689–698. Available: http://www. springerlink.com/index/10.1007/s00227-007-0842-6. Accessed 2012 April 3. 42. Rodland DL, Scho¨ne BR, Helama S, Nielsen JK, Baier S (2006) A clockwork
mollusc: Ultradian rhythms in bivalve activity revealed by digital photography. J Exp Mar Bio Ecol 334: 316–323. Available: http://linkinghub.elsevier.com/ retrieve/pii/S0022098106001110. Accessed 2013 April 16.
43. Jonge V De, Beuselom J Van (1992) Contribution of resuspended micro-phytobenthos to total phytoplankton in the EMS estuary and its possible role for grazers. Netherlands J Sea Res 22: 445–459. Available: http://www. sciencedirect.com/science/article/pii/007775799290049K. Accessed 2013 Sept 13.
44. Yoshino K, Tsugeki NK, Amano Y, Hayami Y, Hamaoka H, et al. (2012) Intertidal bare mudflats subsidize subtidal production through outwelling of benthic microalgae. Estuar Coast Shelf Sci 109: 138–143. Available: http:// linkinghub.elsevier.com/retrieve/pii/S0272771412001874. Accessed 2013 Sept 13.
45. Suga N, Kajihara R, Shibanuma S, Yamada T, Montani S (2011) Estimation of microphytobenthic resuspension fluxes in a shallow lagoon in Hokkaido, Japan. Plankt Benthos Res 6: 115–123. Available: https://www.jstage.jst.go.jp/article/ pbr/6/2/6_2_115/_pdf. Accessed 2013 Feb 13.
46. Kach DJ, Ward JE (2007) The role of marine aggregates in the ingestion of picoplankton-size particles by suspension-feeding molluscs. Mar Biol 153: 797– 805. Available: http://www.springerlink.com/index/10.1007/s00227-007-0852-4. Accessed 2012 March 12.
47. Hummel H (1985) An energy budget for aMacoma balthica(mollusca) population living on a tidal flat in the Dutch Wadden Sea. Netherlands J sea Res 19: 84–92. Available: http://www.sciencedirect.com/science/article/pii/007775798590 0456. Accessed 2013 Sept 13.
48. Langton R, Winter J, Roels O (1977) The effect of ration size on the growth and growth efficiency of the bivalve molluscTapes japonica. Aquaculture 12: 283–292. Available: http://www.sciencedirect.com/science/article/pii/004484867790 2071. Accessed 2013 Sept 13.
49. Hughes R (1970) An energy budget for a tidal-flat population of the bivalve
Scrobicularia plana(Da costa). J Anim Ecol 39: 357–179. Available: http://www. jstor.org/stable/10.2307/2976. Accessed 2013 Sept 13.