HOLOS, Year 32, Vol. 1 285
VIABILITY ANALYSIS OF A GRID-CONNECTED PHOTOVOLTAIC SYSTEM IN IFRN,
CAMPUS JOÃO CÂMARA
A. C. TEIXEIRA, A. C. F. CORIOLANO and A. V. ROCHA
Instituto Federal de Educação, Ciência e Tecnologia do Rio Grande do Norte [email protected]*
Article submitted in November/2015 and accepted in January/2016 DOI: 10.15628/holos.2016.3783
ABSTRACT
Given the vulnerability of oil prices and the increase in CO2 emissions that impact on the climate and the planet's ecosystems, the use of environmental technologies, such as solar photovoltaic energy, it becomes essential to develop more sustainable economies. This article is a case study of integration of a grid-connected photovoltaic system (GCPVS) at the Federal Institute of science and technology of the State of Rio Grande do Norte (IFRN), campus João Câmara/RN, which aims to use clean and renewable energy such as
solar for power generation, contributing to implement environmental sustainability practices and use technology for the benefit of society. As a result, the estimated payback of the return on investment is 11 years and at the end of 20 years, which is the GCPVS useful life, will have a positive net present value (NPV) of R$ 211,670.00, i.e. the system will compensate the amount invested and still provide a rate of return higher than savings rate.
KEYWORDS: Energy, Photovoltaic, Power Grid, Solar, Renewable.
ANÁLISE DE VIABILIDADE DE UM SISTEMA FOTOVOLTAICO CONECTADO À REDE
NO IFRN CAMPUS DE JOÃO CÂMARA
RESUMO
Diante da vulnerabilidade do preço do petróleo e do aumento das emissões de CO2 que impactam no clima e nos ecossistemas do planeta, a utilização das tecnologias ambientais, tais como a energia solar fotovoltaica, torna-se indispensável para detorna-senvolver as nossas economias de forma mais sustentável. Esse artigo é um estudo de caso de integração de um sistema fotovoltaico conectado à rede elétrica (SFCR) no Instituto Federal de Ciência e Tecnologia do Rio Grande do Norte - IFRN, Campus João Câmara/RN que busca utilizar uma energia limpa e
renovável como a solar para a geração de energia elétrica, contribuindo para implementar práticas de sustentabilidade ambiental e utilizar a tecnologia para o benefício da sociedade. Como resultados, o Payback estimado do retorno do investimento é de 11 anos e ao final dos 20 anos, que é o tempo de vida útil do SFCR, ter-se-á um VPL positivo de R$ 211.670,00, ou seja, o sistema compensará o valor investido e ainda proporcionará uma taxa de retorno superior a taxa da poupança.
HOLOS, Year 32, Vol. 1 286
1 INTRODUCTION
The search for clean and renewable energy alternatives has been, in recent decades, a new worldwide trend. This is mainly due to the need for reducing the dependency of oil derivatives and pollutant emissions. Another determining factor in the search for alternative energy was the energy crisis that the world has suffered in the 70's of last century. The great dependence on fossil fuels awakened the interest in investing in the use of other energy sources, including the renewable, such as solar energy (PEREIRA, 2011). This energy can be directly converted into electric power by means of physical effects on certain materials, including photovoltaic, which is characterized by the interaction of the photons contained in sunlight with the atomic structure of matter. The French physicist Edmond Becquerel primarily observed this photovoltaic effect in 1839. In 1873, Willoughby Smith discovers the photoconductivity of selenium and, in 1876, Adms and Day realized that the junction of selenium and platinum develops photovoltaic effect when exposed to sunlight. Subsequently, in 1905, Albert Einstein (PINA, 2013) theoretically explained this phenomenon.
From the 90's of last century, the developed countries began using the grid-connected photovoltaic system (GCPVS) for residential and commercial use. The objective of the GCPVS is to generate electricity for local consumption, and may reducing or eliminating the public grid consumption or even generating surplus energy. Thus, residences or companies that generate surpluses are no longer just consumers and become electricity producers (VILLALVA; GAZOLI, 2012).
2 GRID-CONECTED PHOTOVOLTAIC SYSTEMS
2.1 GENERATION
The projected installed power for energy generation in IFRN Campus João Câmara is 37.5 kWp, so the system can be classified as microgeneration, as defined by Brazilian electricity
regulatory agency (ANEEL) in the resolution 481, article 2, item I (ANEEL, 2004), which defines:
"I - Distributed microgeneration: central electric power generator with installed power lower than or equal to 100kW and that uses sources based on hydraulic, solar, wind energies, biomass or qualified cogeneration, according to ANEEL regulations, connected to the distribution grid through consumer unit installations."
With respect to the charging for the generated energy in the solar power installed in IFRN, it will be adopted the compensation system, defined in paragraph III, article 2 of the ANEEL resolution 481, whose text was amended by ANEEL resolution 517 (ANEEL, 2012), as transcribed below:
"III - Electric power compensation system: system in which the active energy injected per consumer unit with distributed micro- or minigeneration is transferred, through free lending to local distributor and later compensated by active power consumption of this same consumer unit or another consumer unit of the same owner where the credits were generated, since that has the same
HOLOS, Year 32, Vol. 1 287
individual taxpayer identification number (Cadastro de Pessoa Física - CPF) or Employer identification number (Cadastro de Pessoa Jurídica - CNPJ) in the Ministry of finance."
In this way, the energy payable by the institution will be the net value of energy, i.e., the value of generated energy subtracted from the consumed value for each month.
2.2 CONFIGURATION OF A GRID-CONNECTED PHOTOVOLTAIC SYSTEM
A GCPVS consists basically of photovoltaic generators, assembly and installation structure, inverter DC - AC, and the connection with the local power grid.
Photovoltaic generator: are modules responsible for producing electricity in direct current
(DC) that will later be converted into alternating current (AC) aiming to be transferred for the power grid. These modules are composed of several photovoltaic cells manufactured with semiconductor materials that are connected in series to increase voltage and, in parallel, to increase the current of the system. The power of these modules varies according to the size and the technology used.
Assembly and installation structure: The assembly system of metallic supporting
structures of photovoltaic modules in roof are manufactured in aluminum and steel, resistant to the environment storms and innovative design by simplifying the installation of solar panel. The easy installation of fittings in supporting profile has four steps that allow the accommodation in any position, providing a shorter installation time.
DC - AC inverter: is the equipment responsible for changing the energy that comes from
the photovoltaic generator to be used in power grid. The inverter converts the DC generated by photovoltaic modules into AC, leaving the electricity on the same standard used by diverse electrical equipment. As the inverter allows the energy generated by the solar panel is connected to the grid, so the generated voltage must have the same amplitude, frequency and phase of the grid.
Local power grid: is the set of equipment and devices necessary for the power supply on
site.
3 METHODOLOGY
The research are classified according to the nature, objectives, procedures, and object (ANDRADE, 2010). As for the objective, the used method was quantitative, of descriptive character, since characteristics of photovoltaic phenomena were exposed. As for the procedure, a case study was constituted, covering the IFRN campus João Câmara/RN. Data collection techniques used were the documental analysis, according to the international, national and local standards specific for GCPVS projects; and direct observation, with the data collected in the field, necessary for the system correct sizing.
Besides the theoretical study on the sizing, data collection was necessary for the installation of GCPVS, such as the choose of the site, the more efficient orientation, the available area, and the best location to attach the inverters. Then, the choice of the module and the inverter that best suits the project was realized, detailing each technical characteristic of modules and inverters.
HOLOS, Year 32, Vol. 1 288 Hereupon, a gathering of Brazilian rules and international standards for use and exploration of photovoltaic energy in the country was performed. With that, the calculations required to size the amount of panels to generate a photovoltaic power of 37.5 kW, and also cables and resistors used in the project. The protection devices have been detailed and dimensioned according to the current regulations.
Subsequently, the economic and financial analysis of the project was performed. To this end, it has begun with a pricing survey of equipment and materials required for installation of GCPVS, taking into account the safety standards. With the investment value and energy estimation to be generated by GCPVS, it was possible to calculate the energy produced by each module and, therefore, by the system as a whole. Based on the estimated amount of generated energy and the energy price paid monthly, it was possible to calculate the final saving that IFRN will have each month with the GCPVS installed. With the generated saving value and a monthly cost estimate for system maintenance, it was calculated using MATLAB software and through numerical iteration, the net present value (NPV), return on investment (ROI) (payback) of the project, and the internal rate of return (IRR) on investment, considering the electric energy tariff corrected by the IGP-M (a general price index), and the interest on the invested capital by the savings rate.
4 FINANCIAL VIABILITY ANALYSIS
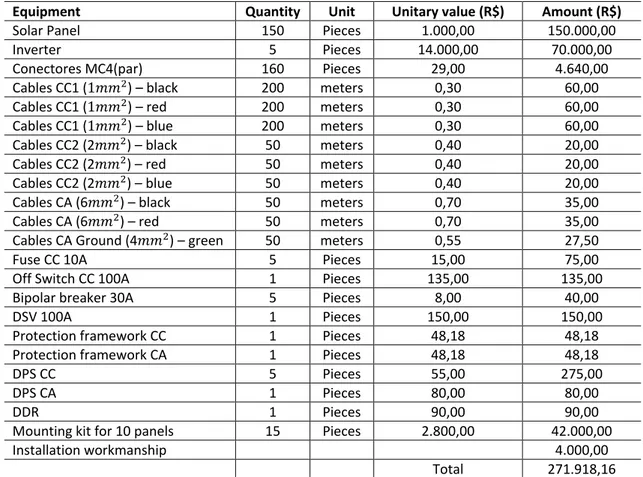
The necessary costs were estimated for the acquisition and installation of microgeneration of electricity, with 37.5 kW of installed power, in the IFRN campus João Câmara/RN. These values are detailed in Table 1.
Table 1 - System costs
Equipment Quantity Unit Unitary value (R$) Amount (R$)
Solar Panel 150 Pieces 1.000,00 150.000,00 Inverter 5 Pieces 14.000,00 70.000,00 Conectores MC4(par) 160 Pieces 29,00 4.640,00 Cables CC1 (1𝑚𝑚2) – black 200 meters 0,30 60,00
Cables CC1 (1𝑚𝑚2) – red 200 meters 0,30 60,00
Cables CC1 (1𝑚𝑚2) – blue 200 meters 0,30 60,00
Cables CC2 (2𝑚𝑚2) – black 50 meters 0,40 20,00 Cables CC2 (2𝑚𝑚2) – red 50 meters 0,40 20,00 Cables CC2 (2𝑚𝑚2) – blue 50 meters 0,40 20,00 Cables CA (6𝑚𝑚2) – black 50 meters 0,70 35,00
Cables CA (6𝑚𝑚2) – red 50 meters 0,70 35,00
Cables CA Ground (4𝑚𝑚2) – green 50 meters 0,55 27,50
Fuse CC 10A 5 Pieces 15,00 75,00
Off Switch CC 100A 1 Pieces 135,00 135,00 Bipolar breaker 30A 5 Pieces 8,00 40,00
DSV 100A 1 Pieces 150,00 150,00
Protection framework CC 1 Pieces 48,18 48,18 Protection framework CA 1 Pieces 48,18 48,18
DPS CC 5 Pieces 55,00 275,00
DPS CA 1 Pieces 80,00 80,00
DDR 1 Pieces 90,00 90,00
Mounting kit for 10 panels 15 Pieces 2.800,00 42.000,00
Installation workmanship 4.000,00
HOLOS, Year 32, Vol. 1 289
4.1 POWER CONSUMPTION IN CAMPUS JOÃO CÂMARA/RN
To understand the electricity charges and how are calculated the values present in the electric bill is very important for decision-making in relation to GCPVS projects. Consumers are classified by the power rating in which they are serviced. The IFRN campus João Câmara/RN is served in high voltage (13.8 kV) and according to the Table 2is classified in group A4, as it receives energy from the provider with mains voltage of 13.8 kV.
Table 2 – Consumer classification of the Group A
Subgroups Power Supply
A1 Greather than ore qual to 230kV A2 88 kV to 138 kV A3 69 kV A3a 30 kV to 44 kV A4 2.3 kV to 25 kV AS underground Source: (PROCEL, 2001)
Consumers of group A have binomial tariff, that is, they are charged by both demanded and consumed energy. These consumers can fit in one of the three tariff alternatives:
- conventional charging;
- green time-seasonal charging; - blue time-seasonal charging.
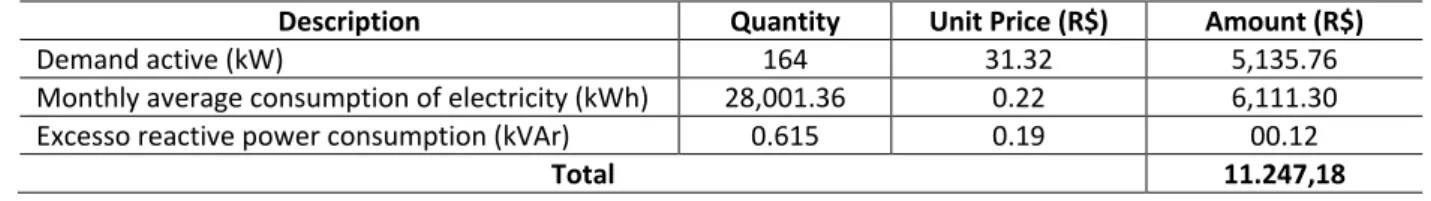
The IFRN campus João Câmara/RN opted for the conventional charging that requires a specific contract with the provider, which agrees a single value for the intended demand (contracted demand), regardless the time of the day (peak or off-peak) or period of the year (dry or wet). A gathering of the campus' energy consumption for a period of 12 months, as can be summarized in Table 3, which shows the average monthly expense in Reais (Brazilian currency) and the average monthly power consumption in campus João Câmara/RN.
Table 3 - Power consumption of the IFRN campus João Câmara
Description Quantity Unit Price (R$) Amount (R$)
Demand active (kW) 164 31.32 5,135.76 Monthly average consumption of electricity (kWh) 28,001.36 0.22 6,111.30 Excesso reactive power consumption (kVAr) 0.615 0.19 00.12
Total 11.247,18
Source: authors
4.2 CALCULATION OF THE PRODUCED ENERGY BY EACH MODULE
In the GCPVS dimensioning, it is necessary to determine how much power will be produced daily for each photovoltaic module. The method adopted for this calculation is the method of the local insolation. This method can be used in the calculation of the power produced by the photovoltaic module based on the info about the solar energy available daily at the installation site. According to Rocha et al (2011), the daily estimated solar energy for the region of Natal is 5,690 Wh/m2. The insolation method for the calculation of the power produced by the photovoltaic
module is valid when considering the use of inverters with maximum power point tracking of the panel (MPPT). The power produced by the photovoltaic module, in the insolation method, is calculated by the following equation:
HOLOS, Year 32, Vol. 1 290
𝐸𝑝 = 𝐸𝑠∙ 𝐴𝑀 ∙ 𝜂𝑀 Eq. 1
Where:
𝐸𝑝 = Power produced daily by the module [𝑊ℎ]
𝐸𝑠 = Local daily insolation [Wh/𝑚2/𝑑𝑖𝑎] 𝐴𝑀 = Surface area of the module [𝑚2]
𝜂𝑀 = Efficiency of the module [dimensionless]
This calculation takes into account that the module will be installed in a way to maximize the use of solar energy with MPPT resource, hence capturing the maximum solar energy. In the places situated below the Equator, the module should have its face to the geographic North (azimuthal angle 00) and the module inclination relative to the horizontal surface should have approximately the value of the local geographical latitude (ZILLES et al., 2012). For the project under study, the panels will be installed with Azimuthal angle of approximately 90° and with inclination of 19.8°, which are higher than recommended values. Thereby, as a safety margin, shall be considered a loss of 20% in power production due to failure to obtain ideal values, resulting in a daily generated power for each module in the amount of:
𝐸𝑝 = 5.690 ∙ 1,6335 ∙ 0,153 𝐸𝑝 = 1.422,09 𝑊ℎ With the reduction of 20%, it shall be:
𝐸𝑝 = 1.137,66 𝑊ℎ
4.3 CALCULATION OF THE POWER SAVED
Considering that each panel will generate on average 1137.66 Wh per day, this will result in a monthly production of 34,129.8 Wh. As the GCPVS will have 150 panels, it will have a monthly total power production of 5,119.47 kWh.
Table 4 presents the value of the power saved and the reduction in the value of the monthly contracted demand, which implies savings of R$ 2,291.66.
Table 4 – Power production of the GCPVS
Description Quantity Unit Price (R$) Amount (R$)
Reduced demand active (kW) 37,5 31,32 1.174,34 Monthly electricity production (kW h) 5.119,47 0,22 1.117,33
Total 2.291,66
Source: authors
5 FINANCIAL ANALYSIS
The most commonly used economic indicators in the financial viability studies are: Payback, net present value (NPV), and internal rate of return (IRR).
HOLOS, Year 32, Vol. 1 291
5.1 net present value (NPV)
The net present value (NPV) aims the viability of an investment project by calculating the present value of all their cash flows, and for that reason is an indicator widely used in studies of economic feasibility analysis. In the case of this research, the cash flows will be the values of power saved every month by using the GCPVS.
For present value, it shall mean the current value of a certain amount receivable in the future. Like any other investment, the GCPVS will only generates cash flow in the future, and it is necessary to update the value of each cash flow to the present and compare it with the amount invested. In the case of the investment value is less than the present value of the cash flows, NPV is positive, which means that the project presents a positive profitability. Otherwise, NPV will result negative. 𝑉𝑃𝐿 = (∑ 𝐹𝐶𝑡 (1+𝑖)𝑡 𝑛 𝑡=1 ) − 𝐼 Eq. 2 Where:
𝐹𝐶𝑡 = monthly cash flow in Real 𝑖 = interest rate of invested capital 𝑡 = time in months
𝐼 = project investment in Real 𝑛= GCPVS useful life in months.
The annual tariff adjustment is foreseen in the concession contract of providers, so to correct the tariff value was considered the annual average of 0.585833% of general market price index (IGPM). In this case, the value of the initial cash flow of R$ 2,291.66 (CF1) subtracted from
the value of R$ 300.00 needed for maintenance of GCPVS and the correction by the IGP-M was made monthly.
The interest rate on the invested capital was 0.5713% (average of 12 months of saving), the project investment was R$ 271,918.76, and the useful life of the SFCR is 240 months.
By applying these values in Equation 2, it has the NPV of R$ 211,670.00. In other words, at the end of the useful life of GCPVS, the investment will have been paid and still generated an economy of R$ 211,670.00.
5.2 PAYBACK
Payback is the time required to recover the initial investment. The rule that will determine whether an investment is acceptable or not, by the Payback value, is given for a specific period of time (years). The Payback calculation is simple, just sum up the future net cash flows (power produced) for each year until it reaches the value of the initial cost of the project, so it has the total recovery time of the investment.
As the Payback refers to the time required to recover the investment made, you can use the Equation 2 to find the t value that results in a NPV equal to zero. The obtention of the t value for the null VPL was made through numerical iteration, due to the complexity of calculating t analytically. Thus, knowing that the value of NPV = 0, i = 0.5713% (average of 12 months of savings), I = 271,918.76, n = 240 months (GCPVS useful life of 20 years), the value of t = 136 months. That is to say, it would take 11 years for the recovering of the investment.
HOLOS, Year 32, Vol. 1 292
5.3 INTERNAL RATE OF RETURN (IRR)
The internal rate of return (IRR) represents the profitability generated by certain investment (widely used as one of the key indicators in studies of feasibility analysis), i.e. exposes an interest rate that if the capital had been placed at that rate, we would get exactly the same final rate of return. In other words, it represents a tax that, if used as discount rate, makes the NPV equal to zero. From the moment that the profitability of investment projects is known, the decision criterion on investment is simply to accept projects that present IRR higher than financing cost, plus a specific risk rate that is associated with them.
As well as Payback, the obtention of the IRR value was made through numerical iteration, due to the complexity of calculating i analytically.
Thus, knowing that the value of NPV = 0, I = 271,918.76, n = 240 months (GCPVS useful life of 20 years), the value of i = 0.7821%. That is, the rate of return on investment is higher than the savings, for the 20-year period considered.
Figure 1 represents the variation of NPV over time. In that, we can observe that the investment made is recovered in 136 months and the NPV turns out to be positive.
Figure 1 - Variation of NPV over time (own authorship)
6 FINAL CONSIDERATIONS
The IFRN, according to its political pedagogical project (PPP), while educational institution proposes to promote a training based on a humanistic vision and anchored in several principles, among them: the social justice with equality, citizenship, ethics, empowerment, and environmental sustainability. Thereby, the campus João Câmara/RN comes since the year 2009 developing an implementation policy of higher education in renewable energy technology. In this sense, the present research was important for the implementation of environmental sustainability practices and in optimization of public resources and pedagogical practices geared to the use of technology in benefit of society.
The university degree in renewable energy technology aims to train qualified technologists working in generation, transmission and distribution of energy from renewable sources, as wind, solar and hydraulic. Thus, this project will have a key role not only in the financial factor, but also in the technical and pedagogical aspects, as it will serve as a laboratory for the students' practical
HOLOS, Year 32, Vol. 1 293 lessons in the understanding of a whole production project of a grid-connected photovoltaic system.
From a technical point of view, the campus presents viability, once is situated in a region with good average daily insolation. The campus receives an average of 5,690 Wh solar energy per day at every square meter of area, equivalent to an average power of 1,000 W solar energy at every square meter during 5 hours and 42 minutes a day. Furthermore, the construction of the campus is predominantly horizontal, which minimizes the existence of shaded area.
From a financial point of view, the GCPVS will have an installed power of 37.5 kW and an average estimate production of 5119.47 kWh of electricity, representing 18% from 28,001.36 kWh that is the average monthly consumption on campus. The power generated will result in monthly savings of R$ 1,174.34. In addition to the savings in consumption, the electricity production in GCPVS will enable a reduction from 164 kW to 126.5 kW in the value of the contracted demand, as the installed power of GCPVS will decrease the need for power demand from the provider. This reduction shall represent savings of R$ 1,117.33 per month. Thereby, the total saving (consumption and demand contracted) shall be R$ 2,291.66 monthly.
The total estimated investment value for GCPVS implementation is R$ 271,918.86. The method used for calculating the time of return on investment was Payback and the following parameters were considered for the calculation of cash flow:
Average of IGP-M in the last 12 months was 0.585833%, as adjustment rate of electrical energy tariff;
Average of savings in the last 12 months was 0.5713%, as interest rate on invested capital;
Average monthly cost of R$ 300.00, as maintenance monthly cost of the GCPVS.
The cash flow was calculated with these parameters and the Payback resulted in 136 months, i.e. in 11 years, the amount spent in the system implementation is recovered. Thus, at the end of 20 years, which is the GCPVS useful life, a positive NPV of R$ 211,670.00 shall be obtained, i.e. the system will compensate the amount invested and still provide a rate of return higher than the savings rate.
In the environmental aspect, besides offering virtually any impact on the environment with the GCPVS installation, the system will reduce greenhouse gas emissions from fossil fuels due to the reduction of power consumed from the grid.
As a suggestion for future work, similar projects can be developed with wind and solar thermal generation, as well as systems that incorporate more than one form of energy generation, i.e. hybrid systems. Additionally, a comparative analysis can be made between efficiencies and return on investment for each of these systems.
7 REFERENCES
1. Manual de Instalação de Sistemas Fotovoltaicos PHB. Retirado da internet: http://www.phb.com.br/PDFs/Produtos/Solar/Estruturas/PHB%20-%20Manual%20
de%20Instala%C3%A7%C3%A3o%20para%20SFV%20em%20Telhados.pdf. Consultado em 30/07/2015.
HOLOS, Year 32, Vol. 1 294 revisada e atualizada. CRESESB. Rio de Janeiro, 2014.
3. ARORA, M.L., BARTH, E., UMPHRES, M.B. Technology evaluation of sequencing batch reactors. Journal Water Pollution Control Federation, v.57, n.8, p. 867-875, ago. 1985.
4. DATAR, M.T., BHARGAVA, D.S. Effects of environmental factors on nitrification during aerobic digestion of activated sludge. Journal of the Institution of Engineering (India), Part EN: Environmental Engineering Division, v.68, n.2, p.29-35, Feb. 1988.
5. FADINI, P.S. Quantificação de carbono dissolvido em sistemas aquáticos, através da análise por injeção em fluxo. Campinas, 1995. Dissertação de mestrado-Faculdade de Engenharia Civil-Universidade Estadual de Campinas, 1995.
6. ANDRADE, M. M. Introdução à metodologia do trabalho científico. São Paulo: atlas, 2010. 7. ANEEL, a. A. N. de E. E. Resolução normativa 481. 2004. Disponível em: http://www.aneel
.gov.br/cedoc/ren2012481.pdf>. Acesso em: 23 maio 2014.
8. ANEEL, a. A. N. de E. E. Resolução normativa 517. 2012. Disponível em: http://www.aneel .gov.br/cedoc/ren2012517.pdf>. Acesso em: 23 maio 2014.
9. BLOGMURASKI. Painel solar residencial. 2014. Disponível em: <http://blogmuraski. files.wordpress.com/2013/08/paineis-fotovoltaicos-foto01.jpg>. Acesso em: 02 de junho 2014.
10. BRASIL, A. atlas de energia elétrica do Brasil. Brasília: Agência Nacional de Energia Elétrica, 2002.
11. LISITA, O. J. Sistema fotovoltaico conectado a rede: Estudo de caso - 3kWp instalado no
Estacionamento do IEE-USP. Tese (Doutorado) — Universidade de São Paulo - USP, 2005.
12. LIMA, R. M. R. Optimização de células fotovoltaicos. Tese (Doutorado) — Universidade de Nova Lisboa - UNL, 2013.
13. LOPEZ, R. A. Energia solar para a produção de eletricidade. São Paulo: Artliber, 2012.
14. ENGINEERING, e. e-Learning tools for E. Tecnologia das células. 2003. Disponível em: <http://e-lee.ist.utl.pt/realisations/EnergiesRenouvelables/FiliereSolaire/Panneau
xPhotovoltaiques/Cellule/Technologie.htm>. Acesso em: 05 maios 2014.
15. GNOATTO, E. et al. Determinação de curvas características de um painel fotovoltaico em
condições reais de trabalho. SIGCOMM Comput. Commun. Rev., Maringá-PR, p. 191–196,
20005. Disponível em: http://www2.unemat.br/rivanildo/docs/artigos/2005 _04.pdf>. 16. PEREIRA, F. A. d. S.; OLIVEIRA, M. n. S. Curso Técnico Instalador de Energia Solar Fotovoltaica.
Porto: Publindústria, 2011.
17. PINA, J. A. M. Optimização de células fotovoltaicos. Tese (Doutorado) — Universidade de Nova Lisboa - UNL, 2013.
18. PROCEL, p. N. de Conservação de E. E. Manual de tarifação da energia elétrica. Brasília - DF: Eletrobrás, 2001.
19. ROCHA, A. V. et al. Análise da radiação global em natal/rn entre abril de 2011 a março de 2012
e sua influência na produção de energia elétrica. SIGCOMM Comput. Commun. Rev., IFTO,
Palmas - TO, p. 69–74, out. 2012. ISSN 0146-4833. Disponível em: <http://propi.ifto.edu.br/ocs/index.php/connepi/vii/paper/view/1420>.