RESEARCH ARTICLE
Increased B Cell ADAM10 in Allergic Patients
and Th2 Prone Mice
Lauren Folgosa Cooley1,2, Rebecca K. Martin2, Hannah B. Zellner2, Anne-Marie Irani3, Cora Uram-Tuculescu4, Mohey Eldin El Shikh5‡, Daniel H. Conrad2‡*
1Center for Clinical and Translational Research, Virginia Commonwealth University, Richmond, Virginia, United States of America,2Department of Microbiology and Immunology, Virginia Commonwealth University, Richmond, Virginia, United States of America,3Department of Pediatrics, Division of Allergy and Immunology, Virginia Commonwealth University, Richmond, Virginia, United States of America,
4Department of Pathology, Division of Anatomic Pathology, Virginia Commonwealth University, Richmond, Virginia, United States of America,5Experimental Medicine and Rheumatology, William Harvey Research Institute, Queen Mary University of London, London, United Kingdom
‡These authors are joint senior authors this work.
Abstract
ADAM10, as the sheddase of the low affinity IgE receptor (CD23), promotes IgE production and thus is a unique target for attenuating allergic disease. Herein, we describe that B cell levels of ADAM10, specifically, are increased in allergic patients and Th2 prone WT mouse strains (Balb/c and A/J). While T cell help augments ADAM10 expression, Balb WT B cells exhibit increased ADAM10 in the naïve state and even more dramatically increased ADAM10 after anti-CD40/IL4 stimulation compared C57 (Th1 prone) WT B cells. Further-more, ADAM17 and TNF are reduced in allergic patients and Th2 prone mouse strains (Balb/c and A/J) compared to Th1 prone controls. To further understand this regulation, ADAM17 and TNF were studied in C57Bl/6 and Balb/c mice deficient in ADAM10. C57-ADAM10B-/-were more adept at increasing ADAM17 levels and thus TNF cleavage result-ing in excess follicular TNF levels and abnormal secondary lymphoid tissue architecture not noted in Balb-ADAM10B-/-. Moreover, the level of B cell ADAM10 as well as Th context is critical for determining IgE production potential. Using a murine house dust mite airway hypersensitivity model, we describe that high B cell ADAM10 level in a Th2 context (Balb/c WT) is optimal for disease induction including bronchoconstriction, goblet cell metaplasia, mucus, inflammatory cellular infiltration, and IgE production. Balb/c mice deficient in B cell ADAM10 have attenuated lung and airway symptoms compared to Balb WT and are actual-ly most similar to C57 WT (Th1 prone). C57-ADAM10B-/-have even further reduced sympto-mology. Taken together, it is critical to consider both innate B cell levels of ADAM10 and ADAM17 as well as Th context when determining host susceptibility to allergic disease. High B cell ADAM10 and low ADAM17 levels would help diagnostically in predicting Th2 disease susceptibility; and, we provide support for the use ADAM10 inhibitors in treating Th2 disease.
OPEN ACCESS
Citation:Cooley LF, Martin RK, Zellner HB, Irani A-M, Uram-Tuculescu C, El Shikh ME, et al. (2015) Increased B Cell ADAM10 in Allergic Patients and Th2 Prone Mice. PLoS ONE 10(5): e0124331. doi:10.1371/journal.pone.0124331
Academic Editor:Muriel Moser, Université Libre de Bruxelles, BELGIUM
Received:January 12, 2015
Accepted:March 3, 2015
Published:May 1, 2015
Copyright:© 2015 Cooley et al. This is an open access article distributed under the terms of the Creative Commons Attribution License, which permits unrestricted use, distribution, and reproduction in any medium, provided the original author and source are credited.
Data Availability Statement:All relevant data are within the paper and its Supporting Information files.
Introduction
A disintegrin and metalloproteinases (ADAMs) are zinc dependent proteinases, which perform ectodomain cleavage of transmembrane proteins. ADAM10 and ADAM17, or tumor necrosis factor alpha (TNF) converting enzyme (TACE), are structurally related and share overlapping substrates including TNF [1,2]. ADAM10 contributes to allergic disease being the principal sheddase of CD23, the low affinity IgE receptor, which promotes IgE production [3,4] and is
increased in allergic patients’sera [5]. In an experimental asthma model [4,6], ADAM10
inhib-itor administration significantly attenuated airway hyperreactivity, suggesting that increased ADAM10 activity predisposes to allergic disease.
The Th1/Th2 paradigm is attributed to differences in CD4+ T cell response and has been studied extensively in both mice and humans. Allergic diseases are skewed towards a Th2 phe-notype and classic Th1 (such as C57Bl/6 and SJL/J) and Th2-prone (such as Balb/c and A/J) strains were characterized as high (Balb/c, A/J), intermediate (C57Bl/6), and low (SJL/J) IgE
re-sponders based onin vivoIgE production post immunization [7]. Whether B cells from Th1 or
Th2-biased mouse strains have intrinsic differences in ADAM10 and ADAM17 and if such dif-ferences affect IgE production has never been elucidated.
In the absence of B cell ADAM10 (B-ADAM10) in C57Bl/6 mice (C57-ADAM10B-/-), a key
compensatory increase in ADAM17 and thus TNF shedding [8] results in aberrant B cell/T cell localization, reduced germinal center formation, decreased follicular dendritic cell (FDC) mat-uration, excessive collagen deposition, and increased high endothelial venule (HEV) formation [8–11]. Furthermore, C57-ADAM10B-/-mice were less susceptible to airway hypersensitivity induction, suggesting a specific role for B-ADAM10 in provoking allergic disease [6]. This
phe-notype is C57-ADAM10B-/-mice is not found, however, in Balb-ADAM10B-/-mice thus posing
a critical question about ADAM10 and ADAM17 regulation in different Th contexts. Herein, we explore key differences between typical Th1 and Th2 prone strains with respect to ADAM10, ADAM17, and TNF and in ADAM17 regulation following ADAM10 deletion.
We further extend our studies to allergic disease situations both in humans using active al-lergic rhinitis patients and in mice by using a clinically relevant house dust-mite (HDM) airway model. We investigate specifically whether intrinsic differences in B cell ADAM10 levels, inde-pendent of Th bias, regulates allergy induction and severity and whether this regulation is asso-ciated with modulation of B cell ADAM17 and TNF and assoasso-ciated changes in secondary lymphoid follicular architecture.
Materials and Methods
Ethics Statement
All human studies were approved by the Virginia Commonwealth University IRB. Patients were informed of the study and consented by Dr. Anne-Marie Irani using the approved IRB survey: IRB #00870. Patients were described the IRB approved survey and then signed the waiver enclosed. All animal care and experimental protocols were approved by Virginia Com-monwealth University Institutional Animal Care and Use Committee and were in accordance with NIH guidelines. Mice were sacrificed by isoflurane inhalation followed by cervical disloca-tion. Anesthesia used for intranasal injections was mixed oxygen/isoflurane.
Mice
C57Bl/6 ADAM10B-/-(CD19-cre+) mice (C57-ADAM10B-/-) were generated [12] and
back-crossed to Balb/c (Balb-ADAM10B-/-) for 8 generations and compared to littermate controls
(CD19-cre-). A/J, SJL/J, C57Bl/6, and Balb/c WT were from Jackson Laboratories. All mice
were 6–12 weeks when used. All animal care and experimental protocols were approved by Virginia Commonwealth University Institutional Animal Care and Use Committee and were in accordance with NIH guidelines.
Human studies
All human studies were approved by the Virginia Commonwealth University IRB. Sixteen symptomatic allergic rhinitis patients and 16 controls were recruited for the study by Dr. Anne-Marie Irani at VCU. Inclusion criteria included active allergic rhinitis symptoms and a documented positive skin test or ImmunoCAP to an antigen as consented in IRB #00870 (S1
FigPeripheral blood mononuclear cells (PBMC) were isolated from peripheral blood using
Ficoll, stained, and remaining PBMC underwent CD19 B cell selection using magnetic beads (Miltenyi Biotec). B cells were cultured for 2 days (or 5 days for CD23 ELISA) with 200 ng/mL
human IL-21 (ATCC), 1μg/mL anti-CD40 (Clone G28-5, ATCC), and 10 ng/mL rhIL-4
(R&D). Stimulated B cells were harvested, stained for flow cytometry, analyzed by qPCR, and
sCD23 determined by ELISA [13]. HDMDermatophagoides pteronyssinusIgE was determined
by ImmunoCAP (Phadia, 14-4107-01).
Murine B cell culture and TNF ELISA
Positively selected B220+ splenic B cells (Miltenyi Biotec) were grown for 1–3 days in cultures containing 1000 units IL-4 and 50μg/mL LPS (E.coli0111:B4, Sigma) or 1.25μg/mL purified anti-mouse CD40 (Biolegend) [8]. Supernatants were analyzed for sTNF by ELISA
(eBioscience).
Murine HDM studies
C57Bl/6 WT, C57-ADAM10B-/-, Balb/c WT, and Balb-ADAM10B-/-mice were intranasally
ex-posed to 25μL saline or 15μg/25μL HDM extract (Greer Laboratories) (S2 Fig) [14].
Broncho-constriction was assessed using Flexivent (Scireq, Montreal, QC, Canada) as previously described [15]. Airway resistance (Rrs) was determined at increasing doses of methacholine (5, 10, 25 mg/ml) and presented as percent increase from PBS baseline. HDM specific IgE
deter-mined by ELISA as described [16]. Briefly, plates were coated with 20μg/mL HDM extract in
50mM carbonate buffer, blocked with SuperBlock (Thermo Scientific), detected using goat anti-mouse IgE (Abcam), followed by addition of Streptavidin-HRP (Southern Biotechnolo-gies), and color developed with tetramethylbenzidine + substrate (BD Biosciences). Reaction
was stopped with 1N H2SO4and absorbance read at 450nm.
BALF cells were stained with APC-B220, APC-CD3, BV421-1A/1E, BV605-CD11c, and PE-CCR3 (Biolegend) after FcR blockade with anti-mouse CD16/32 (2.4G2). Samples were ex-amined on a BD Fortessa and analyzed with FCS Express, v. 4. using the gating strategy de-scribed [17]. BALF supernatants were analyzed for MUC5AC protein by ELISA as dede-scribed
[15]. Briefly, BALF was diluted and 75μL was incubated with 75μL carbonate buffer. Samples
were incubated overnight without a lid at 37°C then washed three times with PBS. Plates were blocked, detected with anti-Muc5AC mouse monoclonal antibody (Pierce, 1:100), followed by addition of goat anti-mouse IgG-HRP (Southern Biotechnologies,1:10,000), developed with
tetramethylbenzidine + substrate (BD Biosciences), stopped with 1N H2SO4, and absorbance
read at 450nm.
Murine Lung histology
Fiveμm sections of formalin-fixed, paraffin-embedded murine lung tissue were stained with
hematoxylin and eosin (H&E) and Periodic acid-Schiff (PAS) (AML Laboratories, Inc. Balti-more, MD) and photographed using Olympus-DP70 camera on Olympus-BX41 microscope. Histopathologic evaluation of H&E stained lung sections from at least 4 mice per group was performed by a pathologist in a blinded fashion using a semi-quantitative scoring system on a Nikon Eclipse microscope. Peribronchiolar and perivascular inflammatory cellular infiltration were scored separately as follows: 0, no or occasional cells; 1, few or loosely arranged cells; 2, focal involvement of lung parenchyma with majority of airways or vessels having rings (partial or complete) of inflammatory cells one cell layer deep; 3, patchy involvement of lung parenchy-ma with parenchy-majority of airways or vessels having rings (partial or complete) of inflamparenchy-matory cells two to four cell layers deep; 4, extensive involvement of lung parenchyma with majority of air-ways or vessels having rings (partial or complete) of inflammatory cells more than four cell lay-ers deep. Individual scores for peribronchiolar and perivascular inflammation were added together for a total maximum score of 8.
qPCR and western blotting
Total RNA was extracted using TRIzol reagent (Invitrogen) and quantified by NanoDrop-100 spectrophotometer. Real-time quantitative PCR was performed with an iQ5 (Bio-Rad Labora-tories) [8]. TaqMan quantitative PCR assays (Applied Biosystems, Life Technologies) were run using primers/probes: TNF (Mm00443258 or Hs01113624), ADAM10 (Mm00545742 or Hs00153853), ADAM17 (Mm00456428 or Hs01041915), 18s (Mm03928990), and GAPDH
(Hs02758991). Fold variation analyzed using delta-delta Ct (∆∆Ct) formula [18].
Proteins were assessed by western blot [8] using rabbit-anti-β-actin peroxidase
(Sigma-Al-drich) or anti-ADAM17 (Abcam) followed by HRP-anti-rabbit IgG and detected with Super-Signal West Pico Chemiluminescent Substrate (Thermo Scientific).
Flow cytometry
Mouse B220+ B cells or human PBMC were blocked with 10μg 2.4G2 or human FcR blocker
(Miltenyi Biotec), respectively. Human PBMC was stained with anti-human PE-CD19, APC-CD14, or PE-CD3 (Biolegend). Mouse and human cells were washed, fixed, permeabi-lized, blocked again, and stained with their respective antibodies: FITC-hADAM10 (R&D), PE-mADAM10 (R&D) and/or rabbit-ADAM17 (Abcam) followed by DyLight-649 anti-rabbit IgG (Biolegend). Isotype control for hADAM10 is mouse IgG2b FITC (R&D), for mADAM10 is Rat IgG2a PE (R&D), and for ADAM17 is rabbit IgG. Tyramide Signal Amplifi-cation (Kit #26) was used for mouse B cell TNF staining as described [8]. Dead cells and aggre-gates were excluded by scatter gating, examined on a BD Canto, and analyzed with FCS Express, v.4.
Immunohistochemistry and confocal microscopy
Tenμm frozen mouse LN sections were dual and triple-labeled for FDCs (PE-anti-CD21/
Statistical analysis
Normal distribution of data sets was determined using the Shapiro-Wilk normality test with SigmaPlot 12.5. Furthermore, the mean and medians were close for data sets indicative of normal distribution. Significance (p<0.05) was calculated using unpaired two-tailed Student
ttests (Figs1–5) and one-way ANOVA with Tukey post-test (Figs5and6) in GraphPad
Prism. Error bars represent SD; except inFig 1Awhere error bars represent 95% confidence
interval.
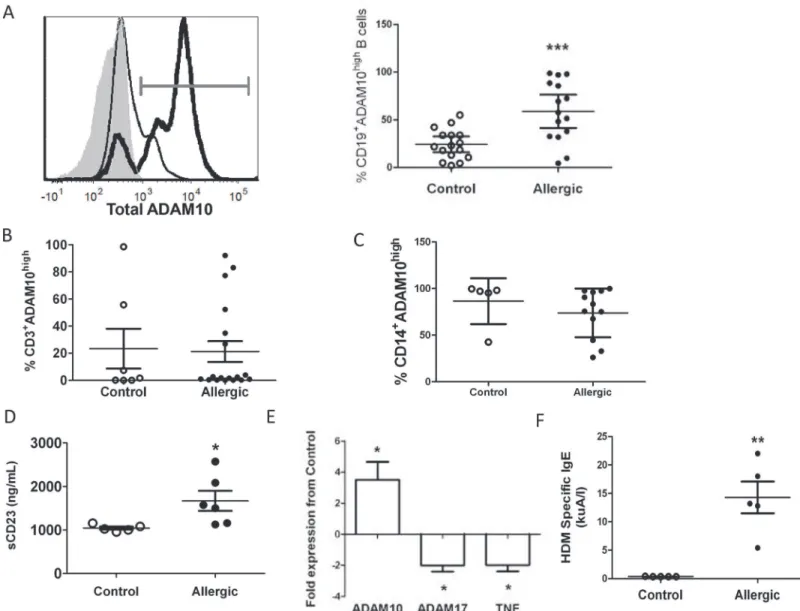
Fig 1. Allergic patient B cells exhibit increased ADAM10 and sCD23 but decreased ADAM17 and TNF.(A) Total ADAM10 in naïve CD19+B cells from
control (thin line, open dot) and allergic (bold line, black dot) patients; dot plot (right) shows percent of total B cells staining high in ADAM10 (grey gate). Isotype control is shaded grey in histogram. (B,C) Total ADAM10 on naïve T cells (B) and monocytes (C). (D) sCD23 from control (open dot) or allergic (black dot) supernatants. (E) Naïve B cells from 4 allergic and 4 control patients analyzed for ADAM10, ADAM17, and TNF message normalized to GAPDH. Significance (*) indicates2 fold change between allergic and control B cells for respective gene. (F) HDM specific IgE levels in sera of control (open dot) or allergic (black dot) patients determined by ImmunoCAP.<0.35kuA/l considered a negative result.*p<0.05,**p<0.005,***p<0.0005.
doi:10.1371/journal.pone.0124331.g001
Results
Allergic patients exhibit increased B cell ADAM10, CD23, and IgE
Given the increased circulating sCD23 in the sera of allergic patients [5], we hypothesized that actively allergic patients would exhibit increased B-ADAM10 compared to controls. Naïve B cells from 16 allergic patients exhibited significantly increased B-ADAM10 compared to 16 controls (Fig 1A) by flow cytometric analysis. Contrastingly, T cells (Fig 1B) and monocytes (Fig 1C) from allergic and control patients revealed comparable ADAM10 expression. Thus, only B-ADAM10 expression served as an allergy-associated differential indicator.
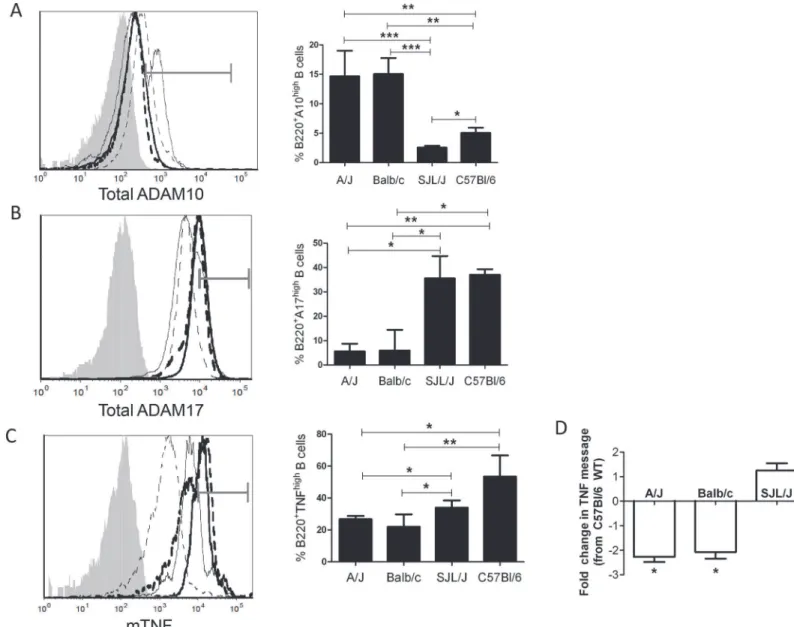
Fig 2. Increased B-ADAM10 and decreased ADAM17 and TNF in Th2 biased strains.Naïve B220+B cells (A, B) stained for total ADAM10 (A) or
ADAM17 (B) expression by flow cytometry. (C) TNF coexpression on 3 day stimulated (anti-CD40+IL4) B220+B cells by TSA. (A,B,C) Bar graph represents
percent total B cells staining high in ADAM10 (A), ADAM17 (B), or TNF (C). (A,B,C) Balb/c (──)A/J (----), C57Bl/6 (▬▬▬), SJL (▪▪▪▪▪), respective isotype
control (shaded grey) in representative overlay (left); grey gate demonstrates high stained population. n = 8 per group, 3 independent studies.*p<0.05,
**p<0.005,***p<0.0005. (D) TNF message from 3 day stimulated (anti-CD40 + IL4) B220+B cells. Presented as fold change from C57Bl/6 WT.
*signifies
2 fold change between C57Bl/6 WT and the listed WT strain.
Furthermore, increased sCD23 in allergic B cell cultures indicated high ADAM10 activity in al-lergic B cells (Fig 1D). B-ADAM10 message in alal-lergic patients was increased nearly 5-fold, while ADAM17 and TNF message were decreased 2-fold compared to controls (Fig 1E).
Given that increased B-ADAM10 leads to increased IgE production through CD23 cleavage [4], we next compared serum antigen-specific IgE between allergic and control patients. We were reliant on each patient self-reporting a specific antigen to which he/she was allergic in order to perform an antigen specific ImmunoCAP [19]. Five of 16 allergic patients self reported
HDM sensitivity and ImmunoCAP demonstrated positive HDM specific IgE levels (>0.35
kuA/I) (Fig 1F). Five control patients, who are also quite likely exposed to HDM daily but do
not develop allergy, demonstrated negative ImmunoCAP results (<0.35 kuA/I) or very low
lev-els (0.41kuA/l) (Fig 1F). We next compared each individual patient’s HDM-specific IgE result
to his/her respective B cell ADAM10 expression (Table 1). In general, all control patients
ex-hibited very low or negative HDM specific IgE and low ADAM10 expression (<25%)
(Table 1). As HDM specific IgE levels increased, B cell ADAM10 expression also increased in
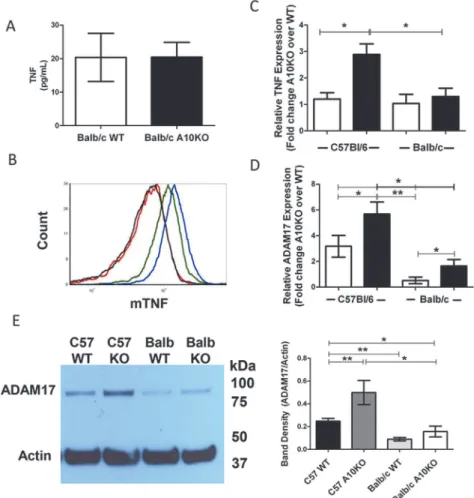
Fig 3. B cell TNF and ADAM17 regulation in C57Bl/6 and Balb/c ADAM10B-/-(A10K0) and WT.(A) sTNF or (B) mTNF from 3 day stimulated (LPS + IL4) B cell cultures; (B) Balb/c WT (black), Balb/c A10KO (red), C57Bl/6 WT (green), and C57Bl/6 A10KO (blue) B cells. (C) Fold change (A10KO over WT) in relative TNF message from naïve (white) or 3 day stimulated (anti-CD40+IL4) (black) B cells normalized to 18s. (D) Fold change (A10KO over WT) in relative ADAM17 expression normalized to 18s for naïve (white) or 3 day stimulated (black) B cells. (C,D)*signifies2 fold change between groups. (E) ADAM17 (~93kDa) and actin (~42kDa) from 5 day stimulated (anti-CD40 + IL4) B cells (left) and band densitometry (right). KO = A10KO. n = 9 per group, 3 independent studies.*p<0.05,**p<0.005.
doi:10.1371/journal.pone.0124331.g003
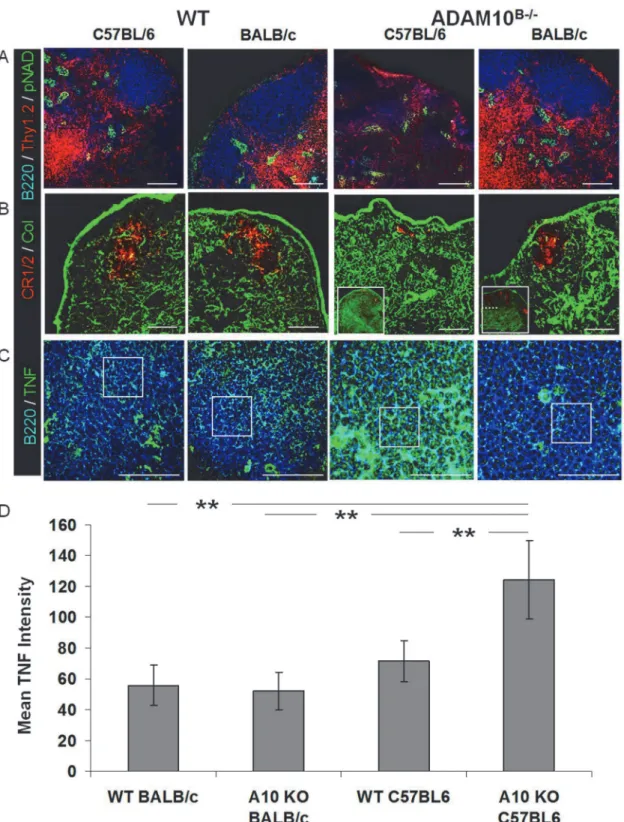
Fig 4. Balb-ADAM10B-/-LN exhibit WT architecture unlike C57-ADAM10B-/-nodes.Naïve LN sections from C57Bl/6 and Balb/c WT and ADAM10B-/-; (A)
B cell (blue, B220), T cell (red, Thy1.2), and HEV (green, pNAD); (B) FDC reticula (red,CR1/2), collagen (green), and cortico-medullary junction (dotted line in inset box); (C) TNF staining (green), B cell (blue, B220) follicle. (D) Average TNF staining intensity representing 12 follicle sections per group. Scale bar, 50μm.**p<0.005.
allergic patients. One allergic patient, however, had a lower HDM specific IgE result at 5.4 kuA/l, but demonstrated a high B cell ADAM10 level (69%) (Table 1). This patient, specifically, reported multiple antigens to which he/she is allergic. Therefore, 5.4 kuA/l reflects only the level of HDM specific IgE and is most likely lower than the total antigen specific IgE present in
the serum. Overall,Fig 1andTable 1demonstrates a correlation between increased serum
anti-gen-specific IgE and increased B cell ADAM10 in allergic patients.
Increased B-ADAM10 and decreased ADAM17 and TNF in Th2 prone
strains
Since B cell levels of ADAM10, ADAM17, and TNF mRNA expression were clearly different in control and allergic patients; and allergy is a Th2-dominated disorder; we sought to confirm our results in classic Th1 and Th2 prone mouse strains. Naïve B cells from Th2 prone Balb/c and A/J expressed higher total ADAM10 (Fig 2A) and decreased total ADAM17 (Fig 2B)
com-pared to Th1 prone C57Bl/6 and SJL/J. Upon stimulationin vitro, B cells from the chosen Th1
prone strains expressed increased mTNF compared to the chosen Th2 prone strains (Fig 2C). Furthermore, TNF message was lower in Th2 prone A/J and Balb/c mice compared to C57Bl/6
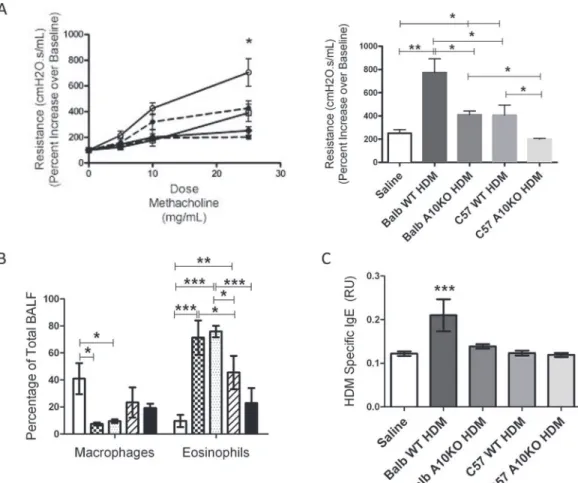
Fig 5. B-ADAM10 deletion attenuates bronchoconstriction and HDM specific IgE.(A) Airway resistance (cmH20.s/mL) with increasing doses of methacholine (left); Balb-WT (──,), Balb-ADAM10B-/-(——,●), C57-WT (──,□), C57-ADAM10B-/-(——,■), Saline (──,●) presented as fold increase from saline control. Bar graph (right) represents 25 mg/mL methacholine dose. (B) Percent macrophages (left) and eosinophils (right) from total BALF determined by flow cytometry; Saline control (white), Balb WT (checkered), Balb-ADAM10B-/-(dotted), C57 WT (slash), and C57-ADAM10B-/-(black). (C) HDM specific
IgE production. n = 7–9 per group, 3 independent experiments. All mice immunized with saline demonstrated comparable results. For simplicity, saline represents Balb WT mice given saline.*p<0.05,**p<0.005,***p<0.005.
doi:10.1371/journal.pone.0124331.g005
WT by2 fold (Fig 2D). C57Bl/6 WT TNF expression was not significantly different from SJL/J levels of TNF expression (Fig 2D). B cell ADAM10 in both Th1 prone-C57Bl/6 and Th2
prone-Balb/c strains increased followingin vitrostimulation (S1 Table). However, Th2 prone
Balb/c maintained a consistently higher level of B cell ADAM10 even after equal stimulation (S1 Table). This finding demonstrates that T cell help augments ADAM10 expression but does
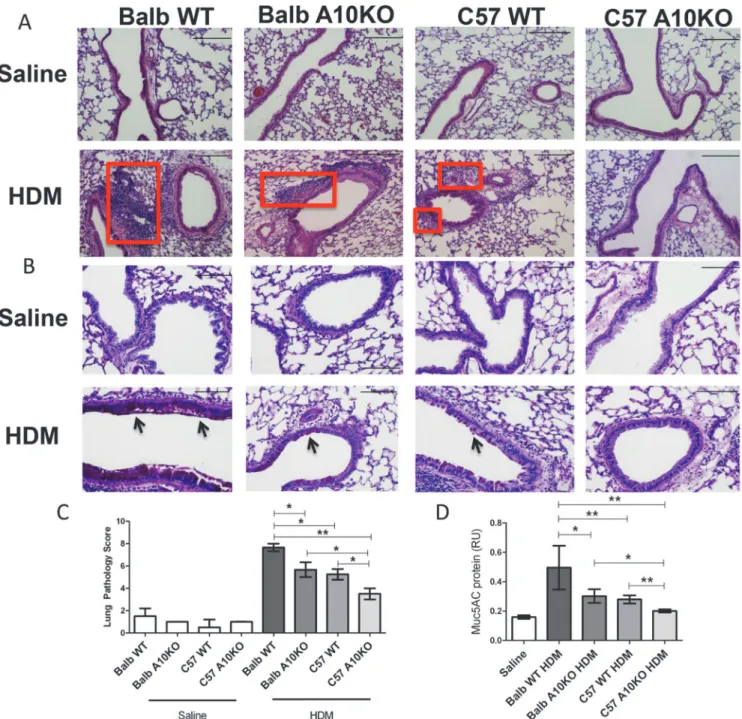
Fig 6. B-ADAM10 deletion reduces cellular infiltration, goblet cell metaplasia, and mucus production in a strain dependent manner.(A) H&E stain for lung tissue demonstrates peribronchiolar and perivascular inflammatory cellular infiltration (red box); 10x magnification, scale bar 200μm. (B) Goblet cell metaplasia determined by PAS stain; note dark pink mucin producing cells (black arrow) and alveolar epithelium thickness; 20x magnification, scale bar 100μm. (C) Lung pathology score representing quantitation of peribronchiolar and perivascular inflammatory cellular infiltration on H&E stained lung sections; 2 sections per mouse and at least 4 mice per group were assessed. (D) MUC5AC protein. n = 7–9 per group, 3 independent experiments. All mice immunized with saline demonstrated comparable results. For simplicity, saline represents Balb WT mice given saline.*p<0.05,**p<0.005.
not provide the mechanism by which B-ADAM10 is initially increased in Th2 prone over Th1 prone strains.
Differential ADAM17 and TNF in Balb-ADAM10
B-/-compared to
C57-ADAM10
B-/-C57-ADAM10B-/-B cells exhibit a compensatory increase in ADAM17 expression and
func-tion resulting in excessive TNF cleavage, which provided the mechanism for the aberrant
sec-ondary lymphoid tissue architecture noted in these mice [8,9]. Given our results in Figs1and
2, we predicted that Th2 prone Balb-ADAM10B-/-B cells would exhibit reduced ADAM17 and
TNF compared to Th1 prone C57-ADAM10B-/-B cells, which may help to maintain WT
lym-phoid tissue architecture. Distinctively, sTNF production by Balb-WT and Balb-ADAM-10
B-/-B cells was comparable followingin vitrostimulation (Fig 3A) unlike our previous report in
C57Bl/6 [8], which demonstrated significantly increased sTNF production by
C57-ADAM10B-/-B cells compared to WT in the samein vitroconditions. Furthermore,
mTNF in stimulated B cells is comparable between Balb-WT and Balb-ADAM10B-/-but
re-duced compared to C57-WT and even further rere-duced compared to C57-ADAM10B-/-(Fig
3B). Similarly to C57, Balb-WT and Balb-ADAM10B-/-express comparable TNF message in
the naïve state (Fig 3C). Upon stimulation, however, Balb-ADAM10B-/-B cells fail to
signifi-cantly increase TNF message above Balb-WT levels unlike C57-ADAM10B-/-B cells (Fig 3C).
Furthermore, C57-ADAM10B-/-B cells exhibit increased TNF message compared to
Balb-ADAM10B-/-(Fig 3C).
Given that TNF levels were reduced in Balb-ADAM10B-/-compared to C57-ADAM10B-/-B
cells, we next compared the levels of ADAM17 protein and message. Unlike C57Bl/6,
ADAM17 message in naïve Balb-WT and Balb-ADAM10B-/-B cells was comparable and
in-creased to 2-fold higher expression in Balb-ADAM10B-/-B cells upon stimulation (Fig 3D).
C57-ADAM10B-/-B cells exhibited increased ADAM17 protein (Fig 3E) compared to
C57-WT, but also compared to Balb-WT and most interestingly, Balb-ADAM10B-/-.
Further-more, ADAM17 protein was comparable between Balb-WT and Balb-ADAM10B-/-, which is
consistent with TNF production inFig 3A(Fig 3E)
Unlike C57-ADAM10
B-/-, Balb-ADAM10
B-/-exhibit normal secondary
lymphoid tissue architecture
Given the marginal changes in TNF and ADAM17 (Fig 3) in Balb-ADAM10B-/-compared to
our previous report in C57-ADAM10B-/-[8], we hypothesized Balb-ADAM10B-/-lymph nodes
would maintain WT architecture. Indeed, Balb-ADAM10B-/-exhibited comparable primary
follicular characteristics to C57-WT and Balb-WT, including normal B cell/T cell
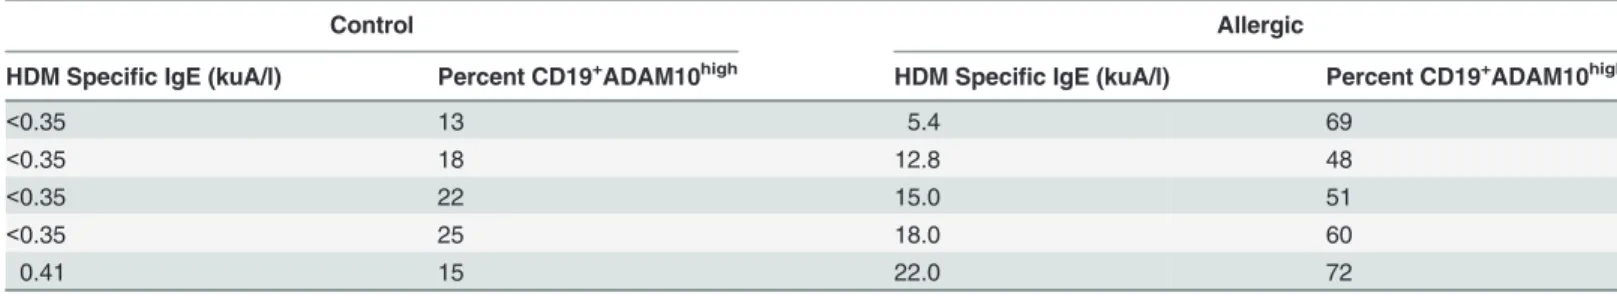
Table 1. Increased HDM specific IgE correlates with increased B cell ADAM10 expression.
Control Allergic
HDM Specific IgE (kuA/l) Percent CD19+ADAM10high HDM Specific IgE (kuA/l) Percent CD19+ADAM10high
<0.35 13 5.4 69
<0.35 18 12.8 48
<0.35 22 15.0 51
<0.35 25 18.0 60
0.41 15 22.0 72
Direct comparison of individual patient’s HDM specific IgE determined by ImmunoCAP and B cell ADAM10 expression determined byflow cytometry.
doi:10.1371/journal.pone.0124331.t001
compartmentalization (note the lack of B/T compartmentalization in the C57-ADAM10 B-/-compared to other groups) (Fig 4A), number and size of HEVs (Fig 4A), FDC reticular
devel-opment (note minimal CD21+FDC in C57-ADAM10B-/-) (Fig 4B, insetFig 4B), and collagen
deposition (note collagen is normally sparse but is increased in C57-ADAM10B-/-) (Fig 4B).
Furthermore, TNF labeling (boxed regions ofFig 4C) demonstrated that C57-ADAM10B-/-
fol-licles displayed the highest TNF intensity compared to C57-WT, WT, and
Balb-ADAM10B-/-(Fig 4C), with the latter groups all having comparable TNF staining (Fig 4C),
which is quantified inFig 4D. These results provide further support to the mechanism
underly-ing the aberrant lymphoid tissue architecture in C57-ADAM10B-/-mice and demonstrate the
inherent difference in B cell ADAM10 and ADAM17 regulation in Th1 vs. Th2 prone mice.
High B-ADAM10 level in the context of a Th2 environment allows optimal
induction of allergic airway disease symptoms
C57Bl/6 WT exhibit a decreased response to mouse lung inflammation models compared to Balb/c including airway bronchoconstriction and IgE production, however, these findings have never been linked to B-ADAM10 levels, specifically [8,20,21]. Our results thus far indicate that Th2 prone mice and humans, whose B cells are known to produce excess IgE, exhibit in-creased B cell ADAM10 even in a naïve, non-stimulated state. After stimulation with anti-CD40/IL4, B-ADAM10 levels increased more dramatically in Th2 prone strain B cells as well. Therefore, we next sought to compare the consequences of B cell ADAM10 level in the context of a Th1 or Th2 immune-environment on airway hypersensitivity induction following HDM challenge, specifically with regards to IgE production. The groups considered included: B cell ADAM10 high, Th2 prone (Balb/c WT); B cell ADAM10 low, Th1 prone (C57 WT); B cell
ADAM10 deleted, Th2 prone (Balb-ADAM10B-/-); and B cell ADAM10 deleted, Th1 prone
(C57-ADAM10B-/-). When each group was treated intranasally with saline, all disease
parame-ters were similar (not statistically different). For clarity, saline treated Balb WT was chosen as the representative saline group in Figs5and6.
Th2 prone, B-ADAM10 high Balb WT exhibit the most severe induction of lung inflamma-tion following HDM challenge, including increased bronchoconstricinflamma-tion (Fig 5A) and exten-sive peribronchiolar and perivascular inflammatory cellular infiltration in lung tissue (boxed
regions inFig 6A and 6C). Similarly, Balb WT exhibit the highest goblet cell metaplasia as
indi-cated by the intense pink staining mucin (arrows inFig 6B) and mucus (MUC5AC protein)
production (Fig 6D). Furthermore, the thickness of the alveolar epithelium (Fig 6B) is greatest
in the Balb/c compared to other groups with the C57-ADAM10B-/-being reflective of saline
controls. In accordance with our main hypothesis that increased B cell ADAM10 lends to in-creased IgE production, Balb WT exhibited the highest HDM-specific IgE (Fig 5C) as well. When ADAM10 is deleted from B cells but remains in the context of a Th2 environment in the
Balb-ADAM10B-/-, bronchoconstriction (Fig 5A), goblet cell hyperplasia (Fig 6B), and mucus
production (Fig 6D) are reduced significantly from Balb WT and are quite similar to the Th1 prone, B-ADAM10 low C57-WT. Furthermore, HDM-specific IgE (Fig 5C) is reduced from Balb WT levels demonstrating the critical importance of B cell ADAM10 for IgE production even in a Th2 prone environment. Lastly, B-ADAM10 deletion in the context of a Th1
environ-ment (C57-ADAM10B-/-) provides the least suitable context for allergic airway disease
induc-tion. Thus, as indicated previously, C57-ADAM10B-/-mice exhibited bronchoconstriction (Fig
5A), cellular infiltration of lung tissue (Fig 6A and 6C), goblet cell metaplasia (Fig 6B), and mucus production (Fig 6D) similar to saline control. While the HDM-specific IgE ELISA was not sensitive enough to detect differences between saline, C57-WT, and C57 and
production as both the Balb-ADAM10B-/-and C57-WT demonstrated significantly reduced HDM-specific IgE production compared to Balb WT (Fig 5C). Furthermore, B-ADAM10 dele-tion from Balb or C57 fails to reduce eosinophilic recruitment in BALF, but it appears to be a strain dependent phenomena as Balb/c mice regardless of B cell ADAM10 presence had
in-creased eosinophils compared to C57 WT and C57-ADAM10B-/-(Fig 5B).
Discussion
Compelling evidence, herein, demonstrates that B-ADAM10, ADAM17, and TNF are differen-tially regulated in Th1 and Th2-dominated immune responses and directly influence host sus-ceptibility to allergy and IgE production. We demonstrate that Th2 prone mouse strains (Fig 2)
and humans (Fig 1) exhibit increased B cell ADAM10 and IgE (Fig 1F,Table 1andFig 5C),
while concomitantly having reduced ADAM17 and TNF (Fig 3). With regards to mouse
strains, we compared to C57-ADAM10B-/-B cells to Balb-ADAM10B-/-and found that Th
en-vironment is critical for ADAM17 and TNF regulation as Balb-ADAM10B-/-are less adept at
increasing ADAM17 and thus TNF cleavage following ADAM10 deletion (Figs3and4) [8].
WT levels of TNF production by Balb-ADAM10B-/-B cells allows for maintenance of proper
secondary lymphoid tissue architecture and provided further evidence to the mechanism
un-derlying abnormal architecture characteristics in C57-ADAM10B-/-nodes (Fig 4) [8].
A critical question is whether B cell ADAM10 levels is strictly determined by T cell help or is an inherent characteristic of B cells from Th1 or Th2 prone strains. The answer is both. T
cell help as demonstrated byin vitroculture with equal concentrations of anti-CD40/IL4 shows
that B cell ADAM10 increases in both C57 and Balb WT B cells following stimulation (S1 TableandFig 2). Thus, T cell help augments ADAM10 expression. Importantly, however, Balb WT B cells exhibit increased ADAM10 in the naïve state and even more dramatically increased ADAM10 after anti-CD40/IL4 stimulation compared C57-WT B cells (S1 Table). This finding indicates an innate difference between their B cells that affects their sensitivity to T cell mediat-ed ADAM10 induction.
Next, regulation of ADAM17 and its ligand, TNF, in different Th contexts was analyzed. C57-WT B cells demonstrated increased ADAM17 in naïve B cells and increased TNF
expres-sion followingin vitrostimulation compared to Balb-WT B cells (Fig 2). These B cell
differ-ences in the classic Th1 and Th2-biased strains extended other strains of mice as well. For our studies, we used to SJL/J and C57Bl/6 as our Th1 prone strains and A/J and Balb/c as our Th2 prone strains (Fig 2). Furthermore, Th context is critical for understanding the difference in
ADAM17 and TNF regulation following B cell ADAM10 deletion as shown inFig 3, as
Balb-ADAM10B-/-B cells fail to increase ADAM17 and TNF production, thus permitting WT
archi-tecture maintenance (Fig 4). Our evidence suggests that regulation of B-ADAM10 and ADAM17 is both determined by Th context (e.g. T cell help) but also on inherent differences in B cell responsiveness.
In agreement with the clinically relevant HDM model used herein, OVA-induced airway
hypersensitivity was also reduced in C57-ADAM10B-/-[6]. In this study using a HDM model,
we directly compare C57 and Balb ADAM10B-/-mice and both experienced significantly less
bronchoconstriction, goblet cell metaplasia, mucus, and HDM-specific IgE production (in
Balb/c) compared to their respective WT strain (Figs5and6). Importantly, however,
Balb-ADAM10B-/-mice had lung inflammation parameters comparable to WT-C57 mice, while
C57-ADAM10B-/-had the lowest disease induction. Furthermore, while clinically relevant
fea-tures of human asthma including antigen-specific IgE, mucus, and airway resistance were clearly ADAM10 dependent, eosinophil infiltration was strain dependent only (Fig 5). This finding does not detract from the potential use of ADAM10 inhibitor therapy, however,
because blockade of eosinophil infiltration alone fails to reduce asthma related symptoms in most allergic patients [22,23]. Overall, the data indicates that B-ADAM10 plays an important role in this Th2 disease model with the highest ADAM10 expression indicating worst sympto-mology. While the mechanism by which ADAM10 levels influence Th2 disease is unknown, a candidate mechanism could be that ADAM10-mediated CD23 shedding increases IgE produc-tion, thus enhancing IgE cross-linking and mast cell degranulation [4]. If further validated in a larger human cohort study, ADAM10 level could serve as a potential indicator of the direction-ality or strength of a Th1 or Th2 response, with high ADAM10 level indicating a propensity to-ward enhanced Th2 responsiveness with excess IgE production.
Our data in mouse strains was validated by our findings in allergic patients (Th2 prone) who demonstrated increased B cell ADAM10 and reduced B cell ADAM17 and TNF produc-tion (Fig 1). Together this suggests that B cell-ADAM10 screening could effectively stratify al-lergic from non-alal-lergic patients potentially for their susceptibility to more severe disease. An appropriate, cost-effective means to perform this task is used herein: flow cytometric analysis of ADAM10 levels on peripheral blood CD19+ B cells obtained from a minimally invasive ve-nous puncture. Furthermore, while ADAM10 screening could be a critical diagnostic tool, ADAM10 inhibition therapy also stands to be the only mechanism by which to inhibit the ini-tial step in the allergic cascade: IgE production. We demonstrate, herein, that B cell ADAM10 deletion reduces antigen-specific IgE production (Fig 5C). Consequently, ADAM10 inhibitors have the potential to provide anti-allergic prophylaxis when locally administered particularly to atopic patients with high B-ADAM10.
Allergic patients with increased B-ADAM10 concomitantly had reduced B cell ADAM17 and TNF, which could also provide mechanistic insight into their enhanced IgE production. Increased B cell TNF production, as seen in aging B cells, limits antibody production, suggest-ing a potentially protective role of ADAM17 and TNF from induction of an allergic phenotype [24]. Our findings, overall, suggest that allergy-prone B cells display an ADAM10hi/
ADAM17lo/TNFlophenotype, with greater risk of atopic manifestations in Th2-biased
envi-ronments. Our results are an advance in elucidating the key role of ADAM10 in allergy patho-genesis, and provide a novel approach to the diagnosis, prognosis, and treatment of
atopic disorders.
Supporting Information
S1 Fig. Questionnaire for Allergic Study.
(PDF)
S2 Fig. HDM Lung Inflammation Model (from [14]).Mice were intranasally exposed to HDM extract as indicated and on day 15 analyzed for AHR, BALF cell distribution, and lung tissue was collected for sectioning.
(PDF)
S1 Table. ADAM10 expression in Naïve and Stimulated WT B cells by qPCR.A+I (3 days stimulation with anti-CD40+IL4); A (3 day stimulation with anti-CD40 alone). ADAM10 ex-pression normalized to 18s. Fold change in gene exex-pression of 2 or more between groups considered significant.
(PDF)
Acknowledgments
Author Contributions
Conceived and designed the experiments: LFC MEES DHC. Performed the experiments: LFC RKM HBZ. Analyzed the data: LFC RKM MEES DHC CUT. Contributed reagents/materials/ analysis tools: MEES DHC. Wrote the paper: LFC MEES DHC. Edited manuscript: LFC RKM HBZ AMI MEES DHC CUT.
References
1. Edwards DR, Handsley MM, Pennington CJ. The ADAM metalloproteinases. Mol Aspects Med 2008; 29: 258–289. doi:10.1016/j.mam.2008.08.001PMID:18762209
2. Le Gall SM, Bobe P, Reiss K, Horiuchi K, Niu XD, Lundell D, et al. ADAMs 10 and 17 represent differen-tially regulated components of a general shedding machinery for membrane proteins such as trans-forming growth factor alpha, L-selectin, and tumor necrosis factor alpha. Mol Biol Cell. 2009; 20: 1785–
1794. doi:10.1091/mbc.E08-11-1135PMID:19158376
3. Conrad DH, Ford JW, Sturgill JL, Gibb DR. CD23: an overlooked regulator of allergic disease. Curr Al-lergy Asthma Rep. 2007; 7: 331–337. PMID:17697638
4. Weskamp G, Ford JW, Sturgill J, Martin S, Docherty AJ, Swendeman S, et al. ADAM10 is a principal 'sheddase' of the low-affinity immunoglobulin E receptor CD23. Nat Immunol 2007; 7: 1293–1298. 5. Di LG, Drago A, Pellitteri ME, Candore G, Colombo A, Potestio M, et al. Serum levels of soluble CD23
in patients with asthma or rhinitis monosensitive to Parietaria. Its relation to total serum IgE levels and eosinophil cationic protein during and out of the pollen season. Allergy Asthma Proc. 1999; 20: 119–
125. PMID:10209690
6. Mathews JA, Ford J, Norton S, Kang D, Dellinger A, Gibb DR, et al. A potential new target for asthma therapy: a disintegrin and metalloprotease 10 (ADAM10) involvement in murine experimental asthma. Allergy. 2011; 66: 1193–1200. doi:10.1111/j.1398-9995.2011.02614.xPMID:21557750
7. Watanabe N, Kobayashi A. Regulation of immunoglobulin E production in mice immunized with an ex-tract of Toxoplasma gondii. Infect Immun. 1989; 57: 1405–1408. PMID:2523351
8. Folgosa L, Zellner HB, El Shikh ME, Conrad DH. Disturbed follicular architecture in B cell A disintegrin and metalloproteinase (ADAM)10 knockouts is mediated by compensatory increases in ADAM17 and TNF-alpha shedding. J Immunol 2013; 191: 5951–5958. doi:10.4049/jimmunol.1302042PMID: 24227779
9. Chaimowitz NS, Martin RK, Cichy J, Gibb DR, Patil P, Kang DJ, et al. A disintegrin and metalloprotei-nase 10 regulates antibody production and maintenance of lymphoid architecture. J Immunol. 2011; 187: 5114–5122. doi:10.4049/jimmunol.1102172PMID:21998451
10. Pasparakis M, Alexopoulou L, Episkopou V, Kollias G. Immune and inflammatory responses in TNF alpha-deficient mice: a critical requirement for TNF alpha in the formation of primary B cell follicles, fol-licular dendritic cell networks and germinal centers, and in the maturation of the humoral immune re-sponse. J Exp Med. 1996; 184: 1397–1411. PMID:8879212
11. Tumanov AV, Grivennikov SI, Kruglov AA, Shebzukhov YV, Koroleva EP, Piao Y, et al. Cellular source and molecular form of TNF specify its distinct functions in organization of secondary lymphoid organs. Blood. 2010; 116: 3456–3464. doi:10.1182/blood-2009-10-249177PMID:20634375
12. Gibb DR, El SM, Kang DJ, Rowe WJ, El SR, Cichy J, et al. ADAM10 is essential for Notch2-dependent marginal zone B cell development and CD23 cleavage in vivo. J Exp Med. 2010; 207: 623–635. doi: 10.1084/jem.20091990PMID:20156974
13. Kelly AE, Chen BH, Woodward EC, Conrad DH. Production of a chimeric form of CD23 that is oligomer-ic and blocks IgE binding to the Fc epsilonRI. J Immunol. 1998; 161: 6696–6704. PMID:9862699 14. Hirota JA, Budelsky A, Smith D, Lipsky B, Ellis R, Xiang YY, et al. The role of interleukin-4Ralpha in the
induction of glutamic acid decarboxylase in airway epithelium following acute house dust mite expo-sure. Clin Exp Allergy. 2010; 40: 820–830. doi:10.1111/j.1365-2222.2010.03458.xPMID:20337645 15. Norton SK, Wijesinghe DS, Dellinger A, Sturgill J, Zhou Z, Barbour S, et al. Epoxyeicosatrienoic acids are involved in the C(70) fullerene derivative-induced control of allergic asthma. J Allergy Clin Immunol. 2012; 130: 761–769. doi:10.1016/j.jaci.2012.04.023PMID:22664166
16. Kawakami M, Narumoto O, Matsuo Y, Horiguchi K, Horiguchi S, Yamashita N, et al. The role of CCR7 in allergic airway inflammation induced by house dust mite exposure. Cell Immunol. 2012; 275: 24–32. doi:10.1016/j.cellimm.2012.03.009PMID:22521241
17. van Rijt LS, Kuipers H, Vos N, Hijdra D, Hoogsteden HC, Lambrecht BN. A rapid flow cytometric meth-od for determining the cellular composition of bronchoalveolar lavage fluid cells in mouse mmeth-odels of asthma. J Immunol Methods. 2004; 288: 111–121. PMID:15183090
18. Dussault AA, Pouliot M. Rapid and simple comparison of messenger RNA levels using real-time PCR. Biol Proced Online. 2006; 8: 1–10. PMID:16446781
19. Johansson SG. ImmunoCAP Specific IgE test: an objective tool for research and routine allergy diagno-sis. Expert Rev Mol Diagn. 2004; 4: 273–279. PMID:15137895
20. Gueders MM, Paulissen G, Crahay C, Quesada-Calvo F, Hacha J, Van HC, et al. Mouse models of asthma: a comparison between C57BL/6 and BALB/c strains regarding bronchial responsiveness, in-flammation, and cytokine production. Inflamm Res. 2009; 58: 845–854. doi: 10.1007/s00011-009-0054-2PMID:19506803
21. Sahu N, Morales JL, Fowell D, August A. Modeling susceptibility versus resistance in allergic airway disease reveals regulation by Tec kinase Itk. PLoS One. 2005; 5: e11348.
22. Walsh GM. Reslizumab, a humanized anti-IL-5 mAb for the treatment of eosinophil-mediated inflamma-tory conditions. Curr Opin Mol Ther. 2009; 11: 329–336. PMID:19479666
23. Walsh GM. Mepolizumab and eosinophil-mediated disease. Curr Med Chem. 2009; 16: 4774–4778. PMID:19929788