2013, Vol. 9(1), p. 1-5.
1
Presenting and analyzing movie stimuli
for psychocinematic research
Arthur P. Shimamura University of California, Berkeley
Movies have an extraordinary way of capturing our perceptual, conceptual and emotional processes. As such, they offer a useful means of exploring psychological phenomenon in the laboratory. Until recently, it has been rather difficult to present animated stimuli and collect behavioral responses online. However, with advances in digital technology and commercially available software to construct, present, and analyze movies for behavioral investigations, there is a growing interest in psychocinematic research. A rather simple, yet useful procedure is described that presents movie clips and collects multiple behavioral responses during its presentation. It uses E-prime 2.0 Professional software to run the experiment and
Microsoft Excel to sort and analyze the data.
The use of movies as behavioral stimuli offers an interesting and informative means of assessing psychological processes as they unfold in time. Compared to typical psychological stimuli (e.g., words or pictures), movies offer a more engaging and dynamic experience. Some have investigated critical processes that are involved when we watch movies, including selective attention (Levin & Simons, 1997; Smith & Henderson, 2008), event segmentation (Cutting, DeLong, & Nothelfer, 2010; Zacks et al., 2007), schema knowledge (Schwann & Ildirar, 1010), and emotional regulation (Gross & Levenson, 1995). Moreover, there is interest in assessing the neural correlates of our movie experience (Hasson et al., 2008; Nishimoto et al., 2011). In fact, in the past several years we have witnessed a surge in what can be called psychocinematic research (see Shimamura, 2012).
A hindrance in the application of movies in behavioral studies has been the technical difficulty in displaying them
Correspondence concerning this article should be addressed to: Arthur P. Shimamura, Department of Psychology (MC1650), University of California, Berkeley, Berkeley, CA 94720-1650, email: aps@berkeley.edu. I thank Brendan Cohn-Sheehy for helpful comments and research assistance.
as experimenter-controlled stimuli and collecting responses during their presentation. With the advantage of digital processing, several commercially available programs can now present movies and collect online verbal, manual, and physiological (EEG, fMRI) responses. Among these products are E-prime 2.0 Professional (www.pstnet.com), Presentation (www.neurobs.com), and PsychoPy (www.psychopy.org). This paper outlines a straightforward method using E-prime 2.0 Professional (see Richard & Charbonneau, 2009) to present a movie file and collect keypress responses. Microsoft Excel is then used to sort and analyze the data.
Presenting Movie Stimuli
Most computer-controlled experiments present individual test trials in which a single response is obtained from a single stimulus. Included as a sample script with E-prime 2.0 Professional is a program called MovieRT.es2 (located in C:\My Documents\My Experiments\ Samples) which presents three movie clips (.mpg format) and obtains a a single keypress response for each clip. Any movie stimulus should first be tested using this program by
placing the movie clip (.mpg format) in the folder where the program is stored and editing the script by inserting its name in place of the filename of one of the existing clips. If the movie runs in this program, then it guarantees that the file and computer hardware (e.g., video card) are compatible with E-Prime 2.0 Professional. Moreover, if only one response is required for each movie stimulus, then this script can be easily modified for a variety of task demands.
For most psychocinematic studies, however, what is needed is a way to present a single, fairly long-playing movie clip during which multiple responses are collected. For example, in a study of “edit blindness,” individuals watched 5-min excerpts taken from Hollywood movies and were instructed to make a keypress whenever they saw a film edit (Smith and Henderson, 2008). In a related study, visual targets were inserted at various points in a movies, and participants made keypresses to the targets while they watched (Shimamura, Cohn-Sheehy, Shimamura, & Pogue, 2012). For that study, it was necessary to prepare the clips using a video editing program (PowerDirector 9.0, ) so that targets could be added to specific movie frames. With such editing programs it is also possible to locate exact time points at which responses are required (e.g. the onset times of targets). These time points are needed to sort and analyze response latencies.
To obtain multiple responses from a single movie clip, a sample program called MultipleResponseCollection.es can be modified. This program is available in the support section
on the E-Prime website ( ). It
demonstrates how to collect two manual responses (mouse or keyboard) from a single text stimulus. As it is an E-Prime
1.0 program, it must be converted to E-Prime 2.0 Professional format. We will rename the program MovieMultipleRT.es2 and modify it to present a single 2-min movie clip (MovieDemo.mpg) and collect up to 25 keyboard responses while it is playing (in Shimamura et al., 2012, a similar script ran a 5-min clip and collected up to 50 responses).! MovieDemo.mpg is an excerpt from a Hollywood movie (Dan in Real Life) in which a target (a blue asterisk) has been added to 19 movie frames distributed across the clip.
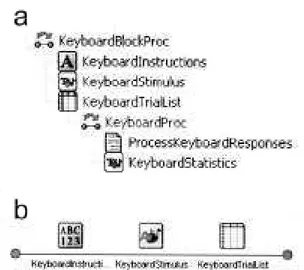
For movies to run properly, it is important that Version 2.0.8.90 (or later) of E-Prime 2.0 Professional is used and that the program is set to access the following three Devices: Display, Sound, and Keyboard (from the menubar: Edit>Experiment>Devices). The first part of the program includes a set of routines called SessionProc which selects the input mode (mouse or keyboard). Our experiment is geared specifically for keyboard responses, and thus only the set of KeyboardBlockProc routines will be modified (see Figure 1a). Access the KeyboardStatistics window using the graphic user interface [GUI] and delete the two feedback routines (i.e., delete the two text fields). Second, delete the KeyboardStimulus (which is the text stimulus) from the KeyboardBlockProc routines, and be sure to delete the same icon from the Unreferenced E-Objects section. Now add a new Slide icon to the KeyboardBlockProc routine in place of the original Text stimulus. On this slide add a MovieDisplay icon. To run properly, this slide must be given the same
2
" # Figure 1. a) Screen shot of the KeyboardBlokProc routine from an E-Prime 2.0 Professional program which has been modified for collecting multiple responses from a movie clip. The original KeyboardStimulus has been replaced with a Slide icon that contains a MovieDisplay stimulus. b) Sequence of subroutines in
name as the original text slide: KeyboardStimulus. The sequence for KeyboardBlockProc should now look like the screen shot in Figure 1b.
The movie clip must be set up with respect to its duration and the maximum number of possible responses. Select the MovieDisplay icon and access its properties (right-click on the icon). Select the Duration/Input tab and set the Duration of the movie (120000 msec for our 2-min clip) and for Device(s) add the Keyboard. The Time Limit should be marked same as duration and the End Action should be Terminate. Select the Advanced button and change the Max Count value to 25 (this value can be any number greater than the number responses desired). From the View menu select Properties then click on the MovieDisplay icon. Go to the Filename property and select the movie stimulus file. Indicate its Stop Position (i.e., duration of the clip). Other features of the movie stimulus may be modified, such as its background color, screen size, and position.
In sum, the original sample script, MultipleResponseCollection.es, was modified to collect multiple keypress responses during the presentation of a single movie stimulus. The specific modifications were: 1)
deleting the feedback routines, 2) deleting the Text stimulus, 3) inserting a new Slide, 4) adding a MovieDisplay to the Slide, 5) renaming the Slide to KeyboardStimulus, 6) identifying the movie filename, and 7) setting the maximum number of multiple responses to 25. For final preparation, the text display to subjects (KeyboardInstruction) should be edited according to task demands.
Analyzing the Data
one stimulus trial is presented (i.e., the movie clip) and multiple responses are requested. As a result, our data file is displayed as one long row that includes experimental identifiers, such as the movie clip name, session date, and subject number, followed by a string of keypress responses each paired with a response onset time (in msec), which indicates the time of the response with respect to the beginning of the movie. Keypress responses are named according to their ordinal position (e.g., KeyPress1Resp, KeyPress2Resp) as are response onset times (KeyPress1RT, KeyPress2RT).
It is possible to restructure the data set in Microsoft Excel so that it conforms to the typical format of one row per experimental condition. When the data is imported into Excel, the file includes a row of headers and a second row that begins with the experimental identifiers (displayed in columns A through T), followed by responses that are ordered alphabetically, thus starting with KeyPress10Resp and its associated latency, KeyPress10RT (columns U and V). Spacebar responses are identified as {SPACE}. To sort the data, an Excel worksheet is created in which the first three columns include information about the experimental design, which each row pertaining to a particular response. In the sample experiment there are 19 rows (i.e., responses) with the following information in the first three columns: A) Target number (1-19), B) Stimulus condition (1= pre-edit, 2= post-edit, 3= mid-edit targets), and C) Target onset time (in msec timed from the beginning of the movie) (see Figure 2). Column D is reserved for the Target RT, which is calculated from the E-Prime data. From the E-Prime data file, begin with the cell that includes KeyPress10Resp and copy the remaining data on that row and the row above (header row). With this Excel worksheet, it is possible to calculate reaction times to targets and sort them according to the experimental conditions. First, a target response will be defined as any response that occurs within 2000 msec after a target onset time. To search for target responses, the cells below every KeyPressRT contain a conditional formula that looks for a value that fits the definition of a target response and if one is detected calculates the target reaction time by subtracting the response onset time from the target onset time. For example, as shown in Figure 2, the response latency identified as KeyPress10RT is 66757 msec (Column F, Row 2). Each cell under that value contains a conditional formula such as the one shown in the figure, which is the equation in Column F, Row 12:
=IF(F$2>$C12,IF(F$2<$C12+2000,F$2-$C12,""),"") This equation first determines if the response onset time (F$2) is greater than a target onset time ($C12) and if so determines if the response onset time is less than the target
onset time plus 2000 msec. If both are true, then the cell displays the difference between the response time and target onset time (otherwise the cell is left blank). For the particular cell shown Figure 2 (Column F, Row 12), the response latency (66757) does occur after the target onset time for that row (66100) and is within 2000 msec of it. Thus, that cell displays the difference score (657). If the conditional formula is pasted in all cells under the data set, then every response time will be assessed as to whether it occurred within 2000 msec of a target onset time.
With these calculations, target reaction times are displayed in various columns in the matrix of conditional equations. These times can all be placed in Column D by summing across all values in a row and assuming that only one response was elicited within the 2000 msec response time window for each target (this assumption can be easily verified by visual inspection). With the list of target conditions (Column B) and corresponding reaction times (Column D), mean latencies for each condition can be derived simply by sorting the two columns. An efficient way to do so is to use the Excel PivotTable routine.$
The Possibilities
Movie stimuli can be used for a variety of experimental purposes. The present sample experiment assessed the influence of film edits on target detection, and is just one of many possible investigations that uses multiple response measures to assess our experience with movies. In addition to the analysis of perceptual features, movie stimuli can be used to assess the way visual narratives drive conceptual and emotional processes. For example, while watching movies, online responses could be collected with respect to plot features or emotional engagement (e.g., arousal ratings). As mentioned above, a surge of interest in the psychological (and biological) underpinnings of our movie experience has occurred in recent years (see Shimamura, 2012). The methods described here offer a simple, straightforward procedure for developing a research program in psychocinematics.
More importantly, moving pictures display events in a more naturalistic manner than the kind of static stimuli typically used in behavioral research. Thus, the application of movies as stimuli can be broadened to many domains in psychological science as it offers a means of studying mental processes as they unfold in time. Recently, movies have been used in fMRI studies to assess the dynamics of perceptual processes in real time (Nishimoto et al., 2010). At a more
conceptual level, Zacks et al. (2007) described the manner in which individuals segment actions into event units. The methods provided here can be used for the acquisition of multiple responses during a movie clip, such that data can be collected while actions are being displayed. In the domain of affective processing, it is now quite evident that emotional reactions are highly dynamic and engrossing. For example, Marian and Shimamura (in press) presented short movie clips of changing facial expressions, such as an expression moving from neutral to happy. When the clip was run in reverse, from happy to neutral, the neutral expression was actually rated as somewhat negative. When the same neutral expression began as angry, it was rated as somewhat positive. In that study, a single response was collected after each brief clip. Such contextual factors could be assessed in a more dynamic manner using longer clips (e.g., of two individuals conversing) and collecting multiple online responses of emotional valence. Indeed, the power of moving pictures in driving perceptual, conceptual, and emotional processes makes obvious the limitations of relying solely on static stimuli for psychological research. The methods presented here offer a simple means of applying movie stimuli for a variety of uses in behavioral research.
References
Cutting, J. E., DeLong, J. E., & Nothelfer, C. E. (2010). Attention and the evolution of Hollywood film. Psychological Science, 21, 440-447.
Gross, J. J., & Levenson, R. W. (1995). Emotion elicitation using films. Cognition and Emotion, 9, 87-108.
Hasson, U., Landesman, O., Knappmeyer, B., Vallines, I., Rubin, N., & Heeger, D. J. (2008). Neurocinematics: The neuroscience of film. Projections, 2, 1-26.
Levin, D.T., & Simons, D.J. (1997). Failure to detect changes to attended objects in motion pictures. Psychonomic Bulletin and Review, 4, 501-506.
Marian, D. E., & Shimamura, A. P. (in press). Context effects following dynamic facial expressions. American Journal of Psychology.
Nishimoto, S., Vu, A. T., Naselaris,T., Benjamini, Y., Yu, B., Gallant, J. L. (2011). Reconstructing visual experiences from brain activity evoked by natural movies. Current Biology, 21, 1641-1646.
Richard, L. & Charbonneau, D. (2009). An introduction to E-Prime. Tutorials in Quantitative Methods for Psychology, 5, 68-76.
Schwan, S., & Ildirar, S. (2010). Watching film for the first time: How adult viewers interpret perceptual discontinuities in film. Psychological Science, 21, 1-7. Shimamura, A. P. (2012) (Editor). Psychocinematics: The
Aesthetic Science of Movies. New York: Oxford University Press, in preparation.
Shimamura, A. P., Cohn-Sheehy, B., Shimamura, T. A., & Pogue, B. (2012). Detecting targets embedded in movies: Evidence for change blindness across edits, manuscript submitted.
Smith, T. J., & Henderson, J. M. (2008). Edit blindness: The relationship between attention and global change blindness in dynamic scenes. Journal of Eye Movement Research, 2, 1-17.
Zacks J. M., Speer N. K., Swallow K. M., Braver T. S., and Reynolds J. R. (2007). Event perception: A mind/brain perspective. Psychological Bulletin, 133, 273–93.