Battery Model Parameters Estimation Using Simulated Annealing*
M.F. BRONDANI**, A.T.Z.R. SAUSEN, P.S. SAUSEN and M.O. BINELO
Received on November 20, 2016 / Accepted on March 13, 2017
ABSTRACT. In this paper, a Simulated Annealing (SA) algorithm is proposed for the Battery model parametrization, which is used for the mathematical modeling of the Lithium Ion Polymer (LiPo) batteries lifetime. Experimental data obtained by a testbed were used for model parametrization and validation. The proposed SA algorithm is compared to the traditional parametrization methodology that consists in the vi-sual analysis of discharge curves, and from the results obtained, it is possible to see the model efficacy in batteries lifetime prediction, and the proposed SA algorithm efficiency in the parameters estimation.
Keywords:Battery model, parameter estimation, simulated annealing.
1 INTRODUCTION
The development of new technologies for mobile devices is highly dependent on developments in battery lifetime prediction and management. The battery lifetime is here understood as the time during which the battery can supply energy to the device before a new recharge [17]. There are different classes of mathematical models [4, 6, 10, 15, 17, 18] capable of battery lifetime pre-diction, and among those classes, there is the electrical models class [3, 4, 22]. A considerably versatile electrical model is the so called Battery model [9, 21, 22], and a crucial aspect of its application is the parametrization process. Different approaches can be adopted for the parame-ters estimation, being the subjective visual analysis of discharge curves the traditionally applied method [2, 16] for some of the Battery model parameters.
Some works have proposed the use of more systematic estimation processes with metaheuris-tics, obtaining good results for various parameter estimation problems [1, 5, 7, 20]. Among the most used metaheuristics, the Simulated Annealing (SA) is notable for its efficacy and robust-ness. This method, proposed by [11], is inspired by the procedure presented in [13] and is based on the analogy between annealing of solids and the resolution of combinatorial optimization problems [7]. An important characteristic of this method is the possibility of solutions worst
*Work presented at XXXVI Congresso Nacional de Matem´atica Aplicada e Computacional (CNMAC). **Corresponding author: Marcia de Fatima Brondani – E-mail: [email protected]
UNIJU´I – DCEEng/Programa de P´os-Graduac¸˜ao Stricto-Sensu em Modelagem Matem´atica, Rua Lulu Ilgenfritz, 480, 98700-000 Iju´ı, RS, Brasil.
then the current solution to be selected for the next iteration, and by doing so, exploring other solutions in the neighborhood, escaping from local minima. This selection probability is driven by the temperature simulation variable, which decreases with time, bringing stability to the method as the search progresses.
The SA method has been used to optimize parameters in a variety of problems. The opera-tional parameters optimization for fuel economy and lower emission of a Hybrid Electric Vehicle (HEV) is discussed in [23], where a SA algorithm is proposed and its results are compared with the method usually employed for the problem, called dividing rectangles (DIRECT). In [14], a SA method is used for the parameters estimation of an electrical equivalent circuit model of the Proton Exchange Membrane (PEM) fuel cell system. The model is validated by the comparison of experimental and simulated data, with good results agreement. A SA algorithm is used in [8] for the size optimization of a photovoltaic and wind hybrid energy system with battery storage. The parameters for photovoltaic panel size, wind turbine rotor swept area and battery capacity are optimized for the minimization the energy system total cost. The results obtained by the SA algorithm is compared to the Response Surface Methodology (RSM), with SA showing better results. The estimation of solar cell model parameters is solved by a SA algorithm in [7], and a comparative study of different parameter estimation techniques is presented to demonstrate the effectiveness of the proposed SA. In [5], a SA is employed to efficiently find the best control coefficients for the nonlinear problem of energy management for a hybrid vehicle. With the use of SA, it was possible to find the motor power and maximum current coefficient with faster cal-culation time, improving the vehicle energy efficiency when compared to the Charge-Depleting (CD)/Charge-Sustaining (CS) standard method.
This paper presents the application of the SA method in the parametrization of the Battery model used for the mathematical modeling of Lithium Ion Polymer (LiPo) batteries. The pro-posed SA algorithm and the Battery model are both implemented using the Matlab computational tool. For the parametrization validation, two different methodologies are applied and compared. The first methodology consists in the model parametrization by discharge curves visual analysis, which is the traditionally applied method for this problem [2, 16]. The second methodology is the model parametrization by the SA algorithm proposed in this paper. The discharge curves used in both parametrization approaches were obtained using a testbed specially built for this task. The results obtained by the Battery model are compared to the experimental data in order to evaluate the parametrization procedures.
2 MATERIALS AND METHODS
This section presents the electrical model used for battery lifetime prediction, the methodo-logy used for the experimental data obtainment and model parametrization procedure. The first parametrization methodology is based on the subjective visual analysis of discharge curves, and second methodology is the proposed SA algorithm.
2.1 Battery Model
The Battery model is a dynamic model that simulates the behaviour of rechargeable batteries of different technologies under different charge and discharge conditions [9]. The following as-sumptions are considered for the model [21]: the internal resistance of the battery is constant, not varying with the current amplitude; the effective capacity of the battery does not change along with changes in the current amplitude; the temperature is neglected, not affecting the model be-haviour; self-discharging of the battery is not considered; and the model has no memory effect.
The Battery model is part of the SimPowerSystems library, in the Matlab/ Simulink compu-tational tool. For each battery type there is a specific equation to describe the voltage decay. Therefore, for LiPo battery, the simulated voltageVsis obtained by the equation
Vs =E0−Ri−K
Q
Q−it
i∗−K
Q
Q−it
it +Aex p(−Bit) , (1)
where: E0 is the constant voltage, R is the internal resistance, i is the battery current, K is the polarization constant or the polarization resistance,i∗ is the filtered current,it is the actual battery charge,Qis the battery maximum capacity,Ais the exponential zone amplitude andBis the inverse of the exponential zone time constant [22]. The constant voltageE0is obtained from the equation
E0=VF ull +K+Ri−A, (2)
where:VF ull is the fully charged voltage [21]. The polarization constantK is given by
K =(VF ull −VN om+A(ex p(−B QN om)−1))(Q−QN om)
QN om
, (3)
where:VN omis the voltage at the end of the nominal zone andQN om is the capacity at nominal
voltage [21]. The parameters AandB can be obtained from the equations (4) and (5), respec-tively,
A=VF ull −VE x p, (4)
B= 3
QE x p
, (5)
where:VE x pis the voltage at the end of the exponential zone andQE x pis the capacity at the end
of the exponential zone [21].
The parameterVN om directly depends on the parameter QN om. The parameters that need to be
estimated using discharge characteristic curves, as proposed by [9], are: QN om,VE x pandQE x p.
The methodology usually adopted for these parameters estimation is based on the visual analysis of some specific points in the discharge curves [16]. This paper proposes a new methodology for the parameters estimation, based on SA method, and compares it to the visual analysis method.
2.2 Experimental Data
For the parametrization process and model validation, this study uses actual discharge curves generated using data from a testbed developed by the Industrial Automation and Control Group (GAIC), of the Regional University of Northwest of Rio Grande do Sul State (Uniju´ı). This platform captures the curves of the battery discharge process, obtaining instant information that can be saved as images in bitmap and reports in text format.
For the experimental tests, the batteries are initially connected to an external power source and subjected to a full charge process with a applied current corresponding to 20% of the battery rated capacity [12], which is equivalent to 160m A. The charge process is considered complete when battery voltage reaches 4.2V, than the batteries are disconnected from the charging station and subsequently connected to the testbed for the discharge process. The discharge process is considered complete when the battery reaches the cutoff voltage of 2.7V. The battery lifetime is the discharge time from the battery fully charged down to the cutoff voltage.
A wide range of discharge currents were used for the experimental tests in accordance to the minimum and maximum acceptable limits for the LiPo battery model P L383562−2C. A total of 31 constant discharge profiles were used, ranging from 50m Ato 800m A, at 25m Aintervals, and 8 independent experimental tests are performed for each discharge profile.
2.3 Parameters estimation methodologies
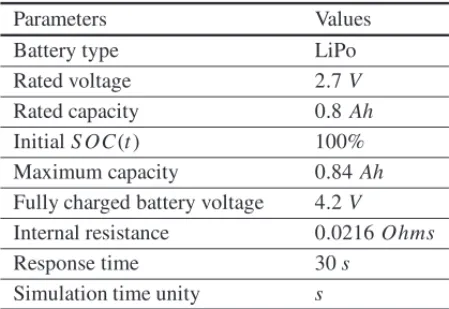
The Battery model parameters can be divided in two sets. The first parameters set does not depend on the calibration discharge current and is show in Table 1. The value of the internal resistance parameter is derived from rated voltage and rated capacity parameters, corresponding to 1% of these two parameters product. The value of the maximum capacity parameter is 105% of the battery rated capacity. The initial state of chargeS OC(t), at the beginning of the discharge process when battery is fully charged, is set to 100%. The response time parameter is set to 30
s, a value that satisfactorily represents the battery voltage dynamics. The parameters values are chosen according what is advised in [9].
The second set of parameters is estimated using discharge curves that describe the voltage decay over time and are generated by the experimental data provided by the testbed. Two dis-tinct regions in a discharge characteristic curve must be considered: exponential area and nomi-nal area. The parametersVE x p andQex pare obtained from the curve analysis at the end of the
exponential area. The parameter QN om is obtained from the curve analysis at the end of the
Table 1: Battery model parameters.
Parameters Values
Battery type LiPo
Rated voltage 2.7V
Rated capacity 0.8Ah
InitialS OC(t) 100%
Maximum capacity 0.84Ah
Fully charged battery voltage 4.2V
Internal resistance 0.0216Ohms
Response time 30s
Simulation time unity s
Two different methodologies are used for the estimation of the parameters QN om, VE x p and
QE x p. Methodology 1 consists in the visual analysis of the discharge curve where the
corres-ponding experimental lifetime is found to be nearest to the average experimental lifetime of the 8 independent experiments for the considered calibration profile. Methodology 2 is the use of the SA method proposed by this paper. It is important to note that, for the two adopted methodologies, the parameters estimation the Battery model is performed for a given calibration discharge profile and then validated for all other discharge profiles. The two methodologies are better explained in the following subsections.
2.4 Methodology 1: Visual analysis of discharge curve
In this methodology, 8 discharge curves are generated, according to 8 independent experiments performed for the considered discharge profile. The lifetime of each experimental discharge curve is computed, the average experimental lifetime of the discharge profile is obtained, and the curve with the lifetime nearest to the average experimental lifetime is then selected. Using the selected curve, the 3 parameters of the Battery model are obtained by means of a visual analysis at specific points, following the same procedure found in [16]. The model is then sim-ulated for the 31 discharge profiles for its validation. This whole procedure is repeated for each discharge profile.
2.5 Methodology 2: Simulated Annealing
experimental lifetime nearest to the calibration profile average lifetime is selected and used to compute the objective function
E= fc Lea
0
|Vs−Ve|dt
+ fL(|Ls−Lea|), (6)
where: fcis the discharge curve importance factor,Leais the average experimental lifetime,Vs
is the voltage simulated by the model according to equation (1),Veis the experimental voltage,
fL is the average experimental lifetime importance factor and Ls is the lifetime simulated by
the model. The Ls is obtained by computing the simulated time interval from the battery fully
charged down to the cutoff voltage. The fc and fL factors are constants used to define whether
the model should look for a better fit to overall curve, or a better fit for the average experimental lifetime, since the model does not always achieve these two objectives simultaneously, espe-cially due to the sudden drops in voltage at the beginning and end of the experimental curve. This factors were empirically determined, and values used were fc=0.175 and fL =1.
The SA algorithm proposed to solve this optimization problem can be summarized by the fol-lowing steps:
• An initial random solution for the parameters is generated.
• The initial temperature of the method is set.
• For each method iteration:
– For each solution perturbation:
∗ A new random candidate solution is generated in the vicinity of the current so-lution, according to the method temperature.
∗ The Battery model is parametrized with the new candidate solution.
∗ The Battery model is simulated for the calibration discharge profile.
∗ The objective function is computed.
∗ If the objective function is smaller than the result of the current solution, or the new solution passes in the Metropolis criterion [13]:
- The new candidate solution is now the current solution.
– The method temperature in decreased.
– The stop criterion is verified.
• The best solution found by the method is returned.
3 RESULTS AND DISCUSSIONS
This section presents the simulation results of the Battery model considering 31 calibration pro-files. For each calibration profile, the model was simulated for all 31 discharge profiles in order to evaluate the calibration efficacy. The results show the differences between the simulated battery lifetimes and the average experimental battery lifetimes. The discharge profiles have constant currents with values ranging from 50m Ato 800m Aat 25m Aintervals. Also, the average er-ror of each calibration is computed using the results of all 31 discharge profiles. The results are presented and discussed according to the methodology used for the model parametrization.
3.1 Simulation results for Methodology 1
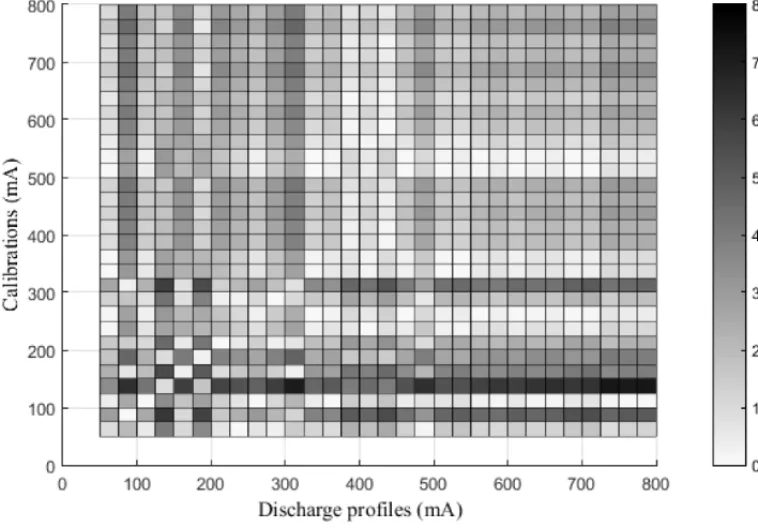
The errors obtained by the model calibrated by this methodology, in which the parameters are obtained from the visual analysis of the discharge curves, are shown in Figure 1, where the lighter gray corresponds to the lowest error and the darker gray to the highest error rates. It is possible to note by darker gray regions in the figure that lower current calibration profiles present higher error rates. This is expected for the Battery model since the nonlinear effects are more present at lower current discharges profiles. The most satisfactory results are observed in calibration with rated current of 525m A, with average error equals to 0.845%. The calibration that has the highest average error is the 125m Aprofile with an error rate of 5.425%.
Considering this parametrization methodology, the Battery model presents a total average error of 2.057%.
3.2 Simulation results for Methodology 2
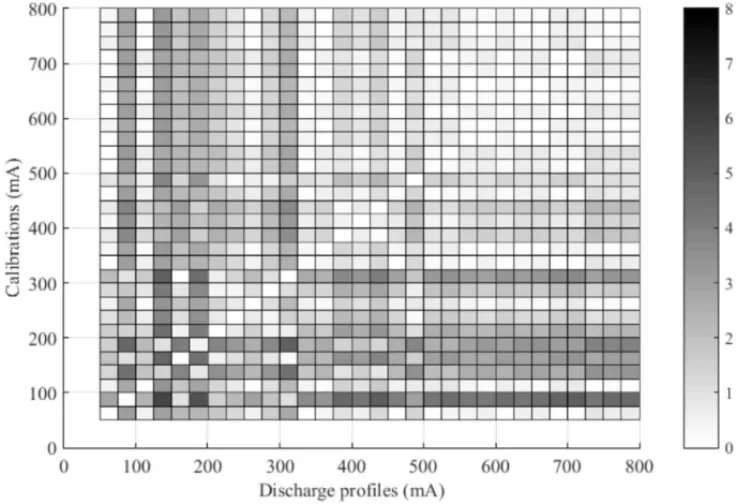
The results of the Battery model parametrized by Methodology 2, the proposed SA algorithm, are presented in Figure 2, where the lighter gray corresponds to the lowest error rates and the darker gray to the highest error rates. The calibration profiles with lowest average error rates are 350m A and 650m A profiles, both with a 0.821% error rate. The calibration that has the highest average error is the 75m A profile with a 3.675% error rate. The same trend of higher error rates for lower current calibration profiles seen in Methodology 1 can also be note here, but much more lighter areas and considerably less darker areas can be seen in Figure 2, showing the overall better performance of the SA algorithm. The total average error rate of the Battery model parametrized by the SA algorithm is of 1.352%, considerably lower than the Methodology 1 result of 2.057%.
Figure 2: Error (%) of Battery model parametrized with Methodology 2.
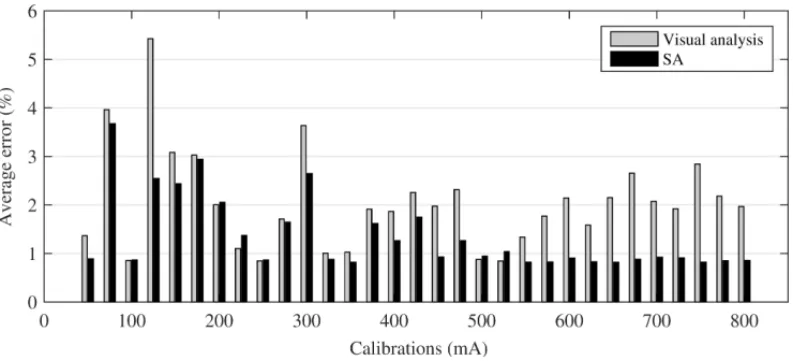
The average errors for each calibration profile for Methodologies 1 e 2 are presented in Figure 3. The better performance of the SA algorithm is evident, since it achieved lower error rates for most calibration profiles, with most of its rates under the 1% mark.
Figure 3: Average error (%) of calibration profiles.
to the 350m Acalibration profile, and then applied to a 500m Abattery discharge. The average experimental lifetime is 90.58 min and the simulated time is 90.15 min. For this particular case, the model presents an error of 0.47%. It is noteworthy that the major discrepancies occur at the beginning and end of the discharge process. It happens mainly due to the capacity rate effect [19], an important nonlinear effect that is not captured by the Battery model.
Figure 4: Experimental and simulated curves for the 500m Adischarge profile.
4 CONCLUSIONS
extremely important for its accuracy, and the main contribution of this work is the proposition of a SA method for the optimization of three key parameters,VE x p,QE x pandQN om. These
para-meters are usually estimated by the visual analysis of discharge curves, but in contrast, proposed SA method proved to be a less subjective and more systematic approach. In this paper, expe-rimental data obtained by a testbed was used to validate the Battery model, obtaining a total average error rate of 2.057% when parametrized by the visual analysis method, and a total aver-age error rate of 1.352% when parametrized by the proposed SA algorithm.
RESUMO. Neste trabalho ´e proposto um algoritmo deSimulated Annealing(SA) para a parametrizac¸˜ao do modeloBattery, utilizado para a modelagem matem´atica do tempo de vida
de baterias de L´ıtio ´Ion Pol´ımero (LiPo). Dados experimentais obtidos em uma plataforma de
testes s˜ao utilizados para a parametrizac¸˜ao e a validac¸˜ao do modelo. O algoritmo SA proposto ´e comparado `a metodologia usual de parametrizac¸˜ao, que consiste na an´alise visual de curvas
de descarga, e a partir dos resultados obtidos, ´e poss´ıvel verificar tanto a efic´acia do modelo
em predizer o tempo de vida das baterias estudadas, quanto a eficiˆencia do algoritmo SA proposto para a estimac¸˜ao de seus parˆametros.
Palavras-chave:modelo Battery, estimac¸˜ao de parˆametros, simulated annealing.
REFERENCES
[1] J. Brand, Z. Zhang & R.K. Agarwal. Extraction of battery parameters of the equivalent circuit model using a multi-objective genetic algorithm, inJournal of Power Sources,247(2014), 729–737.
[2] M.F. Brondani, A. Sausen, P.S. Sausen & M.O. Binelo. Modelagem Matem´atica do Tempo de Vida de Baterias de L´ıtio ´Ion Pol´ımero, inProceeding Series of the Brazilian Society of Computational and Applied Mathematics,4(1) (2016).
[3] M. Ceylan, T. Sarikurt & A. Balikci. A novel Lithium-Ion-Polymer battery model for hybrid/electric vehicles, in 2014 IEEE 23rd International Symposium on Industrial Electronics (ISIE), (2014), 366–369.
[4] M. Chen & G. Rinc ´on-Mora. Accurate electrical battery model capable of predicting runtime and I-V performance, inIEEE Transactions on Energy Conversion,21(2) (2006), 504–511.
[5] Z. Chen, C. Chris Mi, B. Xia & C. You. Energy management of power-split plug-in hybrid electric vehicles based on simulated annealing and Pontryagin’s minimum principle, inJournal of Power Sources,272(2014), 160–168.
[6] M. Doyle, T.F. Fuller & J.S. Newman. Modeling of galvanostatic charge and discharge of the lithium/polymer/insertion cell, inJournal of The Electrochemical Society,140(1993), 1526–1533.
[7] K.M. El-Naggar, M.R. AlRashidi, M.F. AlHajri & A.K. Al-Othman. Simulated Annealing algorithm for photovoltaic parameters identification, inSolar Energy,86(1) (2012), 266–274.
[9] MATHWORKS. Implement generic battery model. Available at: http://www.mathworks.com/help/ physmod/sps/powersys/ref/battery.html. Access in: 8 nov. 2015.
[10] T. Kim & W. Qiao. A hybrid battery model capable of capturing dynamic circuit characteristics an nonlinear capacity effects, inIEEE Wireless Communications and Networking Conference,26(2011), 1172–1180.
[11] S. Kirkpatrick, C.D. Gelatt & M.P. Vecchi. Optimization by simulated annealing, in Science,
220(4598) (1983), 671–680.
[12] D. Linden & T.B. Reddy, “Handbook of Batteries”, McGraw-Hill Handbooks, New York (1995).
[13] N. Metropolis, A.W. Rosenbluth, M.N. Rosenbluth, A.H. Teller & E. Teller. Equation of State Calcu-lations by Fast Computing Machines, inJournal of Chemical Physics,21, (1953), 1087–1092.
[14] M.T. Outeiro, R. Chibante, A.S. Carvalho & A.T. de Almeida. A parameter optimized model of a Proton Exchange Membrane fuel cell including temperature effects, inJournal of Power Sources,
185(2) (2008), 952–960.
[15] T.D. Panigrahi, D. Panigrahi, C. Chiasserini, S. Dey, R. Rao, A. Raghunathan & K. Lahiri. Battery life estimation of mobile embedded systems, in “Fourteenth International Conference on VLSI Design”, (2001), 57–63.
[16] C.M.D. Porciuncula, A.T.Z.R. Sausen & P.S. Sausen. Mathematical Modeling for Predicting Battery Lifetime through Electrical Models, inAdvances in Mathematics Research, (2015), 343–360.
[17] D. Rakhmatov & S. Vrudhula. An analytical high-level battery model for use in energy management of portable electronic systems, inNational Science Foundation’s State/Industry/University Coopera-tive Research Centers (NSFS/IUCRC) Center for Low Power Electronics (CLPE), (2001), 1–6.
[18] V. Ramadesigan, P.W.C. Northrop, S. De, S. Santhanagopalan, R.D. Braatz & V.R. Subramanian. Modeling and Simulation of Lithium-Ion Batteries from a Systems Engineering Perspective, in
Journal of The Electrochemical Society,159(2012), 31–45.
[19] K.K. Schneider, P.S. Sausen & A. Sausen. An´alise comparativa do tempo de vida de baterias em dispositivos m´oveis a partir da utilizac¸˜ao de modelos anal´ıticos,TEMA – Tend. Mat. Apl. Comput.,
12(1) (2011), 43–54.
[20] K. Thirugnanam, J.T.P. Ezhil Reena, M. Singh & P. Kumar. Mathematical Modeling of Li-Ion Battery Using Genetic Algorithm Approach for V2G Applications, inIEEE Transactions on Energy Conversion,29(2) (2014), 332–343.
[21] O. Tremblay, L.-A. Dessaint, A.-I. Dekkiche. A Generic Battery Model for the Dynamic Simulation of Hybrid Electric Vehicles, in “Vehicle Power and Propulsion Conference, VPPC 2007”, IEEE, (2007), 284–289.
[22] O. Tremblay & L-A. Dessaint, Experimental Validation of a Battery Dynamic Model for EV Appli-cations, inWorld Electric Vehicle Journal, (2009), 289–298.
[23] Z. Wang, B. Huang, Y. Xu & W. Li. Optimization of Series Hybrid Electric Vehicle Operational Parameters By Simulated Annealing Algorithm, in “2007 IEEE International Conference on Control