c
Uma Publicação da Sociedade Brasileira de Matemática Aplicada e Computacional.
Triplet Entropy in H1N1 Virus
1
L. dos SANTOS2
, LAC, Instituto Nacional de Pesquisas Espaciais, 12227-010 São José dos Campos, SP, Brasil.
J.L. RYBARCZYK FILHO3
, Instituto de Física, UFRGS, 91509-900 Porto Alegre, RS, Brasil.
G.J.L. GERHARDT4
, CCET - Universidade de Caxias do Sul, 95001-970 Caxias do Sul, RS, Brazil.
Abstract. In this work we analyze triplet entropy in a set of H1N1 virus sequences. We correlated measures of entropy and guanine and cytosine concentration with chronology sample for a set of more than 30,000 sequences. This description al-lowed us to draw a map of the virus organizational changes throughout the20th century. The main conclusion of our analysis was to show that some virus seg-ments are mutating with a higher rate than others over the years and, in some cases, they are clustering sequences into new subgroups. A higher changing rate was found precisely in PA and PB1 segments, which are parts of H1N1 replication machinery. This highlights that organizational measures, as presented here, par-tially reflect segment dynamics and corroborates some recent experimental findings, which showed that during the last virus outbreak there has been a major change in polymerase activity. This type of approach may help to optimize treatment targets for this disease.
Key-words. H1N1, Entropy, DNA.
1.
Introduction
Probably the flu is one of the greatest villains of the twentieth century. Either asso-ciated with the large outbreak in the beginning of the century (1918), or assoasso-ciated with the last outbreak in 2009, the H1N1 virus can be considered as one of the most striking natural selection pressures to the human race [7]. Any effort to further un-derstand this virus would be welcome, and this can be quantified by just inspecting the huge quantity of data that has become available in GenBank [1] (increasing each day) about H1N1, fostering research studies. The use of computational tools in se-quence analysis gained strength together with the volume of sese-quences deposited in GenBank. The study of these sequences, from an organizational point of view, is
1
Thanks to CAPES and CNPq Brazilian agency for funding. 2
not new [14, 12] but has always represented a promising opportunity to understand how information is encoded in DNA. Statistical tools that measures information in sequences are applied mainly in an effort to draw phylogenetic trees, having some degree of success, although not being considered as a consensus in the literature [9, 13, 6]. This approach aims to find what is called genome signatures in DNA. These signatures are patterns in genomic sequences that differ from randomness and are not predicted merely by variations in Guanine-Cytosine (GC) content [13]. Now we have access not only to new data, but also to historical sequences, thereby gaining the possibility of understanding the fundamental mechanisms of this pandemy over time in ways never conceived before. However, H1N1 is a challenge by itself. Looking carefully into the volume of data that laboratories made public on H1N1, it is reasonable to hypothesize that organizational measures derived from signal analysis theory, when applied to DNA sequences, can reflect the biochemical patterns generated by the sequences. This is of the utmost interest in genetics [10]. Sequence organizationis meant here as any kind of order which deviates from random assemblage of amino acids (aa) or nucleotides.
The way literature divides H1N1 genome segments has somewhat evolved in recent times, with a better understanding of its features. H1N1 genome is usually divided into 8 segments, but there are some alternative reading frames for some segments, so we will divide the genome into 11 segments following GenBank, with NA (neuraminidase) and HA (hemagglutinin) considered as external parts of the virus: NA is involved in budding of new virions from infected cells, and HA is re-sponsible for binding to sialic-acid receptors and entry into host-cells. The M1 and M2 (matrix protein) segments are responsible for encoding a principal component of the viral capsid and also function as ion channel; NS1 and NS2 (non-structural protein), NS1 affects cellular RNA transport [5], whereas NS2 is the smallest com-ponent of the virus and its function still is unknown [3]. The PA (acidic protein) segment which might possess a transcriptase protease activity. There are also three segments that produce the virus polymerase complex: PB1 (basic polymerase 1) is responsible to catalysis of the nucleotide addition and encode other a small proapop-totic mitochondrial - PB1-F2 and PB2 (basic polymerase 2) is responsible to control the recognition of host-cell RNA [7, 3, 4, 15]. Changes in base composition imply changes in the behaviour of the virus.
Amino acids have a code that is said to be degenerated. This is because from 64 possible combinations of nucleotides we can only form 20 aa, having to repeat them. A good adaptative capacity correlates to a wide range of combinatorial possibilities inside a sequence, which end up being one of the pillars of mutation in a genome [5, 14, 12]. A way to quantify the organization of the nucleotide composition is achieved by means of entropy. Using Shannon’s information theory, one can define
entropy for a segment as a measure that takes into account the organization of triplets, indicating how close to thermodynamic disorder (maximum entropy) a genome sequence is. What can be inferred from these measures is that a sequence with greater entropy may also be more prone to changeability.
The entropy we will define here in the rest of this paper is anormalized entropy, which takes into account the amount of GC present in the segment of DNA. It may be regarded as an independent measure of GC or AT (Adenine and Thymine content) skewness. Our main objective will be to evaluate a measure of sequence entropy (triplet entropy) for sequences of H1N1 virus, taken from the GenBank, and study time evolution. As will become clear in the sequence of the work, this procedure shows how some segments tend to change over time while others remain virtually unchanged.
2.
Methods
2.1.
Triplet Entropy
Triplet prevalence entropy is defined following the classical Shannon entropy defi-nition as
S=−
64
X
n=1
PnlogPn, (2.1)
wherePn is the probability ofnthtriplet in a given sequence of size
W. In our case
W is the size of sequence. If window size W is not a multiple of three, we use a periodic contour condition.
Equation (2.1) in this form is naturally biased by the GC content itself. So we can define a normalized entropy as
Sn =S−SGC(rand), (2.2)
2.2.
Sequences and Procedure
The sequences used in this work were obtained from GenBank in June 2010. A total of 32194 sequences were obtained, comprising HA(4177), M1(3315), M2(3190), MA(4414), MP(2807), NS1(2768), NS2(2662), PA(2652), PB-F2(851), PB1(2759) and PB2(2599). All these sequences were subjected to the procedure described above to calculate the entropy of triplets and fraction of GC. Year, size and origin of each of these sequences were also collected. Normally a sequence is labeled with day and month it was collected, but if this information did not exist it was set as January 1st. Scatterplots ofSn and GC are shown in the next section as a function of the sequence year.
3.
Results
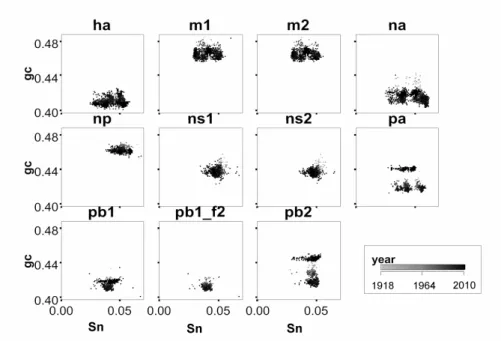
Figure 1 shows a scatter plot of GC andSn for all segments. In this figure we use a grey-scale palette to show the evolution over time for each segment. One may notice that the segments PB1, PB2, PB1-F2 and PA have greatest temporal vari-ability. Yet it is possible to note a general trend towards decreasing the value of GC across the years. A correlation of GC over time shows a tendency to diminish the value of GC for most segments (exeptions are PA, PB1 and PB2). Pearson coeffi-cient (first number between parentesis) and linear coefficoeffi-cient of a linear regression fitting (in GC/Y ear, second number) for each segment are computed as follows: HA(0.32379, 0.00015), M1(0.20355, 8E05), M2(0.18222, 7.4E05), NA(0.155, -7.7E-05), MP(0.45506, -7.6E-05), NS1(0.30572, -8.3E-05), NS2(0.36415, -8.6E-05), PA(0.387914, 0.000431), PB-F2(0.67261, -0.00013), PB1(0.040624, 2.2E-05) and PB2(0.286766, 0.000362).
Although a statistical test like linear correlation cannot be considered the best choice due to some abrupt changes, here it serves to infer a strong tendency for some elements, like PB1, NA and M2. We will discuss this in detail in the next section.
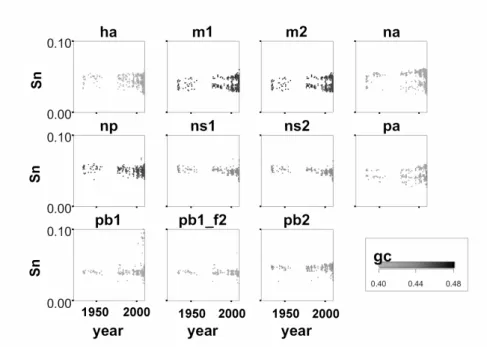
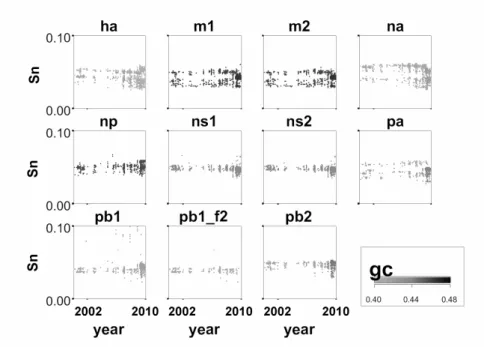
The behavior ofSn over time is the richest. Figure 2 shows the formation of clusters for NA, HA, PA, M1 and M2. More recently (close to 2009) the behavior of PA and PB1 is becoming more variable; PB1 mainly in connection with the 2009 outbreak. A closer look encompassing 2009 is depicted in Figure 3.
4.
Discussion
Figure 1: Plot ofSn×GC for all H1N1 segments. Year is plotted using a grey-scale
palette. This figure shows a picture of temporal evolution for the two quantities studied here in H1N1 segments. The existence of clusters and/or their formation over time implies in a mutation (or adaptation) of that segment. It is also worth noting that some segments, such as NS1 and NS2, are more stable.
Regarding GC content, we can see that some segments have greater variability than others over time but most of them are keeping the same tendency to change. In most cases it is a tendency towards decrease in the GC, but in other cases, as for PB2 and PA it seems to be a division into two clusters from a single initial block. These results are merely conjectural because historical data are incomplete and scattered; however we can infer that the behavior is at least self-consistent over time. Within this conception, PA, PB1 and PB2 are the sequences that show major changes.
Variations in sequences are well known, and similar changes in behaviour as seen above could be obtained for most segments simply by counting nucleotides (considering GC content only). However note that the PB2 segment has a different behavior: GC does not seem to have varied greatly, but its entropy tended to change considerably. Variations in entropy are not similar to variations in GC: Inspecting Figure 2 we can see a greater variability in the segments, and a tendency to form clusters.
A change in theSn value can be interpreted as an increase or decrease in the randomness with which the aa are encoded by the nucleotide chain. DecreasedSn
Figure 2: Sn as function of time. Here we used a gray-scale palette to draw a plot of GC content in the segments. Sn and GC show different patters of changes over time. There is a tendency to group some elements together in multiple clusters over time, as ha, m1, m2 and pa usingSn as clustering factor. This behaviour shows no correlation with GC and is a sign of triplet organization. We explore this behaviour deeper in the text. A detailed plot of the last decade is presented in Figure 3.
What happened, in terms of nucleotide sequence, at 2009 outbreak can be seen in Figure 3, where we expand the last 9 years (2001-2010). Here there was a sudden change in some segments, most visible for segments PB1, PB2 and PA. In the case of PB1 and PB2 there was a tendency to increase GC and Sn. For PA, while GC increased, we can see an abrupt decrease inSn.
A conclusion that can be achieved here is that the recent changes in the virus composition were large, but concentrated in some segments. An increase of GC in PA, at the same time that Sn decreases, indicates that there is a richness of bases (as it become closer to 0.5) but the triplets are much less organized. PB2 showed an increase in CG whileSn appears to stay fairly constant. Interestingly, HA has two distinct groups, one with a higher triplet organization and another less organized. NA has a tendency towards a lower Sn value in 2009, showing less organization. However less organization also implies in more possibilities.
Figure 3: Sn as function of time between 2001 and 2010. Note the abrupt change at 2009 oubreak for some segments (mainly PB2 and PA).
just the HA (hemagglutinin) responsible for binding the virus into the cell and ultimately NA, responsible for the onset of infection in the cell. The changes that occurred in NA seem to be toward even less organized triplet encoding for the same aa. Small changes in this particular segment (external) may mean that it (H1N1) is more resilient, managing to keep, for example, more free time before connecting to some cell. Alternatively, it might imply in higher efficiency for lung cell binding (for example), possibly leading to increase air transmissibility.
A segment that presented remarkable changes is PA itself, with an increase of GC and a decrease of entropy. PA is a phosphoproteinin vivoand a substrate of casein kinase II in vitro. This subunit induces the proteolytic process when expressed individually, affecting both coexpressed proteins and the PA protein itself [11].
These trends are a portrait of changes in the structure of the virus as an orga-nization of DNA sequences. Sequence analysis techniques, such as those presented here, do not allow to infer function, but they show possible ways to theoretizising while the pandemics is in full action. Without neglecting the other components of the virus machinery, the polymerase complex was the one that experienced most sudden changes, and this is consistent with a new phase of this disease which changes itself every season. A recent work [8] points out in this direction showing that H1N1, in the last outbreak, has reduced polymerase activity.
Acknowledgements
The authors wish to thank Dr. Mauro A. A. Castro for relevant suggestions while initial discussion of this work. We also thank CNPq and CAPES, Brazilian funding agencies for partially support this work. Also many kindly suggestions received during presentation of this work at CNMAC 2010 are very acknowledged as well as constructive criticisms from anonymous referees.
Resumo. Neste trabalho analisamos a entropia de tripletes em um conjunto de sequências do vírus H1N1. Correlacionamos medidas de entropia com concentração de Guanina-Citosina para um conjunto de mais de 30.000 sequências, controlando a cronologia dessas sequencias. Esta abordagem permitiu traçar um mapa das mudanças organizacionais vírus ao longo do século XX. A principal conclusão da análise foi mostrar que alguns segmentos do vírus estão apresentando mutação com uma taxa mais elevada do que outros ao longo dos anos e, em alguns casos, as sequências tendem a se aglomerar, formando novos subgrupos. A maior taxa de mutação foi encontrada precisamente nos segmentos PA e PB1, que são parte da maquinária de replicação do H1N1. Isto evidencia que medidas organizacionais, como essas aqui apresentadas, parecem refletir parcialmente a dinâmica dos seg-mentos e corroboram alguns resultados experimentais recentes, os quais mostram, entre outras coisas, que durante o último surto do vírus tem havido grandes mu-danças precisamente na atividade da polimerase. Este tipo de abordagem pode ajudar na escolha dos melhores alvos visando o tratamento dessa doença.
Palavras-chave. H1N1, entropia, DNA.
References
[1] D.A. Benson, I. Karsch-Mizrachi, D.J. Lipman, J. Ostell, D.L. Wheeler, GenBank Nucleic Acids Research, Jan 2008, 36 (Database issue): D25-30 (http://www.ncbi.nlm.nih.gov/genbank/).
[2] G.J.L. Gerhardt, N. Lemke, G. Corso; Network Clustering Coefficient approach to DNA Sequence Analysis,Chaos, Solitons and Fractals, (2006), 1037–1045.
[3] D. Jackson, M.J. Hossain, D. Hickman, D.R. Perez, R.A. Lamb, A new in-fluenza virus virulence determinant: the NS1 protein four C-terminal residues modulate pathogenicity, Proc. Natl. Acad. Sci., 105 (2008), 43816. PubMed
[4] S. Jameel, The 2009 influenza pandemic, Current Science, 98, No. 3 (2010),
306–311.
[5] B. Lewin, “Genes VII”, Oxford University Press, Oxford, 2000.
[6] J.A.T. Machado, A.C. Costa, M.D. Quelhas, Shannon, Rényie and Tsallis en-tropy analysis of DNA using phase plane, Nonlinear Analysis: Real World Applications,12(2011), 3135–3144.
[7] M.I. Nelson, E.C. Holmes, The evolution of epidemic influenza,Nature Reviews Genetics,8(2007), 196–210.
[8] C.P. Octaviani, H. Goto, Y. Kawaoka, Reassortment between Seasonal H1N1 and Pandemic (H1N1) 2009, Influenza viruses is restricted by limited compati-bility among polymerase subunits,The Journal of Virology,85, No. 16 (2011),
8449–8452.
[9] H.H. Otu, Khalid Sayood, A new sequence distance measure for phylogenetic tree construction,Bioinformatics,19, No. 16 (2003), 2122–2130.
[10] A. Rambaut, O.G. Pybus, M.I. Nelson, C. Viboud, J.K. Taubenberger E.C. Holmes, The genomic and epidemiological dynamics of human influenza A virus,Nature,453. No. 29 (2008), 615–620.
[11] J.J. Sanz-Ezquerro, J. Fernandez-Santaren, T. Sierra, T. Aragon, J. Ortega, J. Ortin, G. L. Smith, A. Nieto, The PA influenza virus polymerase subunit is a phosphorylated protein,J. Gen. Virol., 79(1998), 471–478.
[12] Y. Shi, I. Kanter, D. Kessler, Distributions of triplets in genetic sequences,
Physica A252(1998), 48–60
[13] M.P. Simmons, Potential use of host-derived genome signatures to root virus phylogenies,Molecular Phylogenetics and Evolution,49 (2008), 969–978.
[14] E.N. Trifonov, Elucidating sequence codes: three codes for evolution,Ann. NY Acad. Sci.,870(1999), 330–338.
[15] D. Zamarin, M.B. Ortigoza, P. Palese, Influenza A virus PB1-F2 protein con-tributes to viral pathogenesis in mice, J. Virol., 80 (2006), 7976 83. PubMed