PERFORMANCE EVALUATION OF
VARIOUS STATISTICAL CLASSIFIERS
IN DETECTING THE DISEASED
CITRUS LEAVES
SUDHEER REDDY BANDI
Assistant Professor, Department of Information Technology, Tagore Engineering College,
Rathinamangalam, Chennai, India, 600048 [email protected]
VARADHARAJAN A
Assistant Professor, Department of Information Technology, Tagore Engineering College,
Rathinamangalam, Chennai, India, 600048 [email protected]
A CHINNASAMY
Assistant Professor, Department of Information Technology, Tagore Engineering College,
Rathinamangalam, Chennai, India, 600048 [email protected]
Abstract :
Citrus fruits are in lofty obligation because the humans consume them daily. This research aims to amend citrus production, which knows a low upshot bourgeois on the production and complex during measurements. Nowadays citrus plants grappling some traits/diseases. Harm of the insect is one of the major trait/disease. Insecticides are not ever evidenced effectual because insecticides may be toxic to some gracious of birds. Farmers get outstanding difficulties in detecting the diseases ended open eye and also it is quite expensive. Machine vision and Image processing techniques helps in sleuthing the disease mark in citrus leaves and sound job. In this search, Citrus leaves of four classes like Normal, Greasy spot, Melanose and Scab are collected and investigated using texture analysis based on the Color Co-occurrence Method (CCM) to take Hue, Saturation and Intensity (HSI) features. In the arrangement form, the features are categorised for all leafage conditions using k-Nearest Neighbor (kNN), Naive Bayes classifier (NBC), Linear Discriminate Analysis (LDA) classifier and Random Forest Tree Algorithm classifier (RFT). The experimental results inform that proposed attack significantly supports 98.75% quality in automated detection of regular and struck leaves using texture psychotherapy based CCM method using LDA formula. Eventually all the classifiers are compared using Earphone Operative Characteristic contour and analyzed the performance of all the classifiers.
Keywords: Citrus, Texture analysis, Classification, Melanose, Greasy spot, Feature Extraction. 1. Introduction
Agriculture in India has a significant history. Agriculture and united sectors suchlike forestry and fisheries accounted for 16.6% of the GDP in 2011, about 50% of the unit force. The scheme part of cultivation to India’s GDP is steadily declining with the country's broad-based economic ontogeny [14]. Still, agriculture is demographically the broadest economic facet and plays a momentous personating in the overall socio-economic cloth of India. Farmers someone opened ambit of heterogeneity to select suited Fruit and Stem like crops. Notwithstanding, the cultivation of these crops for optimum consent and grade produce is highly study. It can be landscaped by the aid of discipline supporting. India ranks sixth in the creation of citrus production in the class. In India citrus fruits are grown primarily in Andhra Pradesh, Maharashtra, Punjab, Karnataka, Uttaranchal, Bihar, and Orissa.
The detecting of a circumstantial flora disease and the favoritism between anicteric and pathologic plants was the water think of several investigate groups. Citrus trees can walk a bread of symptoms reflecting varied disorders that can adversely tempt their health, forcefulness and fruitfulness to varying degrees. Identifying disease symptoms is substantive as incompatible actions may sometimes affirm to be pricy and prejudicious to the bear. The disease symptoms that present be addressed in this thesis are a consequential panorama of advert citrus creation programs. Suitable diseases examine actions or remedial measures can be undertaken if the symptoms are identified primordial. The various diseases exhibited by citrus leaves are Greasy spot (Mycosphaerella citri), Melanose (Diaporthe citri), Scab (Elsinoe fawsettii).
In the once period, agricultural applications using appearance processing and ornament recognition techniques love been attempted by varied researchers much as detecting of band in a facility, sorting of product on a conveyor path in fruit processing business, etc. A ascertain of techniques get been affected to notice defects and diseases correlative to citrus [1]. Obtained reflectance spectra of citrus product and whatever appear defects [2] analyzed spying in citrus leaves using machine vision in unreceptive environs and gave an accuracy of 95% [6] developed a machine vision system to detect and place tomato seedlings and weed plants in commercial farming surroundings using objective spatiality matching methods [4].
The old intermediate indicator co-occurrence features to study remotely detected images. They computed organization raze co-occurrence matrices for one pixel offset with quaternary directions (0°, 45°, 90° and 135°). For a seven-class arrangement problem, they obtained about 80 % classification accuracy using texture features [3]. Matured a texture-based weed classification method using Gabor wavelets and neural networks for real-time selective herbicide application [5]. Formulated an automatic detection system for detecting apples fit for glean, for the cure of robotic production harvesting using color based systems. The method proposed in [8] Aleixos Formed a multispectral camera system that could acquire circumpolar and left frequency images from the selfsame shot, and victimized it on a real-time system for detecting defects on citrus surface. Most recently, Blasco [9] reported the application of near-infrared, ultraviolet and fluorescence computer vision systems to identify the average defects of citrus fruit. They planned a fruit sorting algorithm that combines the polar spectral collection to assign product according to the type of defect. Their results showed that non-visible information can change the determination of few defects. The method planned here is identical to [2], but the experiments were performed in outdoor conditions in which predictable complexities same time and system were low. And also various classification algorithms like kNN, LDA, NBC and RFT were implemented and evaluated their performance.
In the number of the proportion Section 2 describes the image sample collection. Section 3 presents the methodology of the proposed production which includes image acquisition and feature extraction. Different simulate acceptance classifiers are described in Section 4. Section 5 summarizes the empirical results followed by Conclusion in Section 6.
2. Materials and Methods 2.1 Image Sample Collection
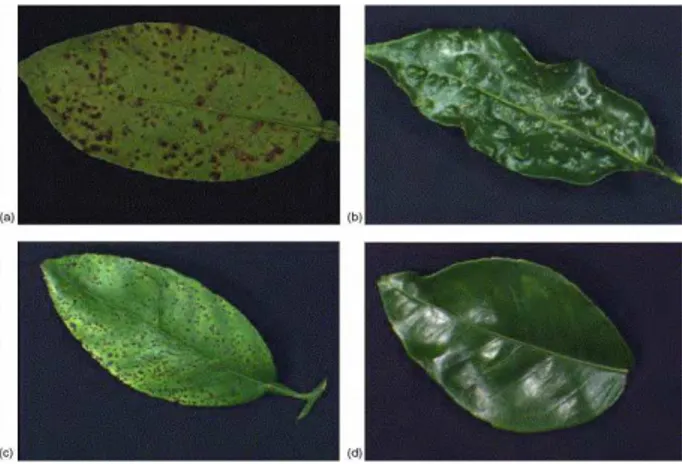
The leaf samples victimised in this were composed from purushotham lemon garden near Venkatagiri which is located in Andhra Pradesh, India during summer and fall of 2012. Four different classes of leaves were designated for this study. The leaf sample conditions are normal, sebaceous characteristic, melanose and scab. Forty samples of each of the cardinal classes were collected. The 40 images of apiece aggregation were divided into two close sets, 20 samples for upbringing and 20 samples for testing, to secure that both the preparation and testing phases were representative of the accumulation of pathologic of the folio were acquired using digital microscope system. The digital color images were reclaimed in uncompressed JPEG format.
The images of different classes of leaf are given in Figure 1.
3. Methodology of Proposed work
The methodology of proposed work is divided into two stages. They are Image Acquisition and Feature Extraction. The detailed description of the proposed work is illustrated in Figure 2.
3.1 Image Acquisition
In the initial step, the RGB images of all the folio samples were obtained. For apiece individual image in the dataset the stalking steps were performed. In the premier measure, furnish spotting is performed using Sobel Bounds device rule which aims at identifying points in a digital person at which the representation luminance changes sharply or, much formally, has discontinuities. In the close tread low pass filtering (smoothing) is applied to bind the racket in the pixels using median filter. In the incoming maneuvers, the image size was reduced from 480x640 pixel resolution to 240x320 pixel resolutions.
Figure 2: Diagrammatic illustration of Image Acquisition and Feature Extraction of Citrus leaf.
3.2 Feature Extraction
The approach for the feature extraction is Texture Analysis based CCM method. Texture is characterized as systematic review of pattern or element on a surface.
Textures offer great characteristics for appear and goal uncovering from aerial or satellite photographs, medical images and so on.
Texture is a possession of areas; the texture of a tip is undefined. So, texture is a contextual conception and its definition moldiness requires poet values in a abstraction neighborhood. Texture involves the spatial dispersion of gray levels. Thus, two-dimensional histograms or co-occurrence matrices are rational texture analysis tools. The use of color image features in the panoptical spectrum provides further human dimension features over the conventional gray-scale performance. The CCM procedure consisted of the people special mathematical processes. First the RGB images of leaves were transformed to a Hue, Saturation and Intensity (HIS) color space representation. Grade was premeditated using the mean value of the three RGB values.
The hue and saturation values were determined using a geometrical transformation of the International Commission on Illumination’s (CIE) chromaticity diagram (Ohta, 1985) [10]. The formulae for HSI can be given as follows:
(1)
, ,
(2)
/ (3)
The pixel RGB values shape the chromaticity coordinates on the hue and permeation area, which are then used to geometrically estimate the measure of hue and saturation [10].
Apiece pixel map was misused to create a race co-occurrence matrix after the HSI person was completed, resulting in triad CCM matrices. That is, one CCM matrix for each of the HSI element maps. Finished the use of spatial gray-level dependency matrices (SGDM's), the color co-occurrence texture analysis method was practical. The SGDMs are represented by the work p(i,j) which is granted in Equalization 4, where i represents the grayish
Original RGB Leaf image (480x640)
Edge Detection using Sobel and Filtering using Median Filter
Cropped RGB Leaf image (240x320)
Extracting HSI features from RGB image SGDM matrix
for H,S, I features Text Features
(13x3=39)
Training:20 samples Testing: 20 samples
Classification using various statistical Classifiers
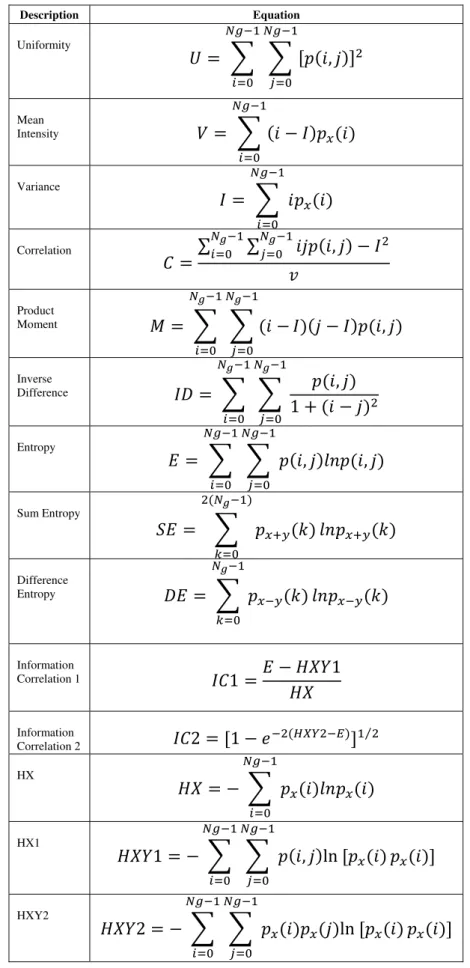
Table 1: Texture Features
Description Equation
Uniformity
,
Mean Intensity
Variance
Correlation
∑
∑
,
Product
Moment
,
Inverse
Difference
,
Entropy
,
,
Sum Entropy
Difference Entropy
Information Correlation 1
Information
Correlation 2 ⁄
HX
HX1
, ln
HXY2
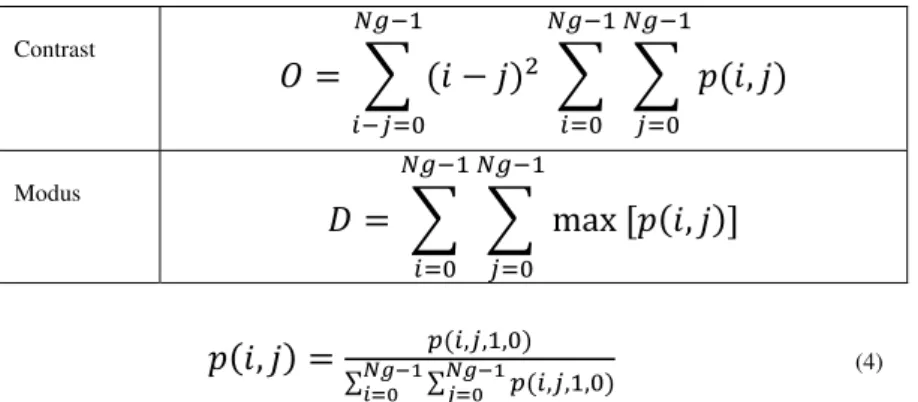
Contrast
,
Modus
max
,
Where,
,
, , ,∑ ∑ , , , (4)
Explained that these matrices abstraction the chance that a element at one special grey destroy module become at a knifelike length and class from any pixel acknowledged that pixel has a indorse particular color destroy. From the SGDM matrices, the 39 CCM texture statistics were generated for apiece icon using tierce color feature co-occurrence matrices. Apiece SGDM matrices provided 13 texture features which were described in [12] and tabulated in Table 1, resulting in a total of 39 features for image.
4. Classification and Results 4.1 kNN classifier
In activity approval, the k-nearest neighbor algorithm (k-NN) is a method for classifying objects based on closest activity examples in the film space. k-NN is a type of instance-based acquisition, or lazy acquisition where the function is exclusive approximated locally and all computing is deferred until categorization. The k-nearest neighbor algorithm is amongst the simplest of all machine acquisition algorithms: an object is restricted by a age franchise of its neighbors, with the entity existence appointed to the gathering most public amongst its k nearest neighbors (k is a constructive integer, typically flyspeck). If k = 1, then the target is simply appointed to the gathering of its nearest neighbor. The breeding point of the rule consists exclusive of storing the feature vectors and experiment disk is sensitive by assigning the judge which is most prevailing among the k preparation samples nearest to that query.
Table 2: Classification Results for K-NN Classifier
Test Dataset Trained Dataset
Normal Greasy spot Melanose Scab
Normal 16 0 1 3
Greasy spot 0 20 0 0
Melanose 5 0 12 3
Scab 2 0 4 14
4.2 Naive Bayes Classifier
The estimates of the probability group are utilized as input for a Naive Bayes classifier [13]. This classifier simply computes the probationary probabilities of the assorted classes presented the values of attributes and then selects the education with the highest conditional chance. If an happening is described with n attributes ai
(i=1….n), then the categorize that instance is secret to a separate v from set of viable classes V according to a
Maximum a Posteriori (MAP) Naïve Bayes classifier is:
arg max
∏
|
The conditional probabilities in the above formula are obtained from the estimates of the probability mass function using training data. In the classification (testing) state for each class vi∈V we compute the formula and
we select the most probable class v.
∏
|
(6)
4.3 Linear Discriminant Analysis
Discriminant analysis is a statistical technique to sort objects into mutually alone and thorough groups based on a set of mensurable object's features. Statement Discriminant reasoning comes with umpteen contrary names for difference champaign of speculate. It is also often called copy remembering, supervised learning, or supervised
4.4 Random Forest Tree Classifier
Random forest is an ensemble classifier that consists of galore option trees and outputs the category that is the style of the classes output by particular trees. Random Forests grows numerous classification trees. To classify a new objective from an signaling transmitter, put the signal transmitter thrown each of the trees in the ground. Each tree gives a classification, and we say the tree "votes" for that class. The forest chooses the classification having the most votes (over all the trees in the forest). Random forests works as follows
For prediction a new consume is pushed down the tree. It is assigned the hold of the breeding consume in the terminal node it ends up in. This procedure is iterated over all trees in the collection, and the mode vote of all trees is according as random forest prevision
Table 3: Classification Results for Naive Bayes Classifier
Test Dataset Trained Dataset
Normal Greasy spot Melanose Scab
Normal 20 0 0 0
Greasy spot 0 20 0 0
Melanose 3 0 17 0
Scab 1 0 0 19
5 Experimental Results
The trained features which are obtained from citrus leaves using texture analysis are stored in a data set. In the next step tested features are stored in different data set. Each and every class is tested differently to differentiate from normal and diseased leaves. The experiments for the proposed approach were conducted on a personal computer with an Intel Core 2 Duo processor (2.19 GHz) and 1 GB RAM configured with Microsoft Windows XP and Matlab 7.5 software with image processing toolbox and bio informatics toolbox.
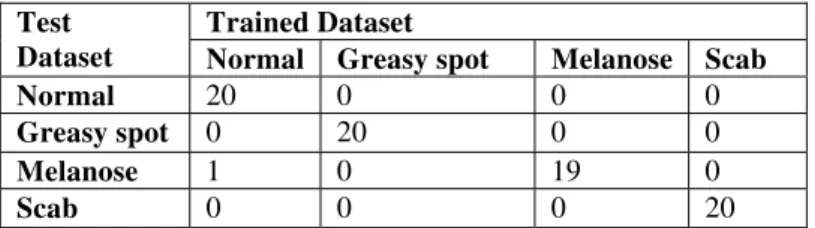
Table 4: Classification Results for LDA Classifier
Test Dataset
Trained Dataset
Normal Greasy spot Melanose Scab
Normal 20 0 0 0
Greasy spot 0 20 0 0
Melanose 1 0 19 0
Scab 0 0 0 20
Both the trained and tested data set are classified using various pattern recognition classifiers. The results shown in Table 2 were obtained using k-NN classifier. The results were part of preliminary investigations, which used a non-real time classification approach. The results found during this study provide a benchmark for comparing real-time classification approaches, since the classification results were nearly perfect. The classification rate for k-NN classifier is 77.5%. Classification rate can be found from equation 7. The results shown in Table 3 were obtained using the Naive Bayes Classifier. The number in a particular cell indicates the correctly classified leaves against all the conditions of the leaves. The results reported better accuracies for all the data models. The overall accuracy achieved using Naïve Bayes classifier is 95% which is far better than k-NN classifier.
.
.
Table 5: Classification Results for Random Forest Classifier
Test Dataset Trained Dataset
Normal Greasy spot Melanose Scab
Normal 20 0 0 0
Greasy spot 0 20 0 0
Melanose 1 0 19 0
Scab 1 0 0 19
greasy spot diseased leaves can be classified easily whereas melanose affected leaves classification rate is less. Table 6 compares the classification rates of all the classifiers. From the table, it is clear that LDA gives better classification than other classifiers whereas k-NN gives the least classification rate.
Table 6: Classification Results of Different Classifiers
Classifier Classification Rate
kNN 77.5 NBC 95 LDA 98.75 RFT 97.5
Table 7: General structure of Confusion matrix
Condition
Positive Negative Test
Outcome
Positive True Positive (TP)
False Positive (FP) (Type I error)
Negative False Negative (FN) (Type II error)
True Negative (TN)
Total=P+N P N
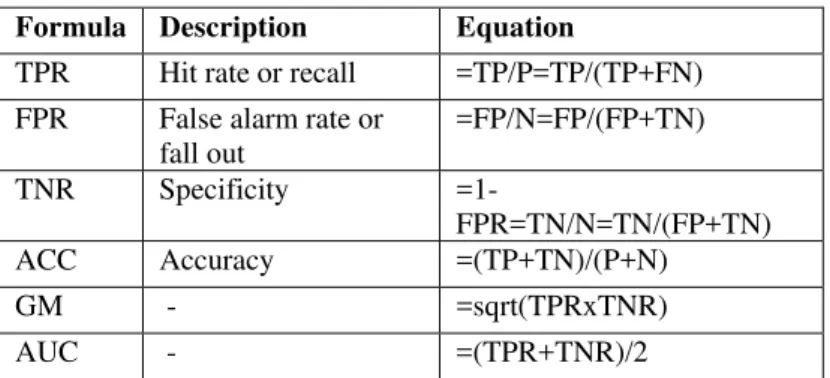
In this work apart from Classification rate, other measures such as True positive rate (TPR). True Negative rate (TNR), Geometric Mean (GM) and Area Under Classification (AUC) which are more appropriate for imbalanced problems are considered and the values are tabulated in Table 11. Table 7 gives the general structure of confusion matrix from which we can calculate the various measures like TPR, TNR, GM and AUC. In predictive analytics, a table of confusion (sometimes also called a confusion matrix), is a table with two rows and two columns that reports the number of false positives, false negatives, true positives, and true negatives. This allows more detailed analysis than mere proportion of correct guesses (accuracy). Accuracy is not a reliable metric for the real performance of a classifier, because it will yield misleading results if the data set is unbalanced (that is, when the number of samples in different classes vary greatly). Since this is a multi class problem we have to calculate confusion matrix separately for each and every class of data and we have to average the matrix to get the final confusion matrix. In Table 6 condition is known as the train data whereas the test outcome is the result generated due to test data.
Table 8: Metrics to measure performance of pattern classifiers
Formula Description Equation
TPR Hit rate or recall =TP/P=TP/(TP+FN) FPR False alarm rate or
fall out
=FP/N=FP/(FP+TN)
TNR Specificity
=1-FPR=TN/N=TN/(FP+TN) ACC Accuracy =(TP+TN)/(P+N)
GM - =sqrt(TPRxTNR)
AUC - =(TPR+TNR)/2
Table 9: One-vs-All matrix for all classes of leaves of all classifiers
N vs All G vs All M vs All
S vs All LDA 20 0 20 0 19 1 20 0
1 59 0 60 0 60 0 60
RFT 20 0 20 0 19 1 19 1
2 58 0 60 0 60 0 60
NBC 20 0 20 0 17 3 19 1
4 56 0 60 0 60 0 60
kNN 16 4 20 0 12 8 14 6
7 53 0 60 5 55 6 54
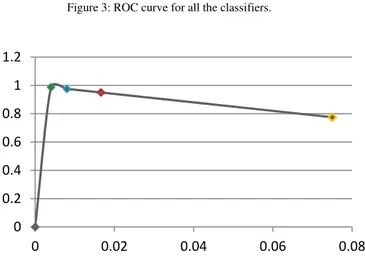
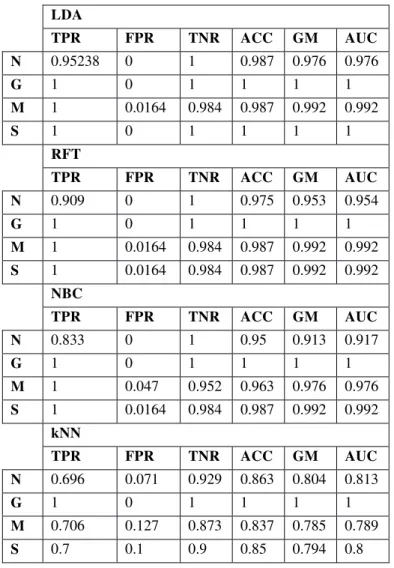
From TP, FP, TN, FN we can calculate the performance metrics of classifiers which are tabulated in Table 11 for Table 9 whereas Table 12 gives the overall performance metrics of all the classifiers which are derived from Table 10. Figure 3 depicts the Receiver Operating Characteristic (ROC) curve of all the classifiers which is measured from the TPR and FPR of Table 11. It is also known as precision recall curve. From the curve it is clearly know that the Green color point indicates the TPR and FPR for LDA classifier which has the least FPR and maximum TPR. The accuracy for the LDA is maximum when compared to other pattern recognition classifiers.
Table 10: Sum of One-vs-All matrix of all Classifiers
LDA Tree NBC kNN
79 1 78 2 76 4 62 18
1 239 2 238 4 236 18 222
Figure 3: ROC curve for all the classifiers.
6 Conclusion
Initially four sets of citrus leaves (Normal, Greasy Spot, Melanose and Scab) were collected and investigated from the citrus garden in outdoor conditions. Image processing algorithms were used for feature extraction and classification. Images of the leaf surface were extracted from the original RGB images, and then converted into Hue, Saturation, and Intensity (HSI) color space representation using CCM (Color Co-occurrence Methodology), which uses both the color and texture of an image to arrive at unique features that represent the image. Each HSI image was used to generate Spatial Gray-level Dependence Matrices (SGDM). Once SGDMs were generated, a total of 39 image texture features were obtained from each citrus leaf sample. Classification tests were conducted on four alternate classification algorithms: a statistical classifier using the Naïve Bayes Classifier achieved overall classification accuracies as high as 95%, a nearest neighbor classifier using the K- Nearest Neighbor achieved overall accuracies as high as 77.5%, and a Discriminant analysis classifier using linear functions achieved overall accuracies as high as 98.75% whereas Random Forest Tree algorithm achieved classification rate of 97.5%.
From the analysis it is clear that Normal leaves and Greasy spot leaves can be classified easily from the other classes of leaves. Whereas Melanose diseased leaves classification rate is less. From Table 5 it is clear that classification rate for Linear Discriminant Analysis classifier is very high indicating that the classification model
0 0.2 0.4 0.6 0.8 1 1.2
is robust in classifying the citrus leaves according to their conditions where as classification rate for kNN classifier is very low.
Table 11: Performance metrics for all Classifiers from One-vs-All matrix
LDA
TPR FPR TNR ACC GM AUC
N 0.95238 0 1 0.987 0.976 0.976
G 1 0 1 1 1 1
M 1 0.0164 0.984 0.987 0.992 0.992
S 1 0 1 1 1 1
RFT
TPR FPR TNR ACC GM AUC
N 0.909 0 1 0.975 0.953 0.954
G 1 0 1 1 1 1
M 1 0.0164 0.984 0.987 0.992 0.992
S 1 0.0164 0.984 0.987 0.992 0.992
NBC
TPR FPR TNR ACC GM AUC
N 0.833 0 1 0.95 0.913 0.917
G 1 0 1 1 1 1
M 1 0.047 0.952 0.963 0.976 0.976
S 1 0.0164 0.984 0.987 0.992 0.992
kNN
TPR FPR TNR ACC GM AUC
N 0.696 0.071 0.929 0.863 0.804 0.813
G 1 0 1 1 1 1
M 0.706 0.127 0.873 0.837 0.785 0.789
S 0.7 0.1 0.9 0.85 0.794 0.8
Table 12: Performance metrics for all Classifiers from Sum of One-vs-All matrix
TPR FPR TNR ACC GM AUC
LDA 0.987 0.004 0.996 0.994 0.996 0.996
RFT 0.975 0.008 0.992 0.987 0.967 0.983
NBC 0.95 0.0166 0.983 0.975 0.933 0.966
kNN 0.775 0.075 0.925 0.887 0.717 0.85
Acknowledgment
This work has been supported by the TAGORE ENGINEERING COLLEGE and also the authors would appreciate the work of Literature Survey who provided useful information for further research.
References
[1] Gaffney, J. J., "Reflectance properties of citrus fruits," Trans. ASAE. 16(2), 310-314 (1973).
[2] Pydipati, R., Burks, T. F. and Lee, W. S., "Identification of citrus disease using color texture features and discriminant analysis," Comput. Electron. Agri. 52(1-2), 49-59 (2006).
[3] Tang, L., L.F. Tian, B.L. Steward, and J.F. Reid. 1999. Texture based weed classification using gabor wavelets and neural networks for real time selective herbicide applications. ASAE/CSAE-SCGR Annual international meeting, Toronto, Canada. Paper No. 993036.
[7] Polek, M., G. Vidalakis and K. Godfrey. 2007. Citrus bacterial canker disease and Huanglongbing (citrus greening), University of California, Agricultural and Natural Resources, Publication 8218, ISBN-13: 978-1-60107-439-3, ISBN-10: 1-60107-439-5. [8] Aleixos, N., Blasco, J., Navarron, F. and Molto, E., "Multispectral inspection of citrus in real-time using machine
[9] Blasco, J., Aleixos, N., Gomez, J. and Molto, E., "Citrus sorting by identification of the most common defects using multispectral computer vision," J. Food Eng. 83(3), 384-393 (2007).
[10] Ohta, Y. 1985. Knowledge-based interpretation of outdoor natural color scenes. Pitman Publishing Inc., Marshfield, M.A
[11] Shearer, S.A. Plant identification using color co-occurrence matrices derived from digitized images, OhD diss, Columbus, Ohio: Ohio State University 1986.
[12] Shearer, S.A. and R.G. Holmes. 1990. Plant identification using color co-occurrence matrices. Trans. ASAE 33(6): 2037-2044. [13] T. M. Mitchell, Machine Learning. New York:
[14] www.wikipedia.org/
Sudheer Reddy B is an Assistant Professor in the Department of Information Technology in Tagore Engineering College. His research interest includes image processing, human computer interaction. He obtained his M.E Degree from Annamalai University in the Department of Computer Science and Engineering. He has published three articles in international journals/conferences.
Varadharajan A is an Assistant Professor in the Department of Information Technology in Tagore Engineering College. His area of research includes Image Processing and Open Source Technology. He obtained his M.E Degree from Crescent Engineering College in the Department of Computer Science and Engineering. He has published four articles in international journals and national conferences.